

Market Data
December 18, 2018
SMU Energy Analysis: Oil Price Plummets, But Natural Gas Surges
Written by Peter Wright
Steel Market Update is sharing this Premium content with Executive members in this issue. For information on upgrading to a Premium-level subscription, email Info@SteelMarketUpdate.com.
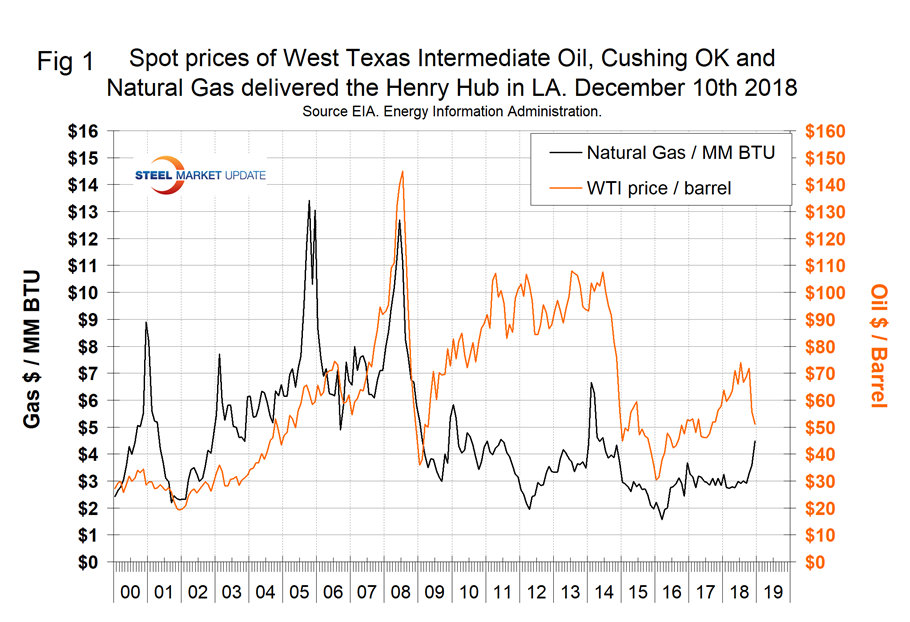
The price of West Texas Intermediate crude oil has declined by $25.33 per barrel since Oct. 3. The price of natural gas is surging.
The spot price of West Texas Intermediate (WTI) FOB Cushing Okla., had a recent peak on Oct. 3 of $76.40 per barrel. By Dec. 10, the price had declined to $51.07 with a drop of $1.91 in the previous week. The total number of operating rigs exploring for oil and gas has declined by 11 in the last month. The prices of oil and natural gas drive the consumption of energy-related steel products including oil country tubular goods, pipe fittings and well head equipment, among others. Welded tubular goods (not including OCTG) consumed about 5.5 million tons of hot rolled sheet in 2017.
Figure 1 shows historical oil and gas prices from January 2000 through Dec. 7, 2018. Our price and inventory data come from the EIA (Energy Information Administration). The EIA expects Brent spot prices will average $61 in 2019 and that West Texas Intermediate crude oil prices will average about $7 per barrel lower. WTI was priced at $51.07 on Dec. 10; Brent crude was $60.29 realizing a differential of $9.22, which was down from $9.82 this time last month. In their short-term energy outlook released on Dec. 11, the EIA reported that the Henry Hub natural gas spot price averaged $4.15/million British thermal units (MMBtu) in November, up $0.87/MMBtu from the October average. Cold temperatures and low inventory levels contributed to the increase in price. Despite low inventory levels, EIA expects strong growth in U.S. natural gas production to put downward pressure on prices in 2019. EIA expects Henry Hub natural gas spot prices to average $3.11/MMBtu in 2019, down 6 cents from the 2018 average and down from a forecast average price of $3.88/MMBtu in the fourth quarter of 2018. The price of natural gas at the Henry Hub in Louisiana began its winter escalation early this year. Gas closed at $4.49/MMBtu on Dec. 7.
On Dec. 7, the EIA reported that U.S. commercial crude oil inventories (excluding those in the Strategic Petroleum Reserve) decreased by 1.2 million barrels from the previous week. At 442.0 million barrels, U.S. crude oil inventories are about 7 percent above the five-year average for this time of year. Figure 2 shows the inventory level, including the strategic petroleum reserve and the year-over-year change.
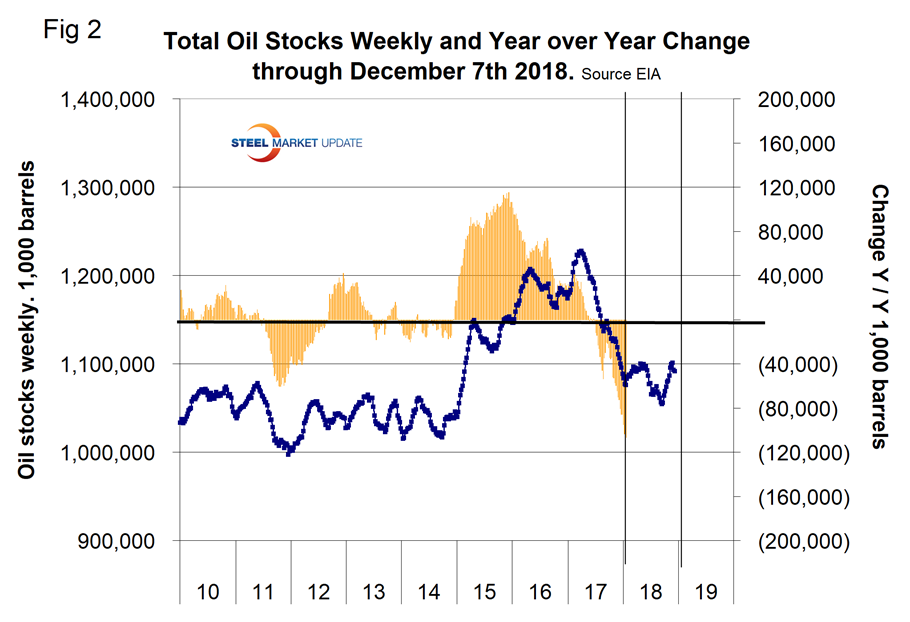
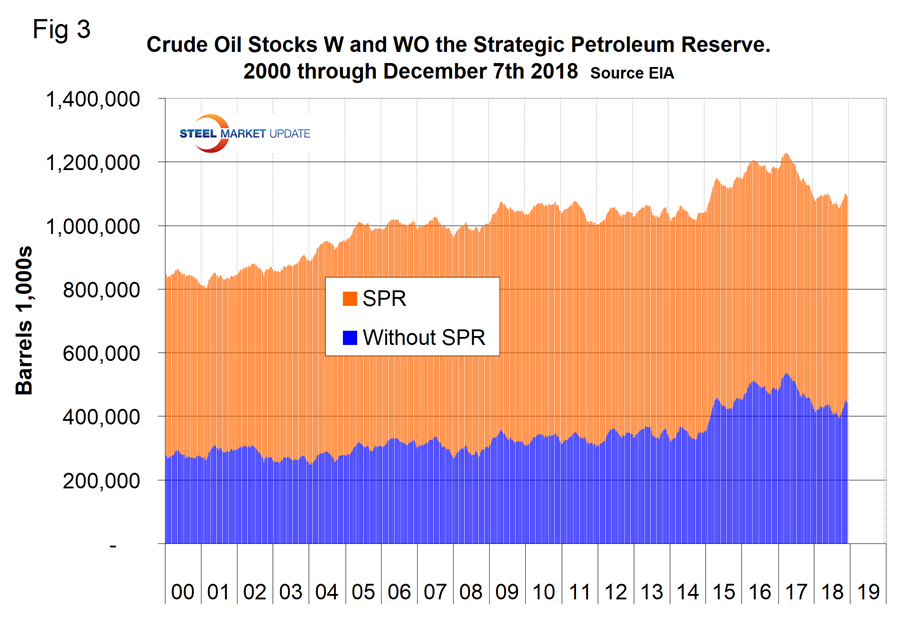
Figure 3 breaks total crude inventory into the working portion and the strategic petroleum reserve.
The total number of operating rigs in the U.S. on Dec. 14 was 1,071, down from 1,082 in our last monthly update, but up from 924 at the beginning of the year. The total number of operating rigs exploring for oil and gas has only increased by nine in the last six months. Figure 4 shows the total number of operating rigs in the U.S. and the weekly change.
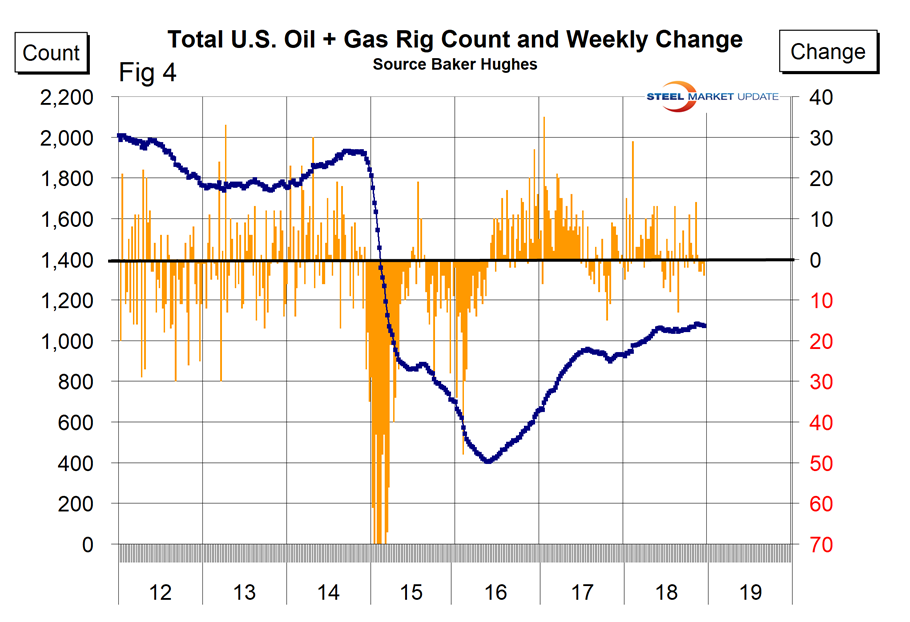
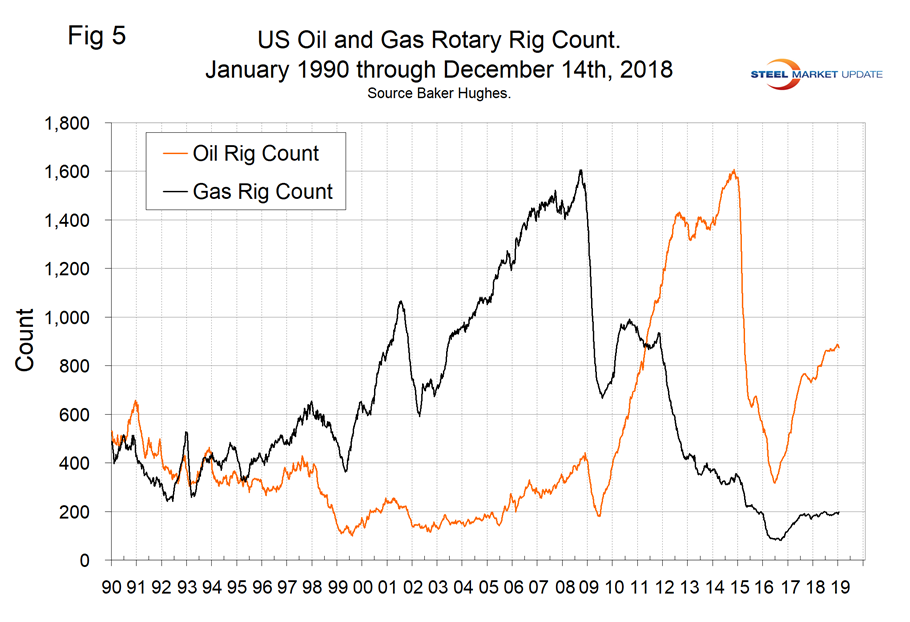
The oil rig count had a low point of 316 on June 27, 2016, and stood at 873 on Dec. 14, 2018. The count has increased by 131 year to date in 2018.
The U.S. gas rig count rose from its low point of 81 on Aug. 5, 2016, to 198 on Dec. 14. There has been exactly zero increase in the gas rig count since May 25 this year. The year-over-year growth rate of total U.S. operating rigs was 15.2 percent in the latest data with oil up by 16.9 percent and gas up by 8.2 percent. Figure 5 shows the Baker Hughes U.S. Rotary Rig Counts for oil and gas equipment in the U.S. (explanation below).
On a regional basis in the U.S., the big three states for operating rigs are Texas, Oklahoma and North Dakota. Figure 6 shows the land rig count in those states since 2000.
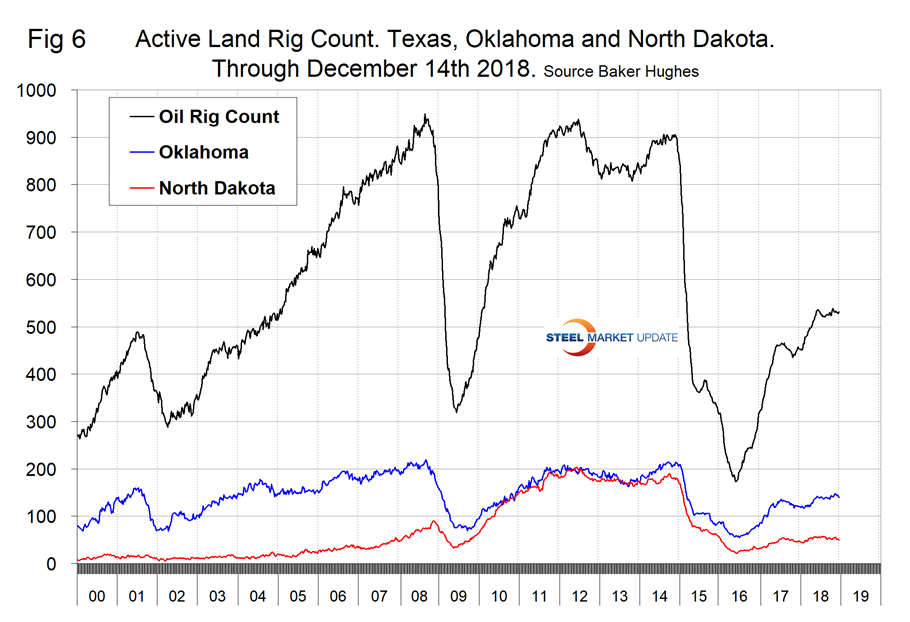
Figure 7 illustrates the monthly U.S. oilfield production of crude from January 1970 through September 2018 (latest data available) in thousands of barrels per month. The historical high was October 1970 at 310.4 million barrels. Production steadily declined to half that level in the late 2000s before the fracking revolution kicked in. December 2017 broke the record that had stood for 47 years with 310.7 million barrels produced, and August 2018 set a new record at 351.7 million barrels. The EIA forecasts that U.S. crude oil production will average 10.7 million barrels per day in 2018, up from 9.4 million in 2017, and will average 11.7 million barrels per day in 2019. EIA estimates that U.S. crude oil production averaged 11.5 million barrels per day in November, up 150,000 from October levels because of platforms resuming normal operations after hurricane-related outages in October. During the week ending Nov. 30, 2018, the United States exported more crude oil and petroleum products than it imported for the first time since the series began in 1991. From Nov. 24-30, the United States exported an estimated record 3.2 million barrels per day of crude oil, as well as an estimated 5.8 million barrels per day of petroleum products such as distillate fuel oil, motor gasoline and propane.
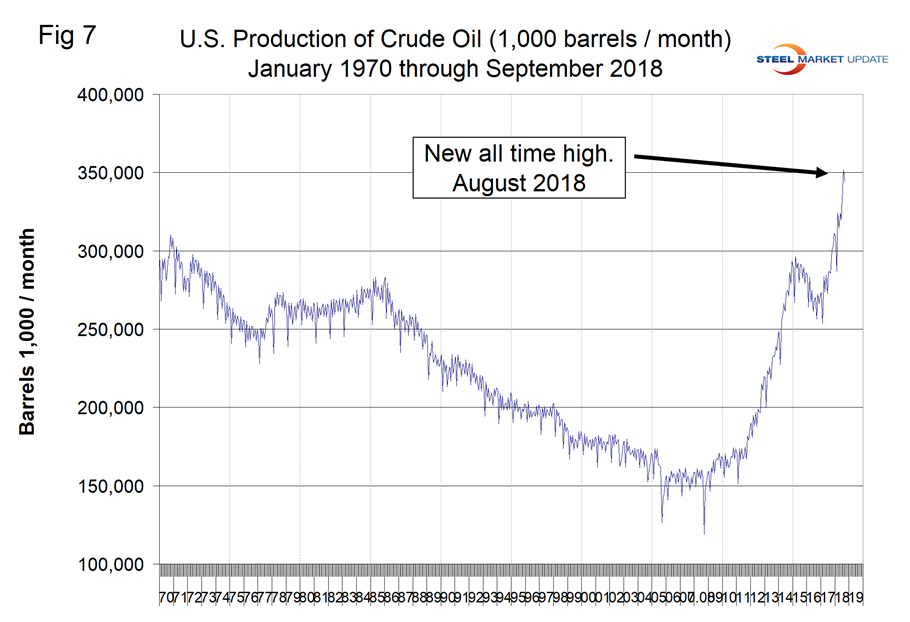
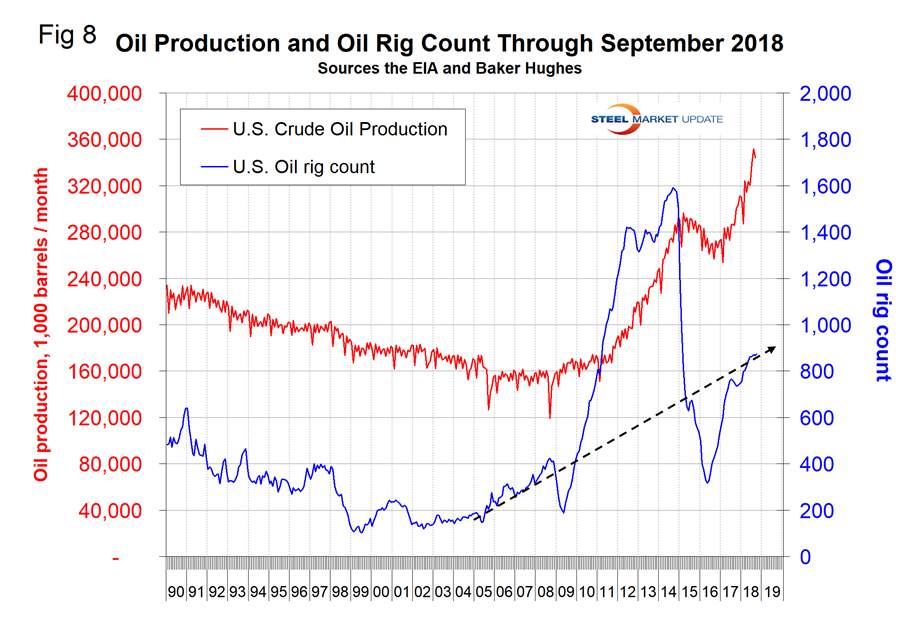
Figure 8 compares oil production and the oil rig count and shows how the increase in exploratory wells drove production from 2009 through late 2014 when the oil price collapsed. The subsequent decline in production was much less marked and is again setting new records. Our take on this is that the huge increase in exploratory oil rigs beginning in 2009 may have been an anomaly and that we won’t see a repeat of the number operating in 2014 for a very long time.
Baker Hughes Rotary Rig Count: This is a weekly census of the number of drilling rigs actively exploring for or developing oil or natural gas in the United States. Rigs are considered active from the time they break ground until the time they reach their target depth and may be establishing a new well or sidetracking an existing one. The Baker Hughes Rotary Rig count includes only those rigs that are significant consumers of oilfield services and supplies.


