

Market Data

June 30, 2022
BEA: US GDP Downgraded Again in Q1's Final Review
Written by David Schollaert
The US economy shrank in the first quarter of 2022 at a slightly worse rate than expected, with gross domestic production declining at a -1.6% annualized pace, according to the third and final estimate from the US Commerce Department’s Bureau of Economic Analysis (BEA).
The third review for Q1 was a slight downward revision from its first estimate of -1.5%, in line with most economists’ expectations and the worst since the pandemic-induced recession in 2020. Last quarter marked the first drop in GDP since the second quarter of 2020 – when Covid upended the economy – and a sharp reversal from an annual growth rate of 6.9% from October through December, the best performance since 1984.
Multiple factors weighed against growth during the first three months of the year. Chief among them was consumer spending, which failed to reach expected levels – up by just 1.8% instead of the 3.1% forecast. That spending accounts for about two-thirds of US economic output. The decline was partly offset by an upward revision to private inventory investment.
Spending on large goods such as cars and recreational items was revised lower, while businesses accumulated inventories at a higher rate than expected. The US consumer is also enduring the effects of soaring inflation, the result of an increase in the price of essentials and potentially stifling spending moving forward.
Earlier this month, the US Federal Reserve increased interest rates by three-quarters of a percentage point – the sharpest hike in 28 years. The benchmark rate now stands at a range of 1.5% to 1.75%, levels that have not been seen since before the pandemic began. And more increases are still possible.
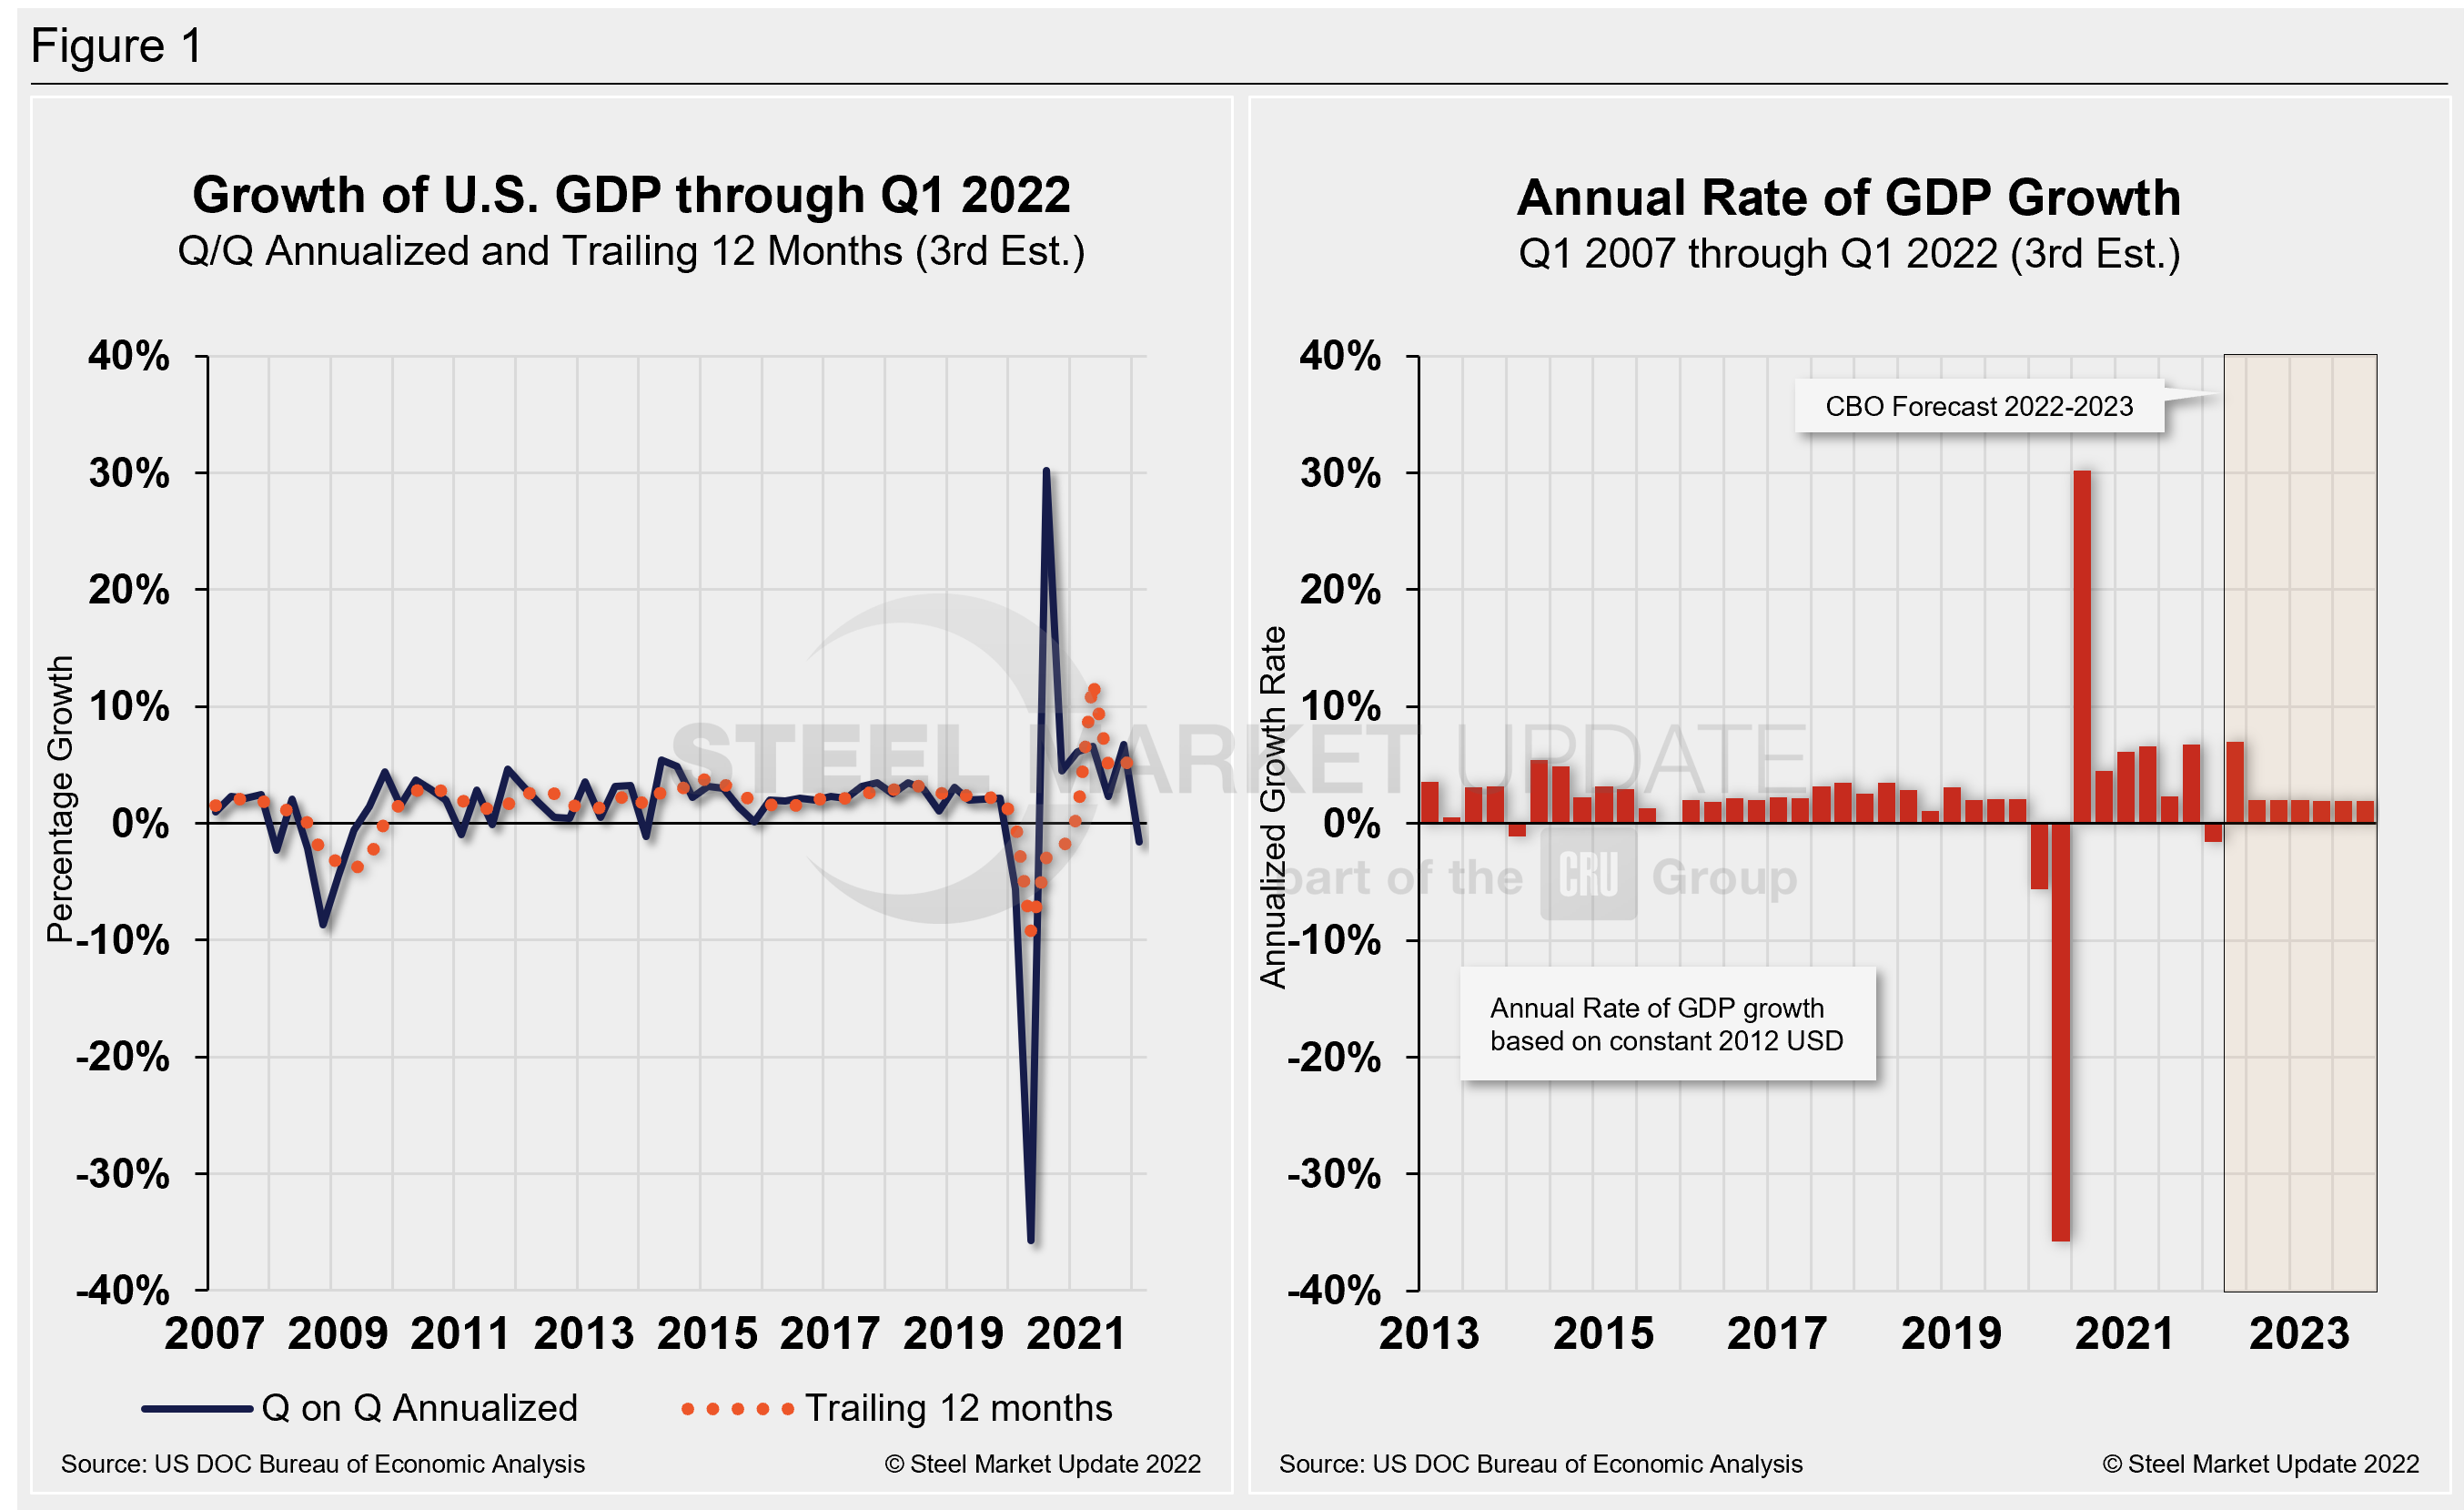
Commerce’s third look put total US GDP in Q1 at $24.39 trillion, a 6.6% increase, or $383.9 billion, over the previous quarter. Below in Figure 1 is a side-by-side comparison of US GDP growth and the annual rate of GDP, both through Q1 2022. In the first chart, you’ll see the contrast between the trailing 12-month growth and the headline quarterly result. The chart on the right details the headline quarterly results since Q1 2007, including the Congressional Budget Office’s GDP projection through 2023.
On a trailing 12-month basis, GDP accelerated to 3.53% in the first quarter, down from 5.53% in the prior quarter but still well behind 12.23% growth in Q2. Yet, it’s a vast improvement from -9.27% in Q2 2020 at the height of the pandemic. For comparison, the average in 49 quarters since Q1 2010 has been a growth rate of 2.17%.
Two years after the pandemic first struck, the US economy faces many challenges. While the latest GDP report pointed to a slowdown in economic growth, the headline figure was skewed by a jump in the US goods trade deficit amid severe supply chain disruptions driven by Russia’s invasion of Ukraine. All these factors have heavily impacted already high inflation.
Consumer spending, despite being downwardly revised, still rose at a modest rate despite decades-high inflation. The BEA also pointed to a shift in spending on services, led by housing, utilities, and “other” services. Within goods, consumers spent less on non-durable goods, including groceries and gasoline, and more on durable goods, led by motor vehicles and parts.
One quarter of negative economic growth in the books adds to fears that a recession may be looming.
Current forecasts estimate GDP to rise between 0.3% to as high as 2.9% in the second quarter and 2.5% for all of 2022. That’s a significant decline from the original 4.2% growth estimate signaled at the beginning of the year, according to a survey from the Federal Reserve Bank of Philadelphia.
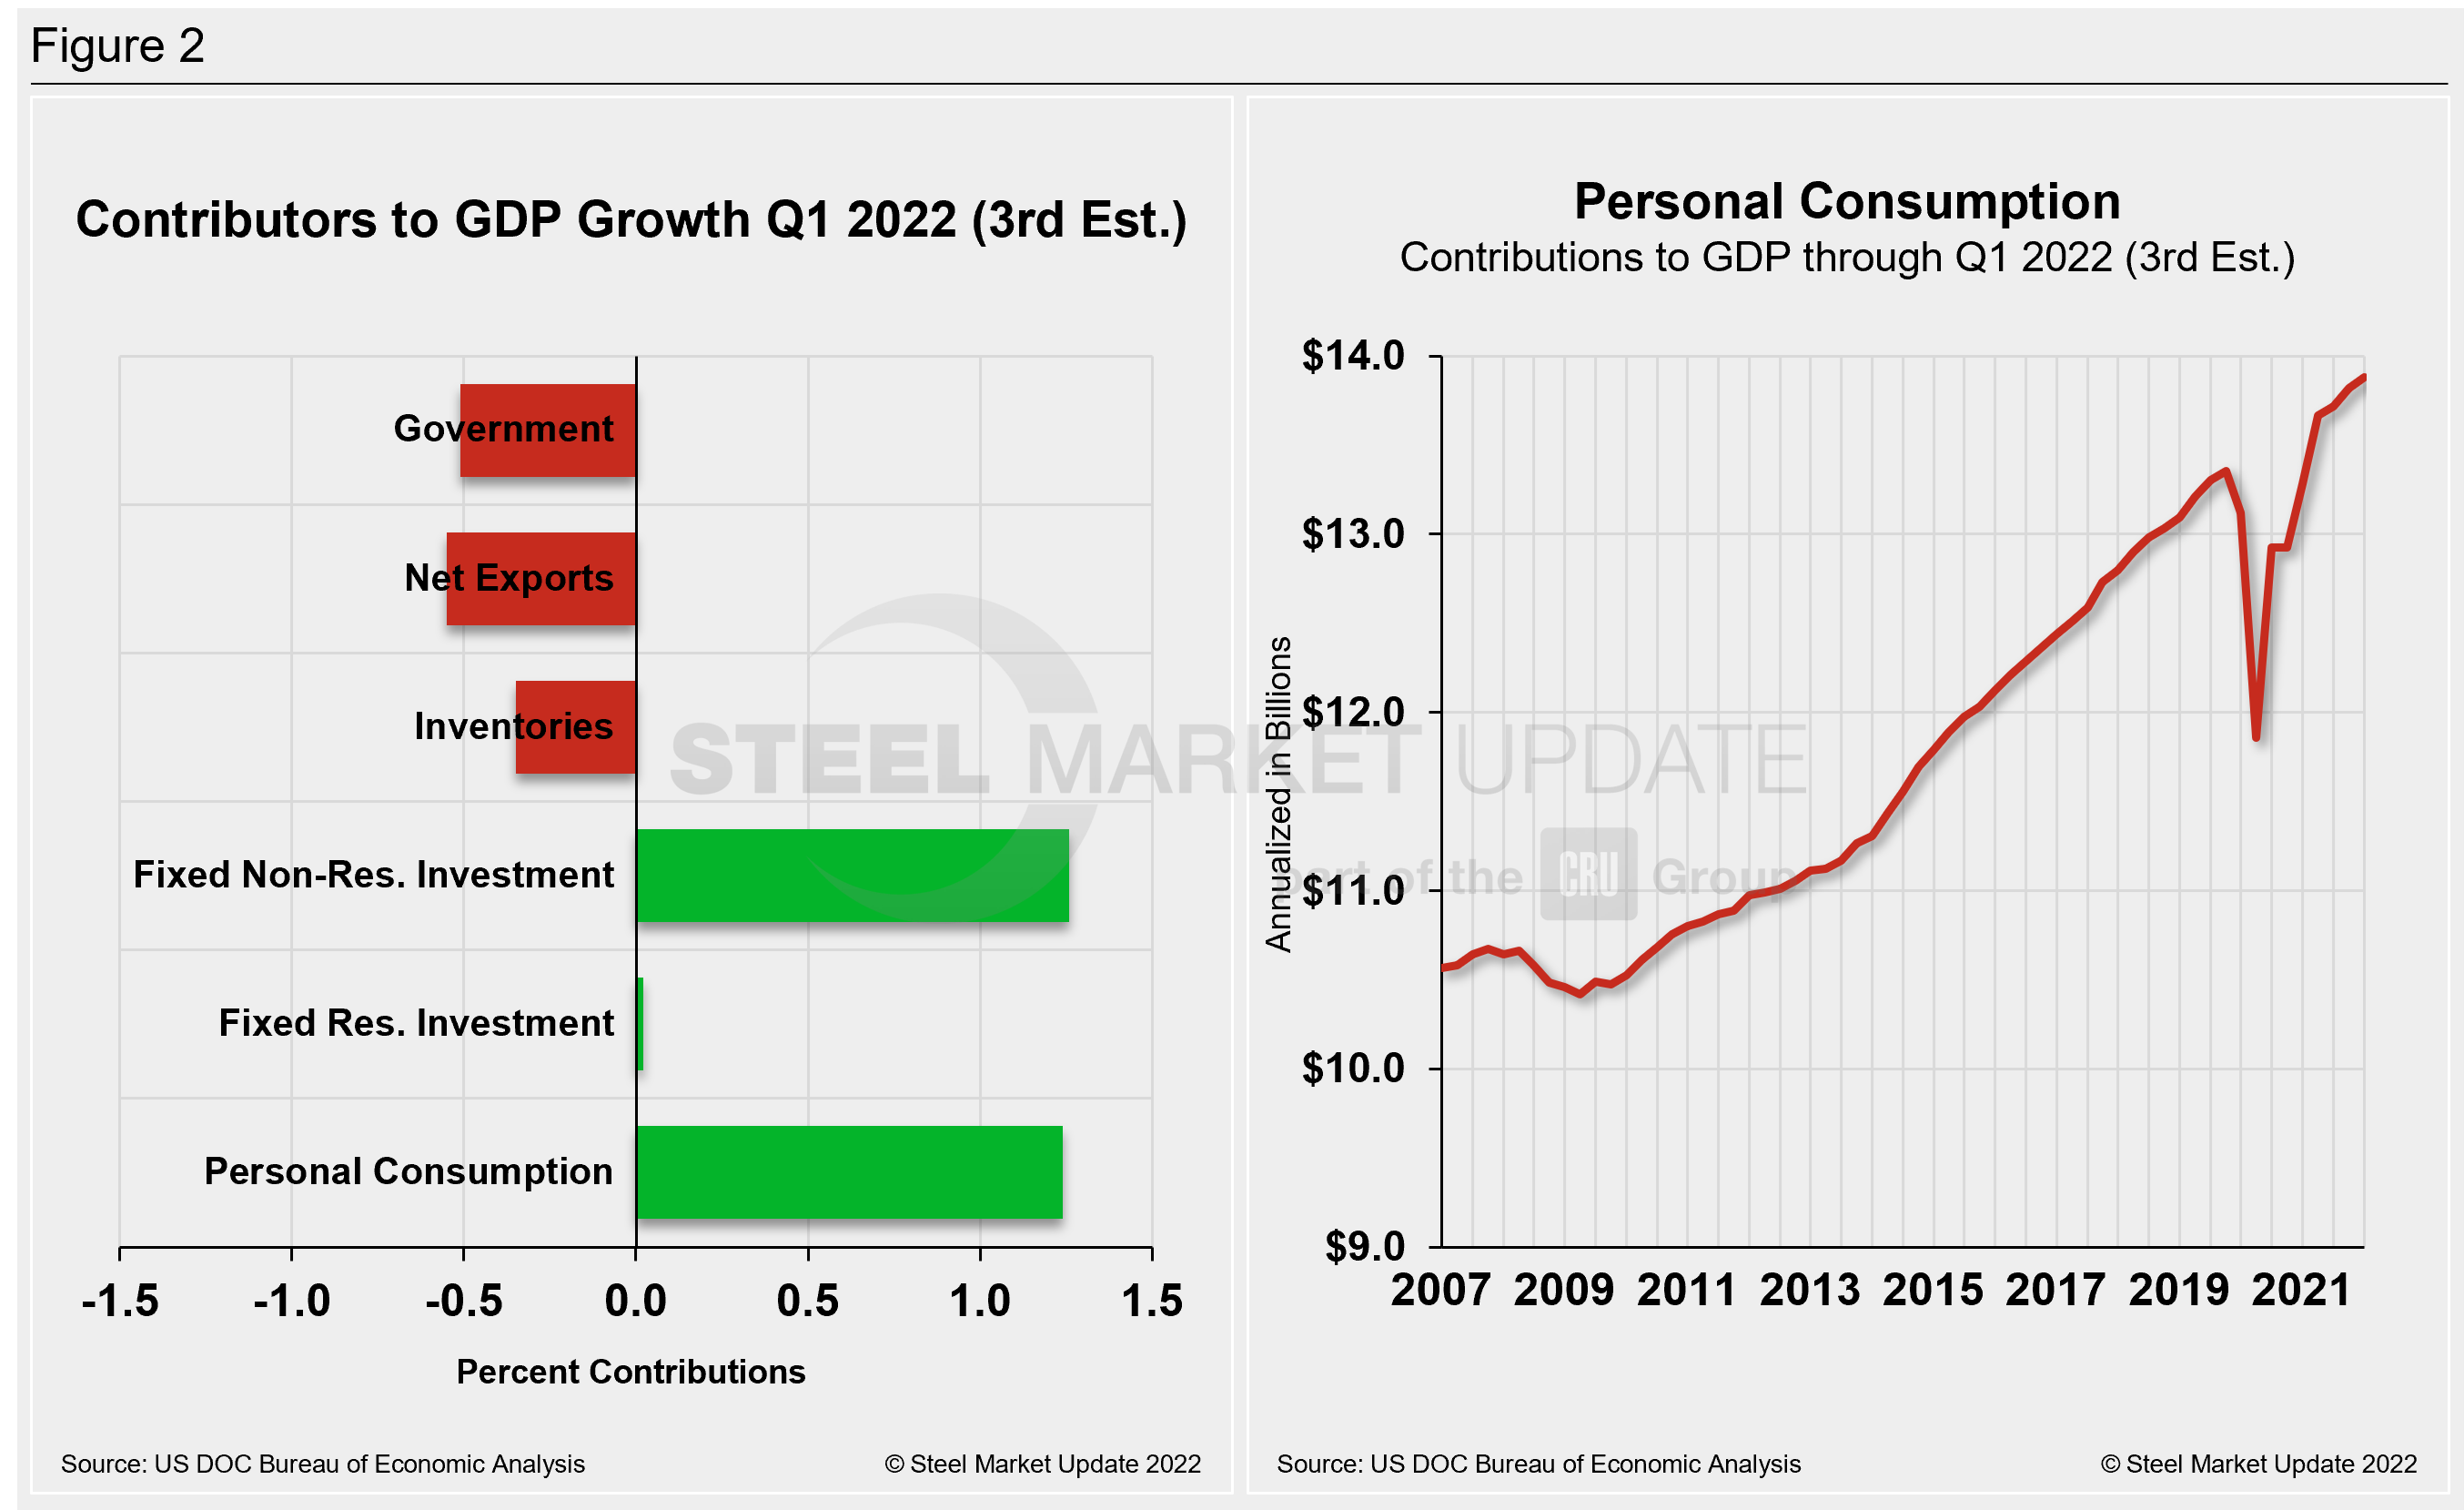
Shown below in Figure 2 is a side-by-side comparison of two charts. On the left is the mix of the six major components in the GDP growth calculation. The chart on the right puts a spotlight on personal consumption, a measure of consumer confidence and spending engagement.
The most notable change and a major source of GDP fluctuation is personal consumption, which has experienced extreme swings since the onset of Covid. It has been resilient more recently but is no longer a bright spot after slipping from 2.09 to 1.24 in the latest review.
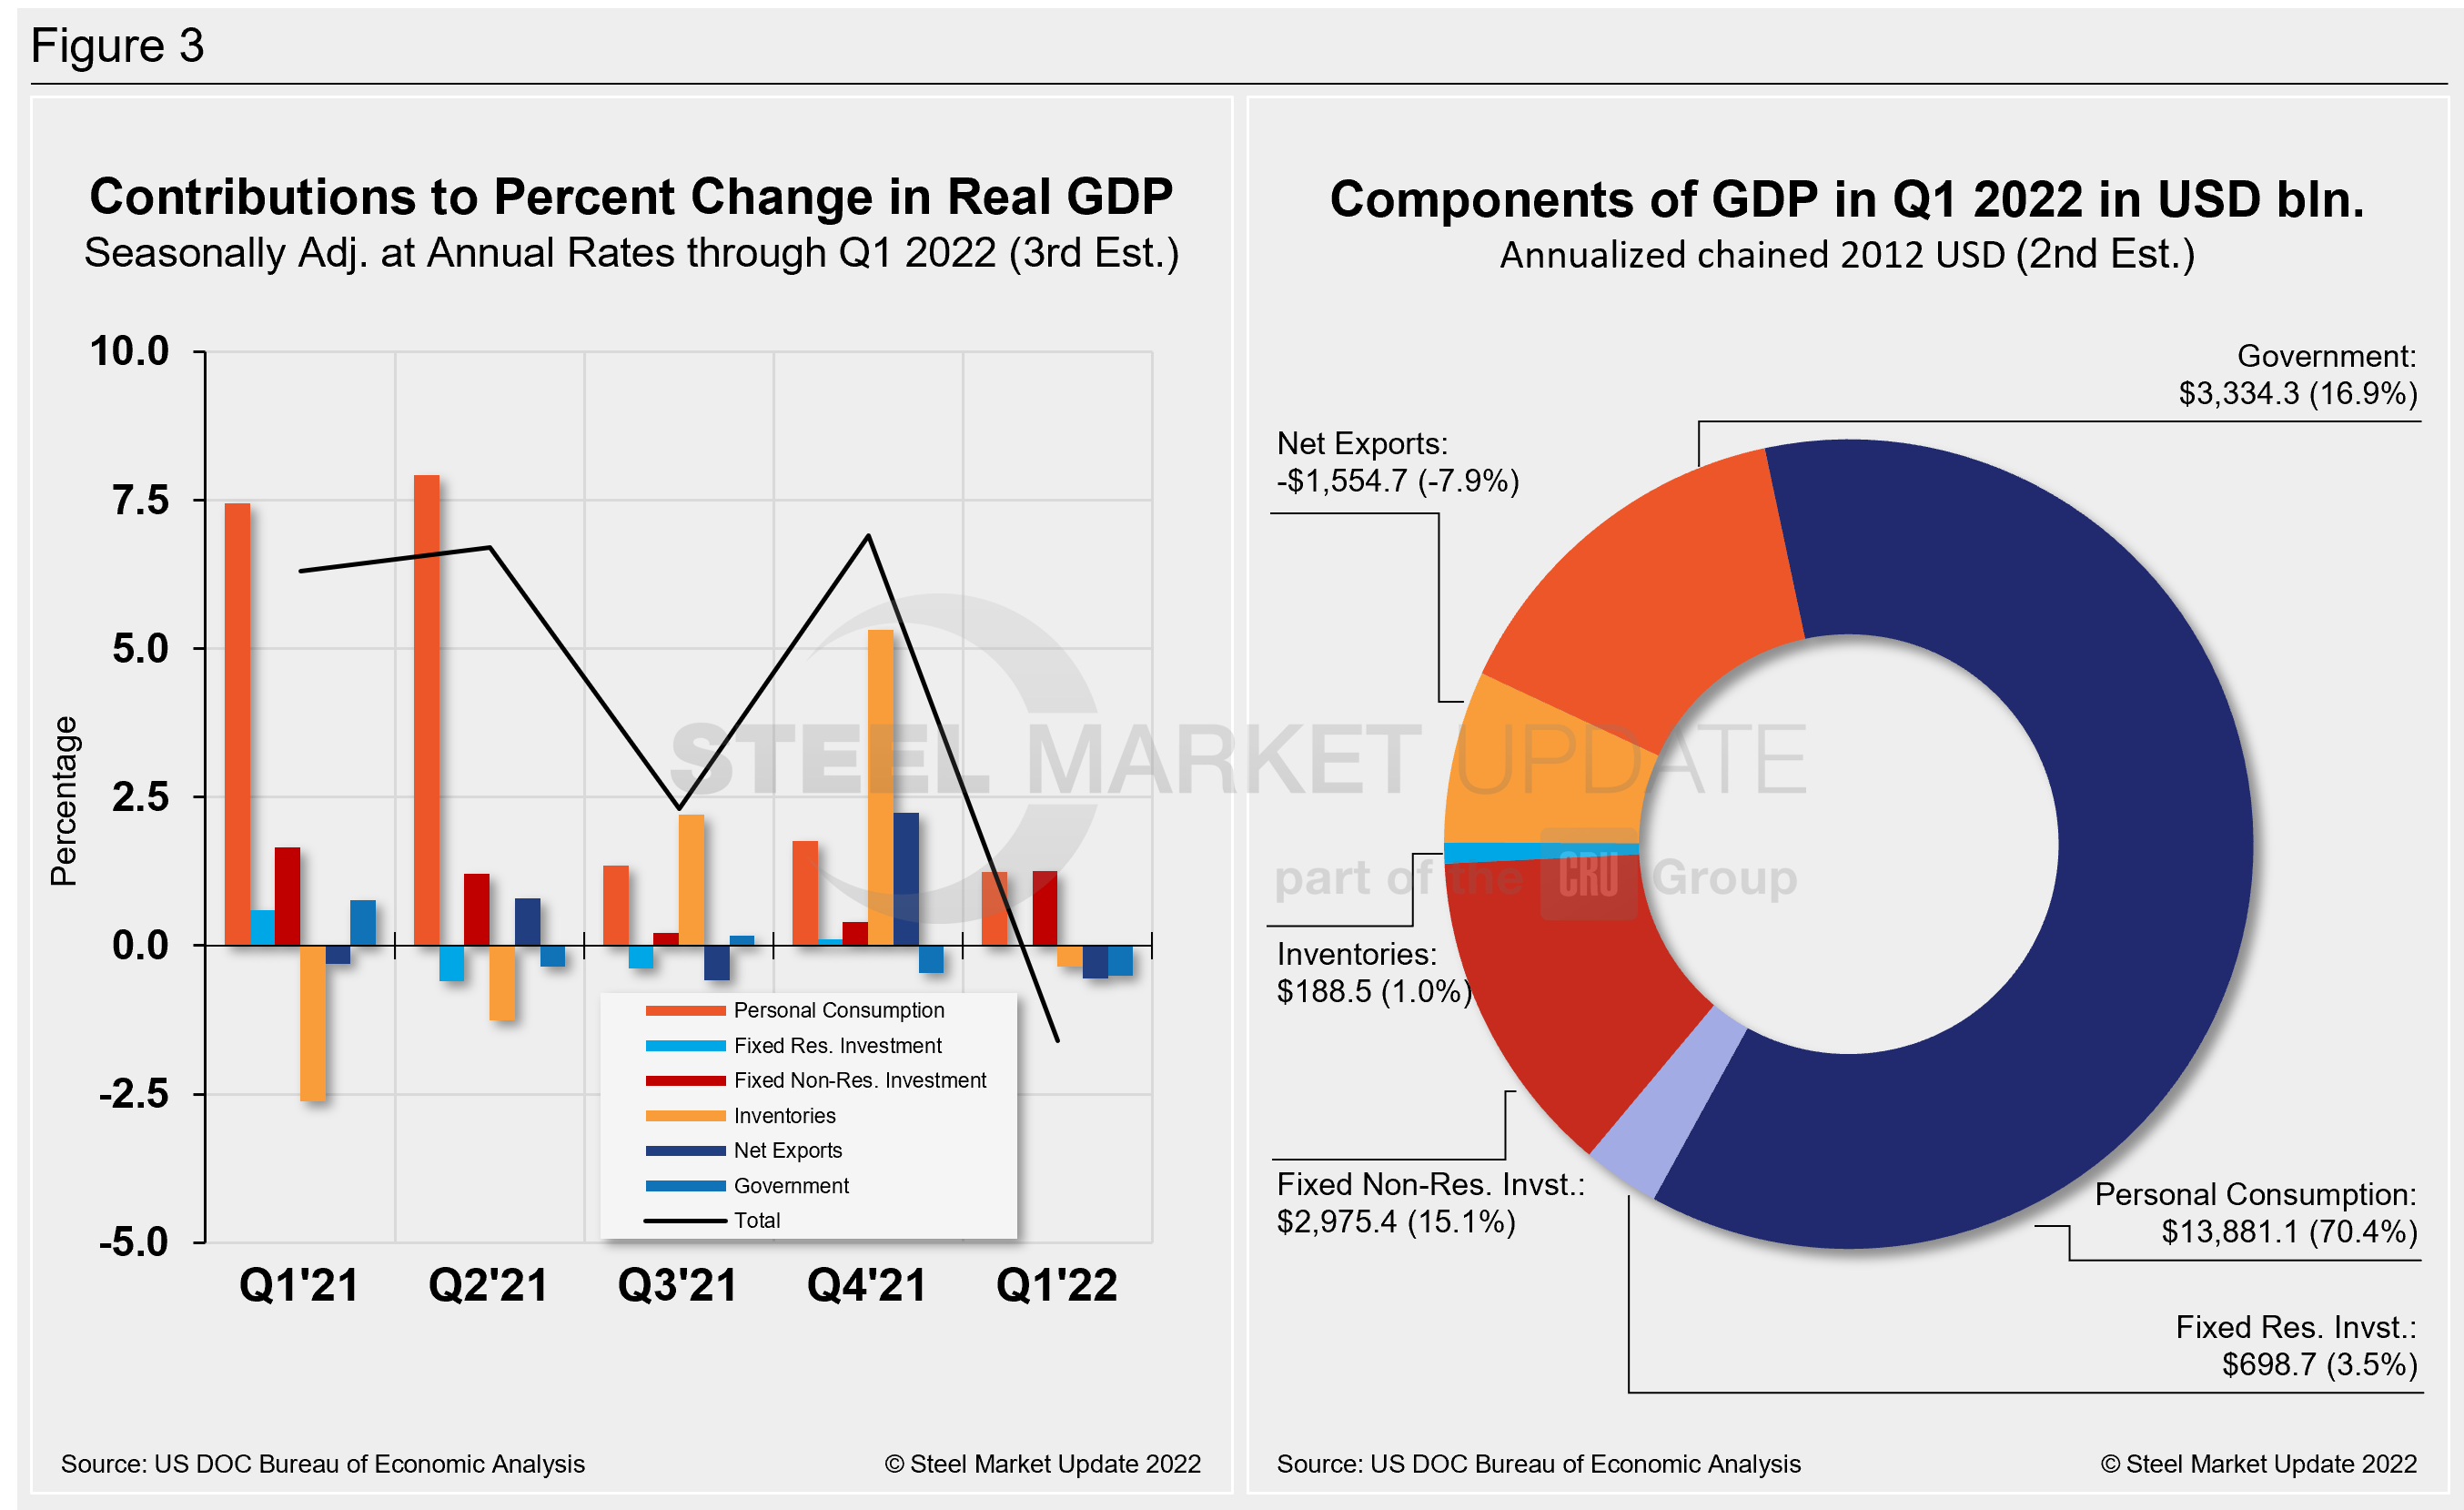
The quarterly contributions of the six major subcomponents of GDP since Q4 2020 and the breakdown of the $24.39 trillion economy in BEA’s third and final review of Q1 GDP are both shown in Figure 3. The chart on the left is for cross-comparison with Figure 1 above. The chart on the right shows the size of the other components relative to personal consumption.
By David Schollaert, David@SteelMarketUpdate.com


