Market Data

November 15, 2019
Service Center Inventories and Shipments Report for October
Written by Estelle Tran
Steel Market Update’s analysis of flat rolled and plate inventories and shipments for the month of October:
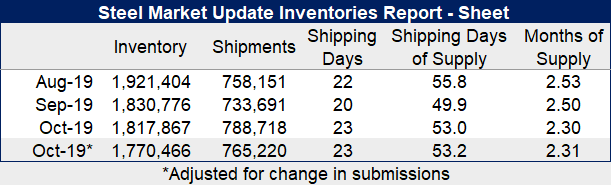
Flat Rolled = 53 Shipping Days of Supply
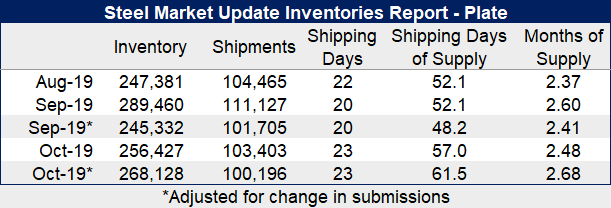
Plate = 57 Shipping Days of Supply
Flat Rolled
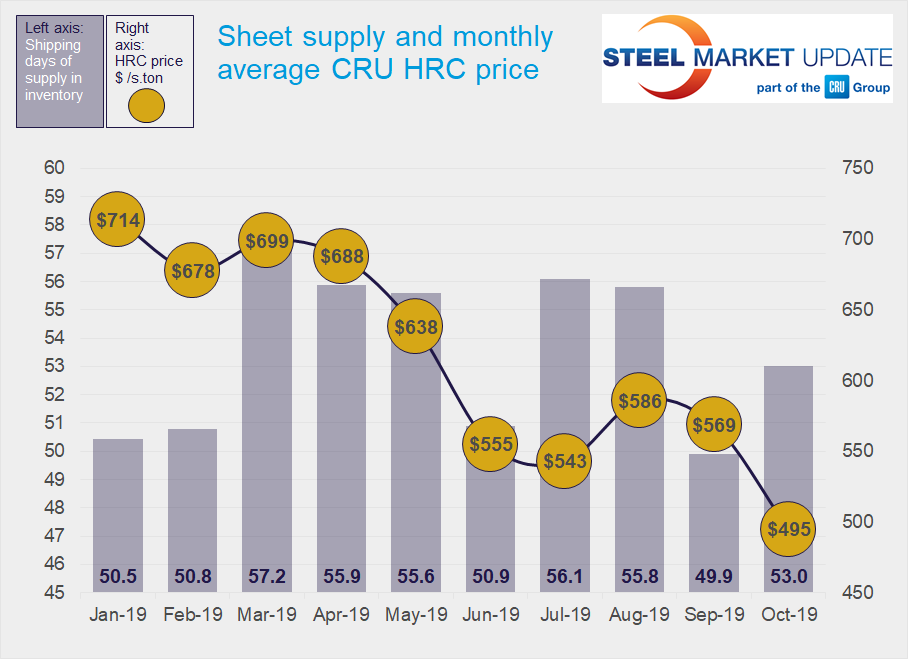
Sheet steel prices declined rapidly throughout October, and the SMU Service Center Inventories Report shows that service centers pared down inventories in October and started to restock as prices neared the bottom.
The adjusted data for October normalizes for the drop off of two data providers but also the reintroduction of two larger data providers that did not submit in September. The comparisons of the adjusted October inventory over September are more representative: Service center flat rolled inventories dropped 3.3 percent in October (versus falling 0.7% unadjusted). Shipments also increased 7.5 percent on an adjusted basis (up 4.3 percent unadjusted).
The slight variation in the data received each month is why we emphasize the more stable shipping days of supply calculation, which was 53 days unadjusted and 53.2 adjusted. The shipping days of supply increased from 49.9 in September.
Months of supply dropped to 2.3 months in October from 2.5 months in September.
October had 23 shipping days, which explains the 4.3 percent increase in shipments month on month on an adjusted basis. However, the daily shipping rate actually is 9.3 percent lower.
Going forward, we expect this figure to increase, as many buyers placed large volume spot orders in early November, solidifying the bottom of the market and helping mills fill out their order books through December. The next round of contract purchases based on November index pricing will be at the lowest levels of the year, which will further encourage service centers to restock. The second round of price increases recently announced as well as higher scrap prices expected for November and December will support flat rolled prices.
Plate
Service centers continue to test the limits of how low inventories can go, however, persistent negativity in the plate market set the stage for lower inventories and shipments in the 23-shipping day month of October.
The plate figures were adjusted slightly for October. Based on adjusted data, inventories decreased 5.7 percent month on month, while shipments fell 6 percent.
With the reduction in shipments, shipping days of supply increased to 57 from 52.1.
The $40/st plate price increases and rising scrap prices should help to establish a pricing floor, despite the persistent negativity that has carried into November. We expect the relatively low inventories and rising sheet prices to help to support the plate market, despite the lackluster demand prospects.