Product

January 9, 2020
Steel Mill Lead Times Back to 2018 Levels
Written by John Packard
I was taking a deeper dive into some of the data compiled from last week’s flat rolled and plate steel market trends analysis. Having added about 50+ new companies to our survey, we now send invitations to 500+ individuals who actively participate in the flat rolled or plate steel markets. On purpose, we concentrate on buyers associated with the manufacturing and service center segments, and then augment their data with responses from steel mills, trading companies, toll processors and suppliers to the industry. The results are then compiled in a PowerPoint format for our Premium level subscribers. We also provide the data in a historical context.
Looking at the core data to better understand the trends associated with the graphics we provide our readers, here are some interesting observations:
Hot rolled lead times averaged 4.85 weeks, according to our survey respondents. HRC lead times were unchanged from our mid-December 2019 analysis. However, the HRC lead time is the most extended we have seen it since mid-July 2018 when HRC lead times averaged just over 5 weeks (5.18 weeks). HRC lead times are running almost one and a half weeks longer than what we were collecting from our survey respondents in June of last year. This leads me to believe there may be some “legs” to higher HRC prices in the coming weeks.
Cold rolled lead time data is not quite as dramatic as hot rolled. At 6.52 weeks it is the same as what we collected in mid-December, and it is about one week longer than where we were seeing lead times just prior to the price increases that began in October 2019. CRC lead times from February 2018 until mid-July 2018 were averaging more than 7 weeks, peaking at 8.19 weeks in early May 2018.
Galvanized lead times are averaging just over 7 weeks based on last week’s respondents (7.26 weeks). The last time galvanized lead times exceeded 7 weeks was during the summer of 2018.
Galvalume lead times reached 7 weeks for the first time since October 2018.
At 5.13 weeks, plate lead times are not as dynamic as they were one year ago when they were reported by SMU as averaging 7.14 weeks.
Executive and Premium level members have access to the data I just mentioned. The data can be found under the “Resources” tab on our website. There you can find Lead Times data, Mill Spot Negotiations data, Steel Buyers Sentiment Index data and much more. Premium level members have access to the full survey results and historical surveys under the resources tab, as well. If you have not spent time on our website, I highly recommend you poke around. Items with a (P) after them mean they are restricted to Premium level users only.
There is quite a bit of information in our PowerPoint presentations that we rarely write about. I was looking at the results on our website this morning and thought the following graphic was quite telling:
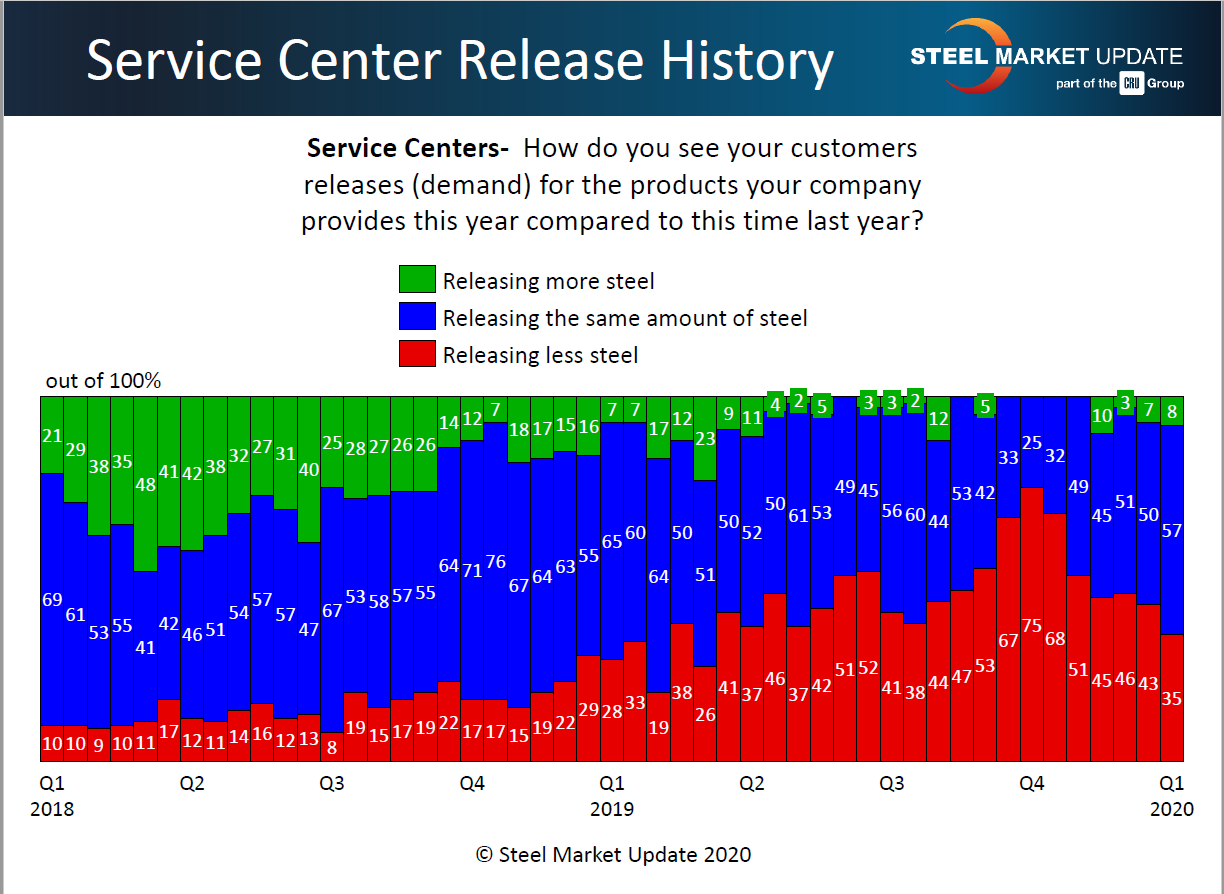
Knowing what we do now about the year 2019, it is quite evident there were issues with the release of inventories out of the steel service centers over the course of the year. The worse time was in late third and early fourth quarters. As we look at the data now it does appear to be improving. I am watching the green bars on this graphic as it will give us more insights as to when demand will be even more robust (like what we were collecting in the first, second and third quarters of 2018.
The graphic above came from our service center respondents. Manufacturing companies, which compromised 48 percent of the total respondents during last week’s survey, are more optimistic about demand with 31 percent reporting they expect demand to increase substantially (2 percent) or increase marginally (29 percent). These numbers are well above the 3-10 percent averages we collected during fourth-quarter 2019. (This information can be found in the “latest survey results” PowerPoint presentation on the website under the analysis tab).
As always, your business is truly appreciated by all of us here at Steel Market Update.
John Packard, President & CEO