

Product

February 20, 2020
Hot Rolled Futures: Ferrous Futures Rebounding
Written by David Feldstein
The following article discussing the global ferrous derivatives markets was written by David Feldstein. As an independent steel market analyst, advisor and trader, we believe he provides insightful commentary and trading ideas to our readers. Note that Steel Market Update does not take any positions on HRC or scrap trading, and any recommendations or comments made by David Feldstein are his opinions and not those of SMU or the CRU Group. We recommend that anyone interested in trading steel futures enlist the help of a licensed broker or bank.
These four drivers have been the foundation of my analysis that the domestic flat rolled steel market is now in a bull market:
• Chinese led commodity rally
• Undersupplied domestic steel market
• Stronger than expected U.S. domestic construction
• Cyclical turnaround in manufacturing and steel sentiment
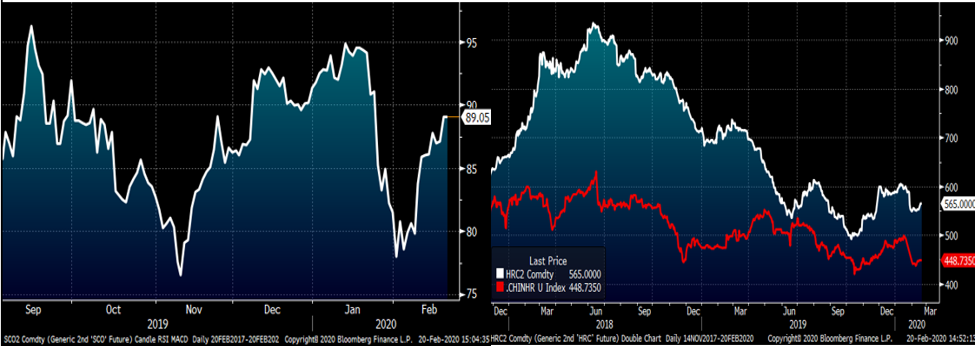
The chart on the left shows SGX iron ore futures rebounding since China returned from the CNY, while the left compares the second month HRC future with the second month Chinese HRC future showing the spread between the two has been relatively narrow and steady. The coronavirus has brought a tremendous amount of uncertainty, but so far, the rebound in iron ore is somewhat comforting. The case for a Chinese commodity rally was based on inflationary pressures as a consequence of China’s multiple and consecutive stimulus measures. The initial measure that grabbed the most attention occurred the week of Thanksgiving when the government pulled forward one trillion yuan of spending from 2020 into Q4 2019. This was as much a signal as it was stimulus and the government has continued to provide additional dovish measures. Now you can add the latest stimulus provided in response to the coronavirus outbreak. China’s January Consumer Price Index jumped 5.4 percent year over year, beating estimates of a 4.9 percent increase, while China’s January aggregate financing and new yuan loans metrics both beat expectations handily and were the highest January figure of the past five Januarys.
Rolling 2nd Month Iron Ore Future (left) & Midwest & Chinese HRC Future $/st (rt)
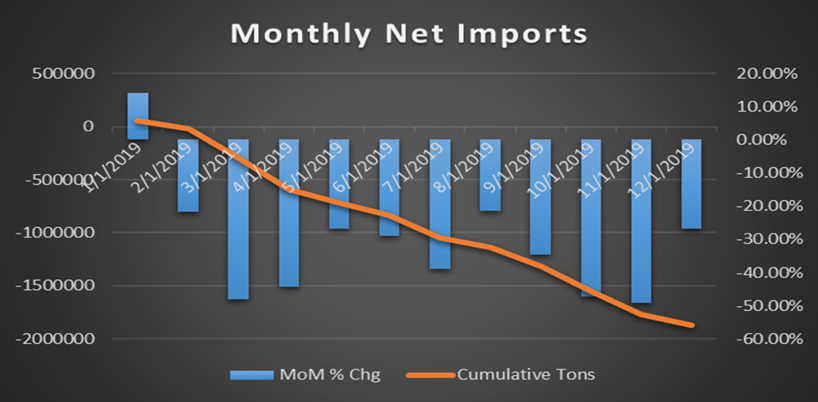
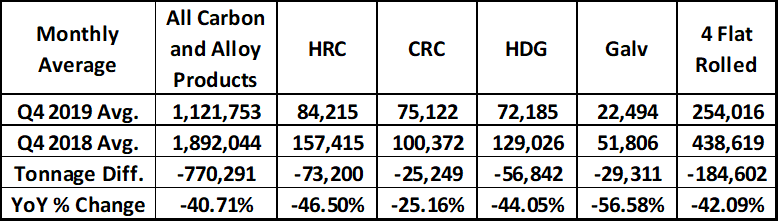
The following charts and tables show U.S. net imports (imports – exports) of the four major flat rolled products (HR, CR, HDG & Galvalume) with the chart on the left showing the year over year percent change in blue and the 2019 cumulative decrease vs. 2018, which totaled almost 2m short tons. The table on the right compares the monthly average for Q4 2018 and Q4 2019.
HRC + CRC + HDG + Galvalume Net Imports
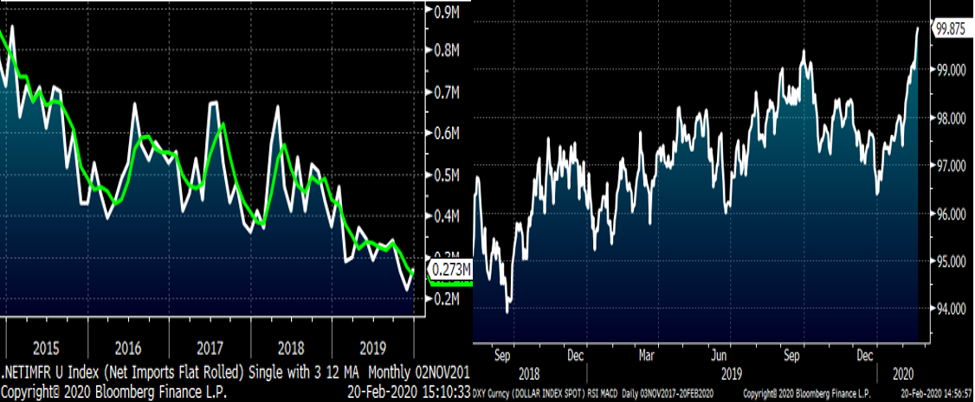
The chart on the left shows the net imports for the four flat rolled products; the green line is the three-month moving average. The chart on the right of the U.S. Dollar Index is one that might throw somewhat of a wrench in this line of thought as it has exploded in response to the coronavirus. Combine this net import data with the strong January service center data showing historically low inventory and months-on-hand statistics and the domestic undersupply driver is in full force. As I said above, there is a tremendous amount of uncertainty regarding China’s economy, especially its steel industry. What if their economy remains deadlocked with their logistics and transportation unable to move steel? Could that cause a short-term global supply shock that could open-up demand for U.S. exports? Hard to know, but it’s one example of how the undersupplied U.S. market is extremely vulnerable to a supply shock due to upside demand surprises, an unplanned outage or some other unknown.
Flat Rolled Net Imports (left) & U.S. Dollar Index (rt)
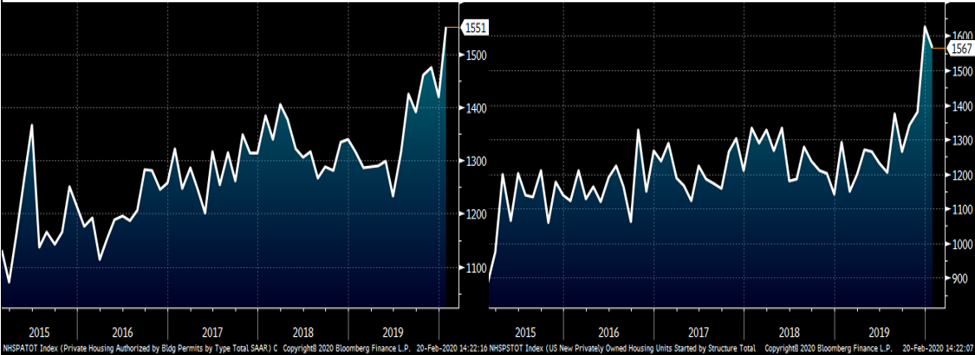
Speaking of an upside surprise, the cavalry is coming, they’re wearing a hard hat and riding a bull! It was another fantastic week of upside surprise with U.S. building permits and housing starts producing tremendous numbers. Look at those charts!!
U.S. Residential Building Permits SAAR (left) & Housing Starts SAAR (rt)
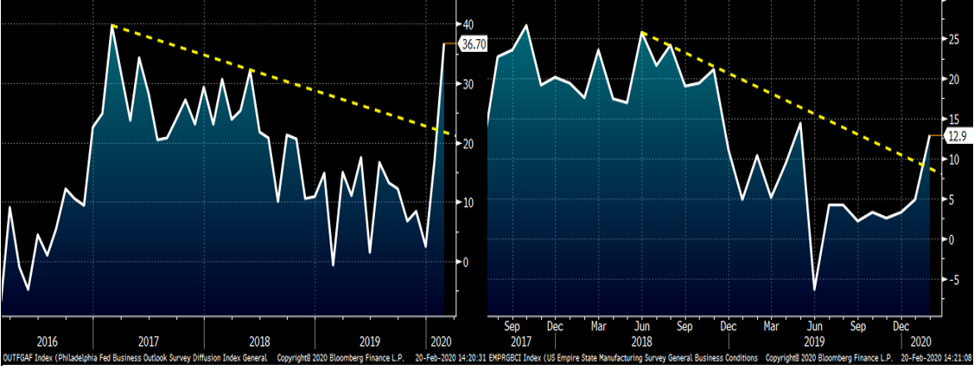
Meanwhile, we started off the month with a much better than expected ISM Manufacturing Index at 50.9, and this week brought us an explosive beat from both the Philly Fed and Empire Manufacturing Index. Do you notice a trend? Sentiment is improving quickly.
Philadelphia Fed Business Outlook (left) & Empire Manufacturing Index (rt)
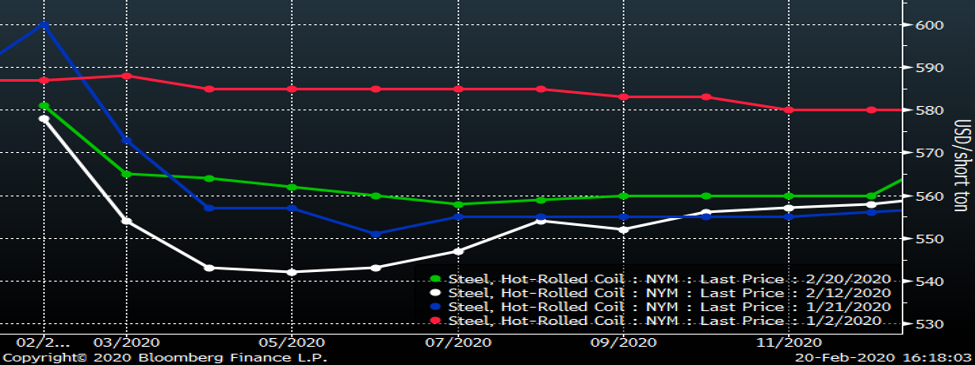
The CME Midwest HRC futures curve started the year flattish around $580-585 and then came under attack in mid-January with relentless selling that shifted the curve into steep backwardation with Q2 bottoming in the low $540s on Feb. 12. The market has rebounded since then with March trading as high as $573 yesterday and Q2 trading back above the $560 level.
CME Midwest HRC Futures Curve
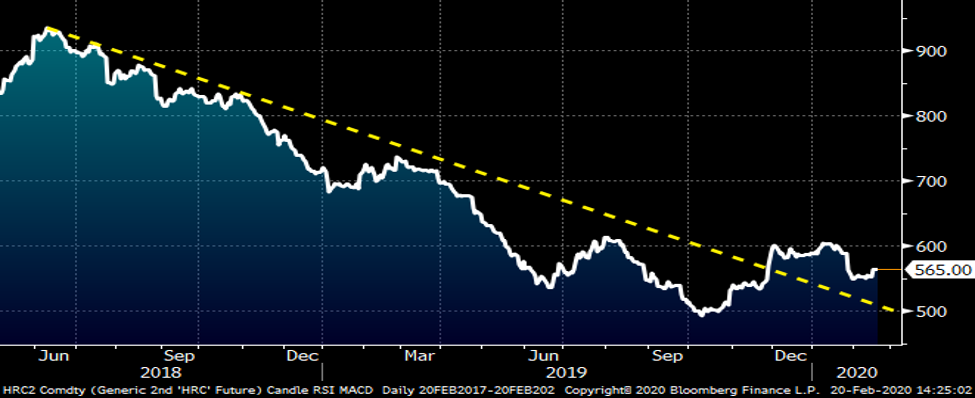
This chart shows the rolling 2nd month CME Midwest HRC. After breaking above the long downtrend from the bear market that started when prices peaked in July 2018, HRC2 rallied back above $600 before rolling into March, which traded as low as $537 on Feb. 3. The chart looks to be building into a reverse head and shoulders pattern with a neckline at $600. Today, the boys at Crunch Risk brokered Q3 $600 calls at $20/st for 500 st/month. The seller pocketed $30k in exchange for giving the buyer the right, but not the obligation, to buy Q3 HRC futures at $600/st. FYI, CME HRC and busheling futures are cash settled, that is there is no physical delivery.
CME Rolling 2nd Month Midwest HRC Future
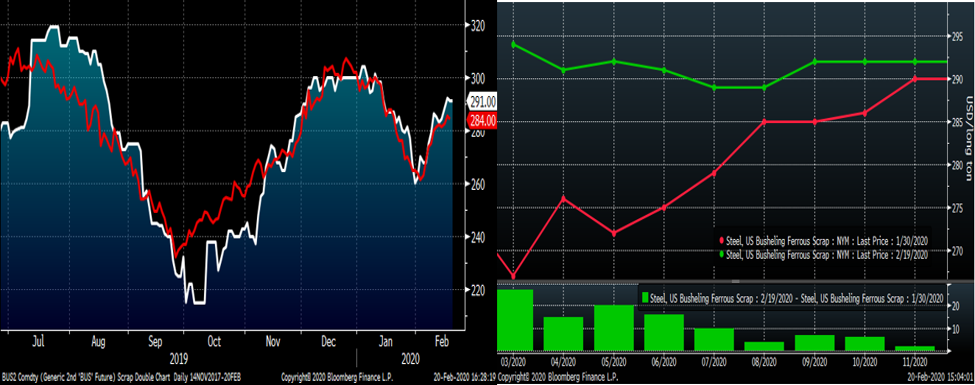
The chart on the left shows the rolling 2nd month CME busheling (white) and LME Turkish Scrap futures (red). After bottoming at $215 in October, busheling shot back up to $300 before retreating to $260 along with the rest of the commodity complex, but has rebounded nicely recapturing almost all of what it lost. The right-hand chart shows the busheling futures curve’s returning to a flattish curve after the sell-off shifted it into a steep contango.
CME Rolling 2 Month Busheling & LME Turkish Scrap (left) & CME Busheling Curve (rt)
Midwest flat rolled looks to be in a bull market. If that is the case, it doesn’t necessarily mean it’s going straight up, but it does mean there will be support underneath the market and buying dips will be a winning strategy. Keep an open mind and watch for developments that could send it much, much higher from here. We’re not in 2019 anymore.


