

Product
August 13, 2020
Hot Rolled Futures: Selling HRC Futures Continues to be the Winning Strategy
Written by David Feldstein
Editor’s note: SMU Contributor David Feldstein is president of Rock Trading Advisors. David has over 20 years of financial market trading experience and has been active in the ferrous futures space for eight years. David earned an MBA from the University of Chicago Booth School of Business with concentrations in economics, statistics and analytical finance.
The chart below is the CME Midwest HRC futures curve in a steep upward sloping contango. A futures curve is in contango when futures prices are higher than spot prices. CME Midwest HRC futures are financially settled against the CRU Midwest HRC Index. There is no physical settlement or physical steel involved. To read this chart, find the future’s month on the X-axis and the corresponding price on the Y-axis on the right. While this chart only goes out through March 2021, futures are available for every month out for three years from the current month.
CME Midwest HRC Futures Curve $/st
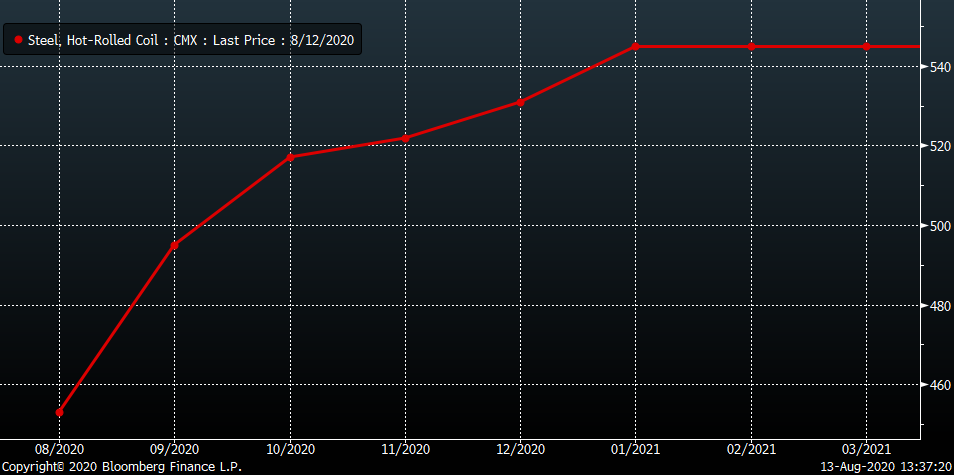
Below is the theoretical formula to calculate the futures price at any point along the curve. As long as the cost of capital is positive, the curve should be upward sloping. If the spot price of physical hot rolled is $440/st, then you would add the cost of capital in holding that steel plus storage costs to get the price in September, October, November, etc.
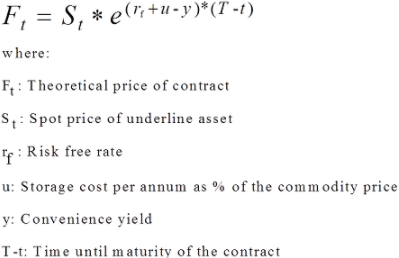
The October futures are trading at $515, which is $75 above the current spot price. The cost of capital plus the cost of storage is not $75 for two months, so what gives? In the formula above, there is also this concept called the “convenience yield,” which is defined as the implied return to holding physical inventory. The convenience yield is also this theoretical gray area used by academics to explain why the formula doesn’t make logical sense, like right now. So, is the return to holding inventory until October worth $75/st?
We are in what looks to be an oversupplied market as domestic production supply is being brought back online at a faster rate than returning demand. Additional data points providing the market is oversupplied are the relatively elevated months-on-hand at service centers and short lead-times at domestic mills. All of this as the industry heads into the seasonally slower year-end.
For those holding physical inventory, the futures market currently provides the opportunity to lock in an abnormal profit with little risk. Theoretically, these market participants should be purchasing physical steel and simultaneously selling these relatively high-priced futures until the curve moves lower toward a more “normal” rate of return. So why isn’t this happening?
One challenge in steel versus other commodities like oil, gold or sugar is that a hot rolled coil isn’t fungible. The pseudo-commodity comes with the complexity of the specificity of the steel; that certain coils can only be sold to specific buyers. If the metal can’t be moved, then the profitability of this “cash-and-carry” trade is quickly degraded, thus calling into question the “little” in abnormal profit with little risk. In other words, perhaps service centers don’t have enough clarity regarding what physical steel to buy against which they would sell the futures. In other words, maybe there is more risk involved in this strategy.
Another possibility could be that the cost of capital is too high. Not necessarily in terms of the interest expense, which we know rates are ultra-low, but there isn’t enough capital available to buy a slug of physical steel, put up the margin necessary to hedge the futures while also having enough availability to run the business and manage the maintenance margin of the futures position if futures prices rip higher. Another possibility is that those service centers capable of putting on this “carry trade” are too risk-averse after almost two years of extremely difficult market conditions. Whatever the reason or reasons behind this market anomaly, for those willing to execute this trade it looks all but certain to not only provide another month of gains in August, but perhaps its best month yet.
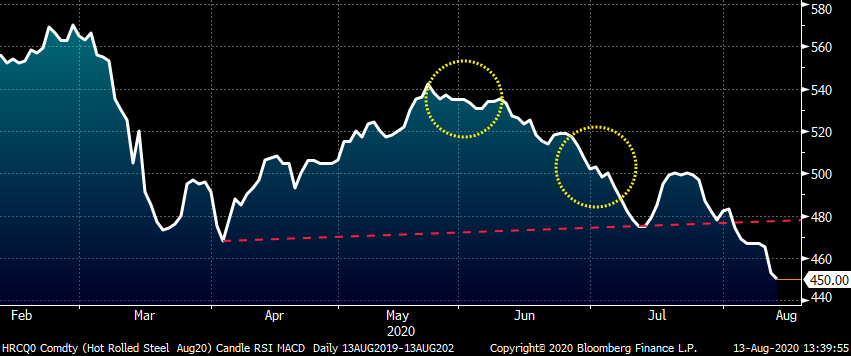
This chart is of the August CME Midwest HRC futures. Let’s get technical. The red dashed line is part of a technical pattern; if prices break below it, it indicates a sharp move lower. August traded below $480 on Aug. 4 and has dropped another $30 in just seven trading days to settle at $450 today.
CME Hot Rolled Coil Future $/st
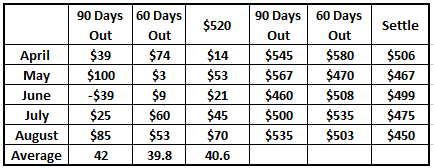
This table shows the performance of selling futures for each respective month at 90 days out, 60 days out and if you simply sold every month at $520, which was available for each month within 90 days prior to expiration. Regardless of the timing, you would have averaged a profit of at least $40/st per month! August is shaping up to be the best month so far.
This chart shows the HRC curve on the first trading day of May, July and August with a steep upward sloping contango. Only in June, when there was a tremendous amount of anticipatory optimism, was the curve flat, but at $535, that was also the best pricing of the four curves.
CME Midwest HRC Futures Curve $/st
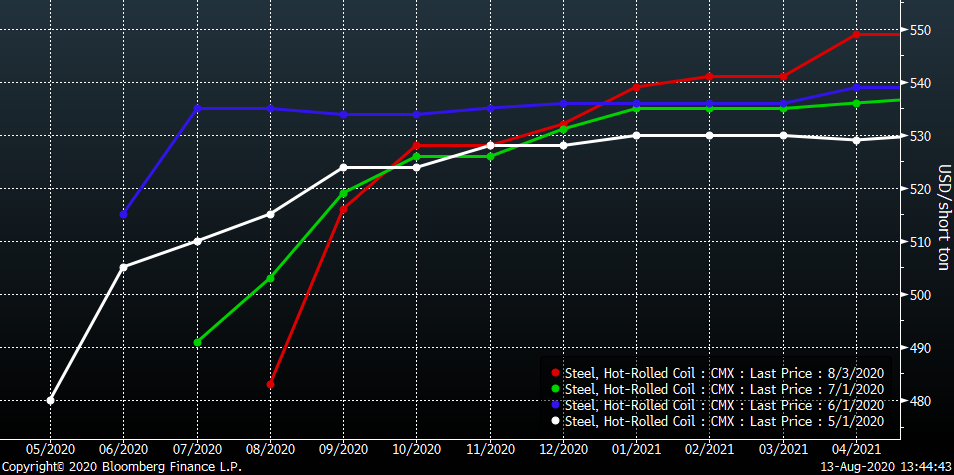
It is very curious why this market behaves this way. Perhaps it’s greed. Perhaps it’s fear or better yet F.O.M.O., fear of missing out. Perhaps it’s the historical perspective of previous bottoming cycles that have been followed by $100-$200 bursting rallies over a six- to eight-month period. I don’t know what the answer is, but I do know those service centers implementing a hedging strategy have cushioned the blow brought on by the unforeseen catastrophe of the 2020 COVID pandemic. Firms that have embraced hedging have truly evolved and enabled themselves to find success regardless of the market conditions. Why this isn’t more popular is another question I still am struggling to answer.
Turning our attention to CME Midwest busheling futures, we see this chart below that subtracts the rolling second month busheling future from the rolling second month Midwest HRC future to provide a crude measure of EAF profitability. Outside of 2018 when hot rolled briefly shot above $900 due to Section 232-induced volatility, this relatively stable spread has been rangebound between $240 and $350. The floor has become the ceiling since the outbreak resulted in a shortage-induced spike in the busheling price. August busheling settled at $258.31 this month and there are already expectations that busheling will be up in September.
Rolling 2nd Month CME Midwest HRC – Rolling 2nd Month CME Busheling Futures
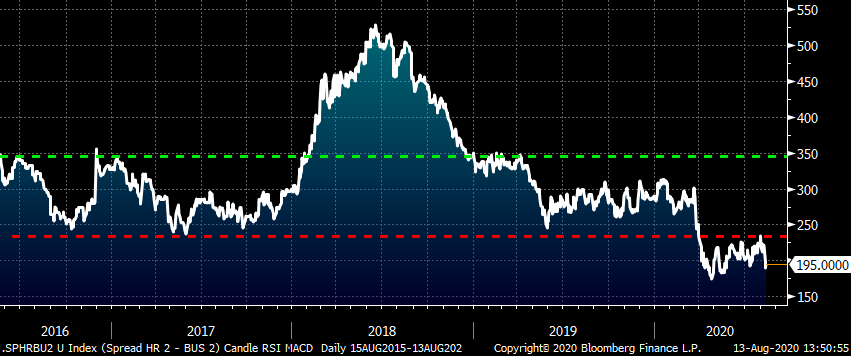
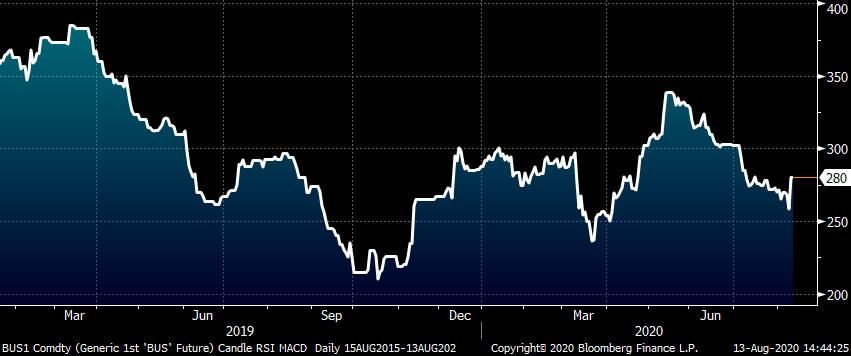
In Economics 101 they teach you the relationship between supply, demand and price. With the hot rolled price falling to $440, it can be expected that there was an influx of purchase orders for this relatively discounted steel. However, how many of those orders have been pulled forward from future demand? Where I am going with this is that it seems illogical for the mills to pay such a high price for busheling scrap when they are looking at an extremely competitive supply side likely holding down hot rolled prices for months to come. The continued resilience in the price of busheling is surprising.
Rolling Front Month CME Busheling Future $/gt
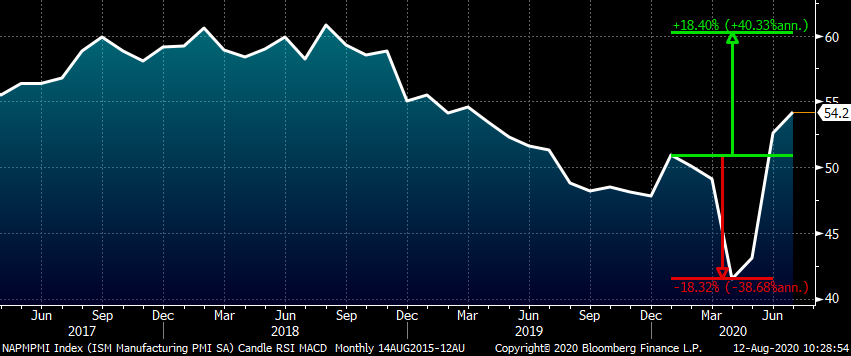
Another head scratcher has been trying to use the usual economic indicators to predict steel demand and price. The economic survey data indicates a much stronger economy than the actual hard economic data. For instance, the July ISM Manufacturing PMI along with all of the July regional manufacturing PMIs have a V-shaped pattern. However, I would argue things aren’t as rosy as these indicators make them appear. The drop in the ISM PMI from 50 to 41.5 was so fast and severe that it would have to rebound back to 60 to reach a full recovery. In other words, you have to recalibrate and adjust for the extreme circumstances.
ISM Manufacturing PMI
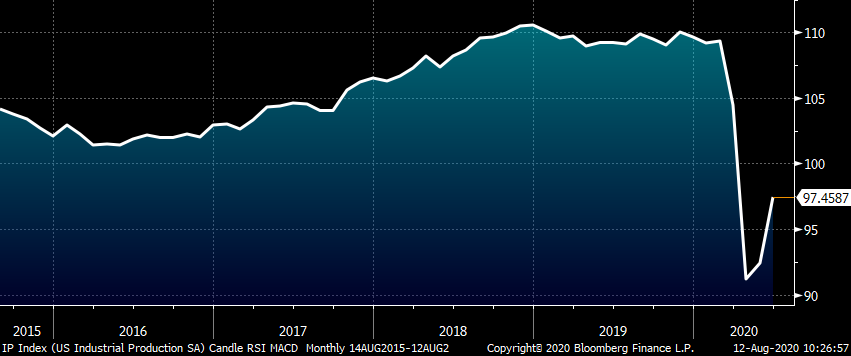
Here is the index of U.S. industrial production through June, which looks to be a better expression of the reality of the current economic state; a slowly recovering economy. Whether it is 2020 GDP at -6.5 percent, YTD auto sales down 22 percent, YTD steel production down 20 percent or YTD flat rolled shipments down 14.7 percent, there is not enough strength in the economy to rebound and bring it back to even by year end. It is clear it is going to be a long slog that will likely take until Q1 2022 before the economy returns to where it was in Q1 2020.
U.S. Industrial Production S.A. Index
Disclaimer: The content of this article is for informational purposes only. The views in this article do not represent financial services or advice. Any opinion expressed by Mr. Feldstein should not be treated as a specific inducement to make a particular investment or follow a particular strategy, but only as an expression of his opinion. Views and forecasts expressed are as of date indicated, are subject to change without notice, may not come to be and do not represent a recommendation or offer of any particular security, strategy or investment. Strategies mentioned may not be suitable for you. You must make an independent decision regarding investments or strategies mentioned in this article. It is recommended you consider your own particular circumstances and seek the advice from a financial professional before taking action in financial markets.


