

Prices

December 3, 2020
CME HR Futures $1,600/st Through Aug; May Ore Trades at $200/t
Written by David Feldstein
Editor’s note: SMU Contributor David Feldstein is president of Rock Trading Advisors. David has over 20 years of trading experience in financial markets and has been active in the ferrous futures space for over eight years. You can learn more at www.thefeldstein.com or add him on twitter @TheFeldstein and on Instragram at #thefeldstein.
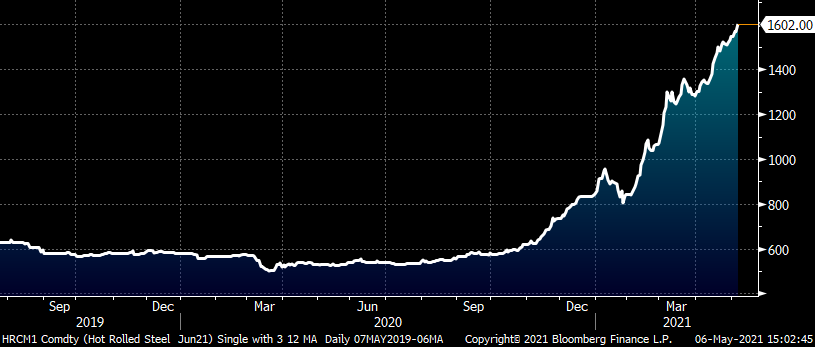
If you liked hot rolled at $1,430 three weeks ago, you’re gonna love it at $1,600 today.
June CME Midwest HRC Future
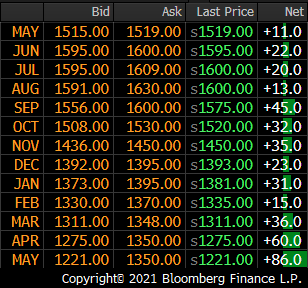
The financially delivered CME hot rolled coil futures through May 2022 are below. The change on the day is shown in the column “net.” You may be thinking, wow, that’s a big move, but that’s how it has moved almost every day in this market for weeks. This is how we…roll.
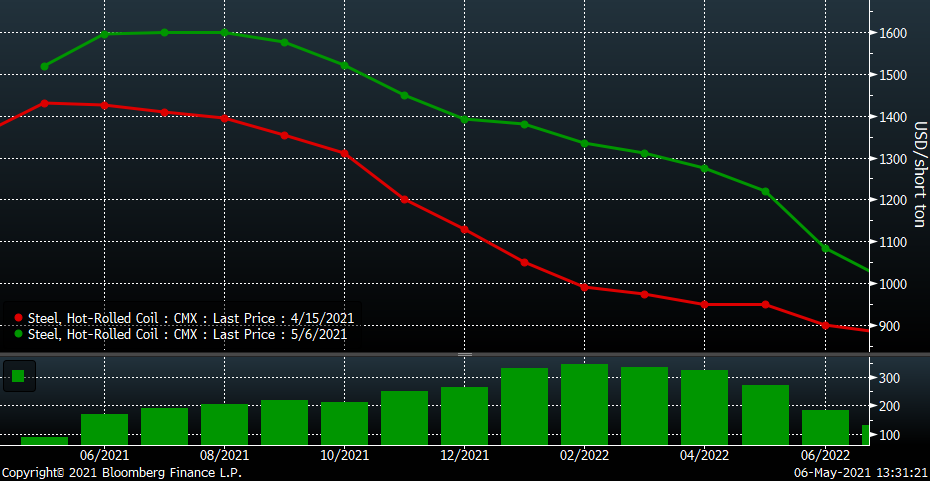
The CME has a hot rolled future for each month for the next 36 months. Every night, each month’s future has a settlement price and if you connect the dots, it creates the curve with months on the x-axis and price on the y-axis. This chart shows the curve as of my last SMU article on April 15 in red and as of this afternoon in green. In that April article, I suggested the flattening of the curve was due to aggressive buyers moving further out in time, further down the curve, seeking any value offered by the downward sloping curve. Over the past few weeks, buyers have continued down this path, first buying up the rest of the fourth quarter and then pushing out to Q1 last week and into Q2 this week. Over the past three weeks, Q1 2022 has gained over $300 per ton. June 2021 through December gained around $200 as well during this time, not to be overlooked.
CME Midwest HRC Futures Curve $/st
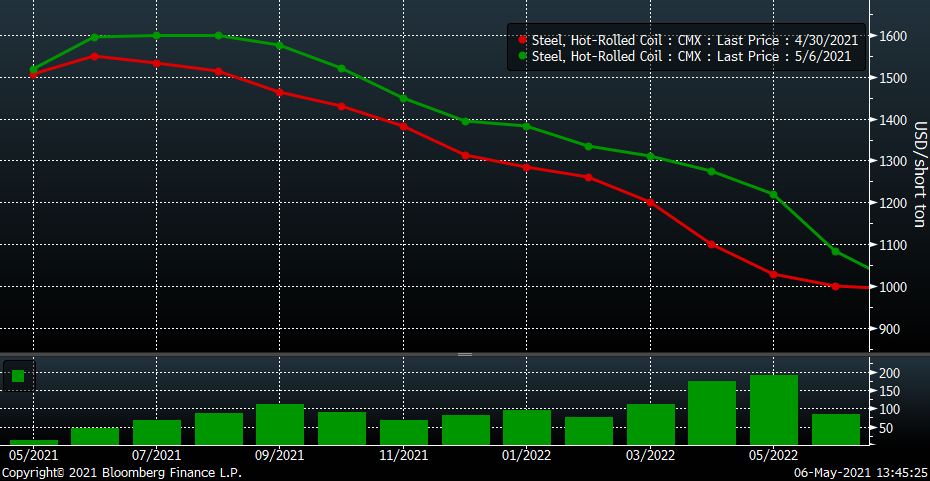
This next graph is the same as above except the start date (red) is last Friday’s closing prices. So far this week, the curve has moved up another $100/t with April and May 2022 closing in on a $200 gain. Since February, there has been little opportunity to buy on the bid let alone on any dips. Only the most aggressive of buyers have been getting their orders filled. It is a seller’s market, but a market in which sellers almost immediately regret selling shortly after receiving their trade execution confirmation.
CME Midwest HRC Futures Curve $/st
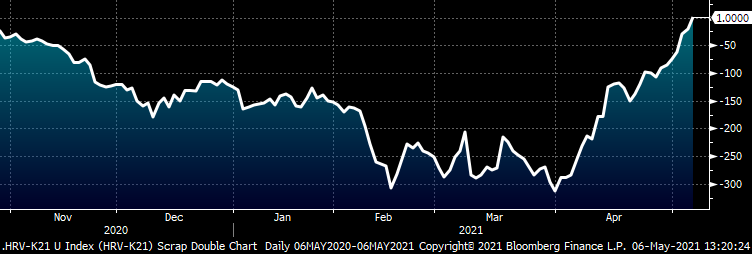
In my last article, I showed you this next chart of the spread between the May and October futures rebounding back to – $105 from a low of – $313. Now, the two months are even, both at $1,520/st.
CME Midwest HRC October ’21 Minus May ’21 Spread $/st
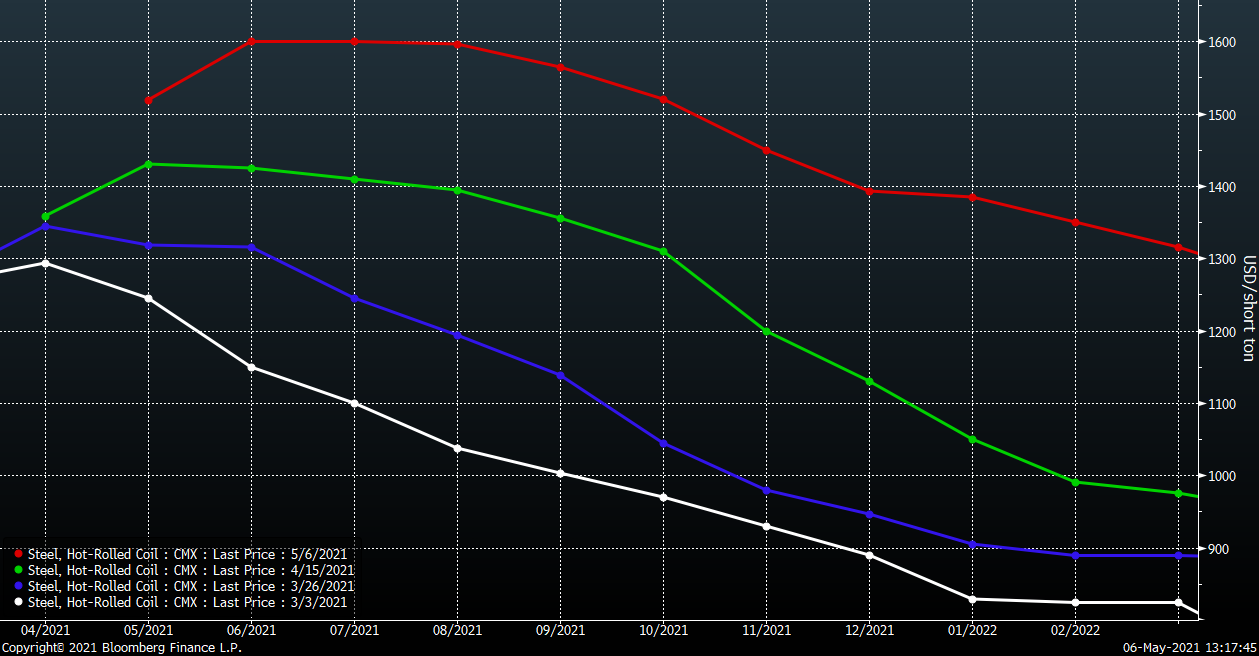
This chart shows the curve over four different days going back to March 3. At $1,600/st, August has gained $562 since then. Ironically, the March 2020 HR future’s settlement was $572. Newton’s third law states that for every action in nature, there is an equal and opposite reaction. Write that down.
CME Midwest HRC Futures Curve $/st
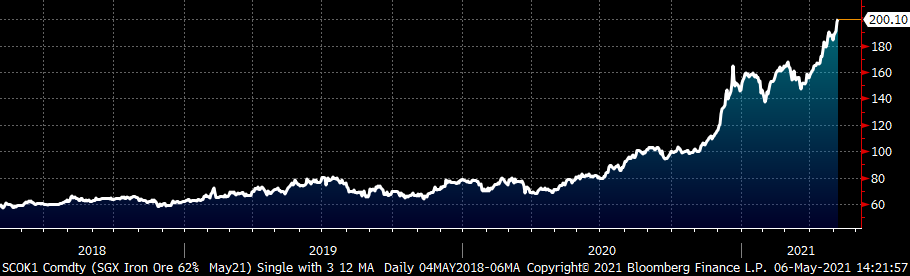
Today in Singapore, the SGX May iron ore future traded above $200/t.
SGX May Iron Ore Future $/mt
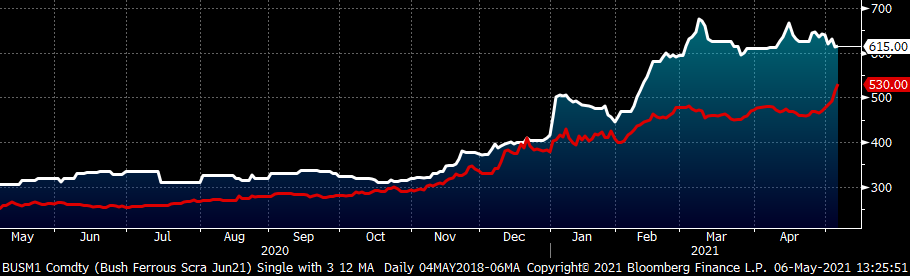
The June LME Turkish scrap future has been ripping higher along with iron ore closing today at $530/mt. However, CME busheling has been drifting lower with June down $25 so far this week at $620/gt.
CME Midwest Busheling Scrap Future $/gt (wh) & LME Turkish Scrap Future $/mt (red)
The front end of the CME busheling curve has moved lower this week due to expectations that May’s busheling scrap index will be flat MoM. Since April 15, the May busheling future has declined $40 and the June future $45. Since April 15, May CME HR has gained $89 while busheling has fallen $40. The June HR future has gained $177 while June busheling has fallen $45. When added together, that equals an additional profit for EAF mills of $130 for May and $217 for June. Seem illogical? Welcome to 2021.
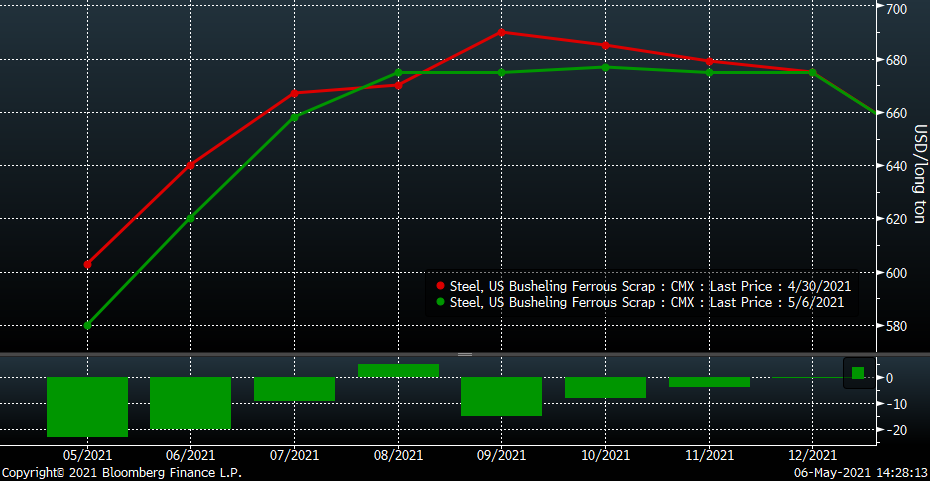
CME Midwest Busheling Scrap Futures Curve $/gt
Disclaimer: The content of this article is for informational purposes only. The views in this article do not represent financial services or advice. Any opinion expressed by Feldstein should not be treated as a specific inducement to make a particular investment or follow a particular strategy, but only as an expression of his opinion. Views and forecasts expressed are as of date indicated, are subject to change without notice, may not come to be and do not represent a recommendation or offer of any particular security, strategy or investment. Strategies mentioned may not be suitable for you. You must make an independent decision regarding investments or strategies mentioned in this article. It is recommended you consider your own particular circumstances and seek the advice from a financial professional before taking action in financial markets.


