

Prices

March 11, 2021
Commerce Data Shows Import Market Share Up in January
Written by David Schollaert
This report examines the import share of sheet, plate, long and tubular products. As of January, imports’ share of total sheet products was 12.8%, up marginally from 12.3% in December. Although minimal, imports of sheet products have posted increases for two consecutive months after declining for seven consecutive months following the most recent peak of 16.6% in May 2020. The import share of hot rolled coil (HRC) has been below 10% since January 2019 and dipped in January to 6.7% compared to 9.0% the month prior. Despite posting a lower total in January, import volumes of HRC are expected to rise substantially in the coming months as steel buyers seek relief from extended lead times and soaring domestic prices. Preliminary license data available through the U.S. Department of Commerce shows February HRC imports have jumped by more than 60.0% compared with January’s confirmed totals, and March imports are expected to be even higher.
To date, other metallic coated sheet remains the product with the most drastic shift in import market share over the past several years, retracting from its most recent peak of 51.3% in April 2015 to its lowest total of 14.8% this past October. January rose, however, to 19.4% from 15.6% the previous month.
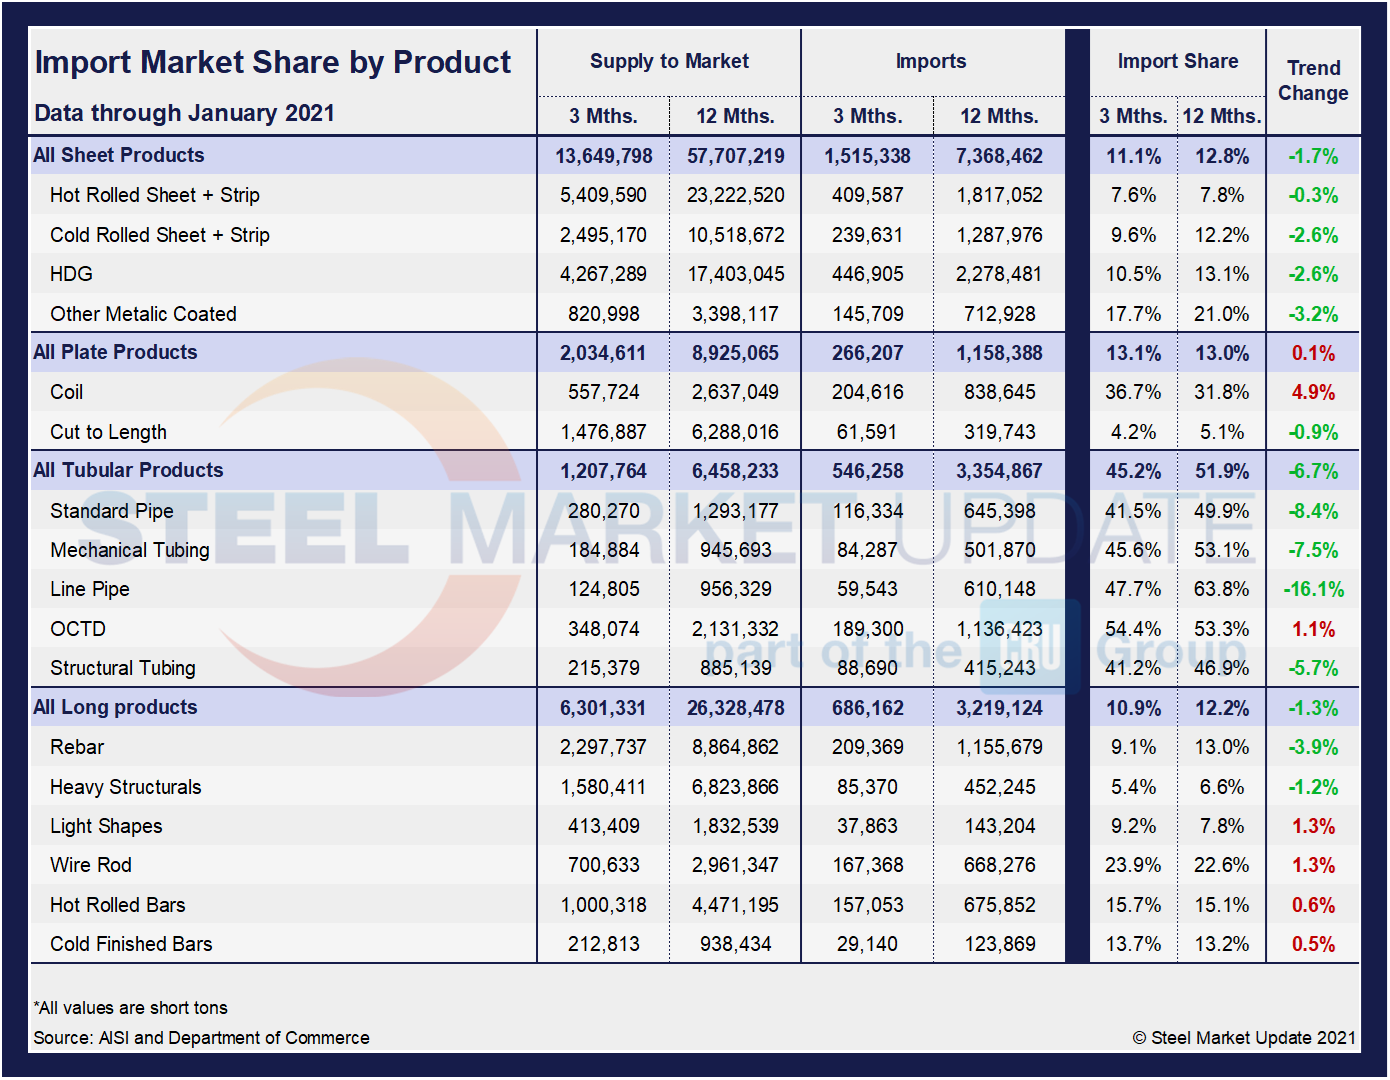
The table below shows total supply to the market in three months and 12 months through January 2021 for the four product groups and 17 subcategories. Supply to the market is the total of domestic mill shipments plus imports. It shows imports on the same three- and 12-month basis and then calculates import market share for the two time periods for 17 products. Finally, it subtracts the 12-month share from the three-month share and color codes the result green or red according to gains or losses. If the result of the subtraction is positive, it means that import share is increasing, and the code is red. The big picture is that import market share has decreased in three months compared to 12 months across all product groups except plate. Additionally, only six out of the 17 subcategories saw an increasing import market share through January. Most notable of those six subcategories are plate in coil (4.9%), wire rod (1.3%) and light shapes (1.3%) in three months compared to 12 months through January 2020.
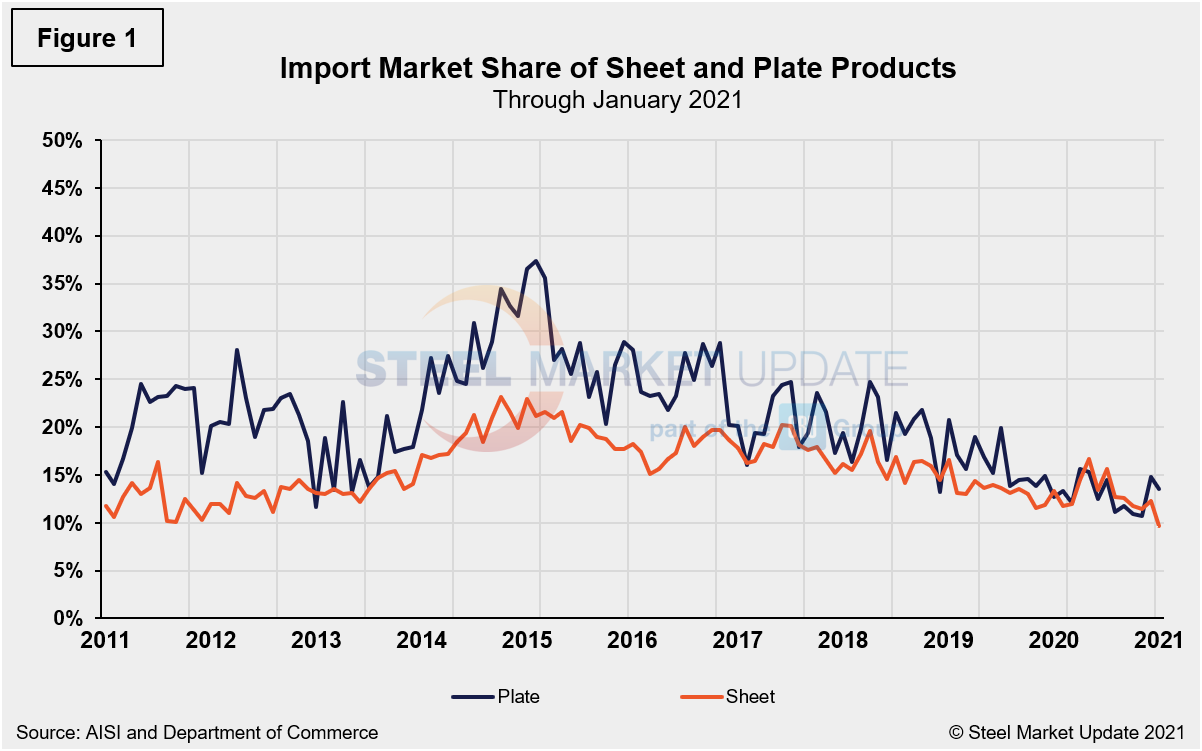
The historical import market share of plate and total sheet products is shown in Figure 1. The import share of plate has been decreasing erratically since February 2015. Sheet product import share has also coasted downward in the same timeframe. That trend reversed in December with the share of plate and sheet product imports posting gains, but they turned back down in January. The current market share of foreign sheet as of January 2021 is 9.7%, down from 14.7% in December and below November’s mark of 10.7%. Plate also slipped month on month, from 14.7% in December to 13.5% in January.
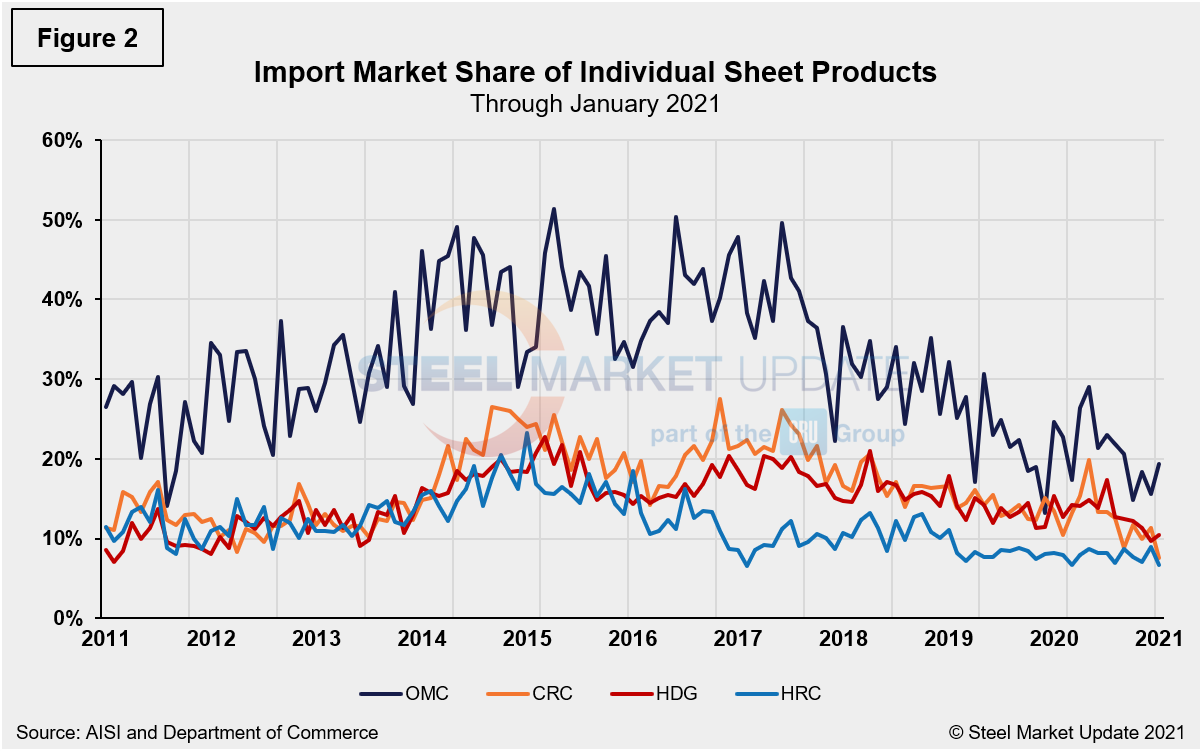
The import market share of the four major sheet products is displayed in Figure 2. Other metallic coated (mainly Galvalume) traditionally has had the highest import market share, but the gap has closed substantially since late 2017. For the last four years, hot rolled coil has had the lowest import market share of the major sheet products, currently at 6.7% through January. The coming months may paint a different picture as a surge of foreign steel products is expected to arrive on U.S. soil.
The domestic shipments, imports and import market share of the four major sheet sectors are highlighted in Figures 3-6 below. The biggest change has been that domestic shipments of OMC (Figure 6) have more than doubled since 2014 with a corresponding decrease in import market share. Shipments of CRC (Figure 4) and HDG (Figure 5) are also inching closer to pre-pandemic levels. By comparison, the import market share of CRC has declined by half since 2017. The import market shares of hot rolled and HDG have drifted down as well over a similar period, but at a less dramatic rate.
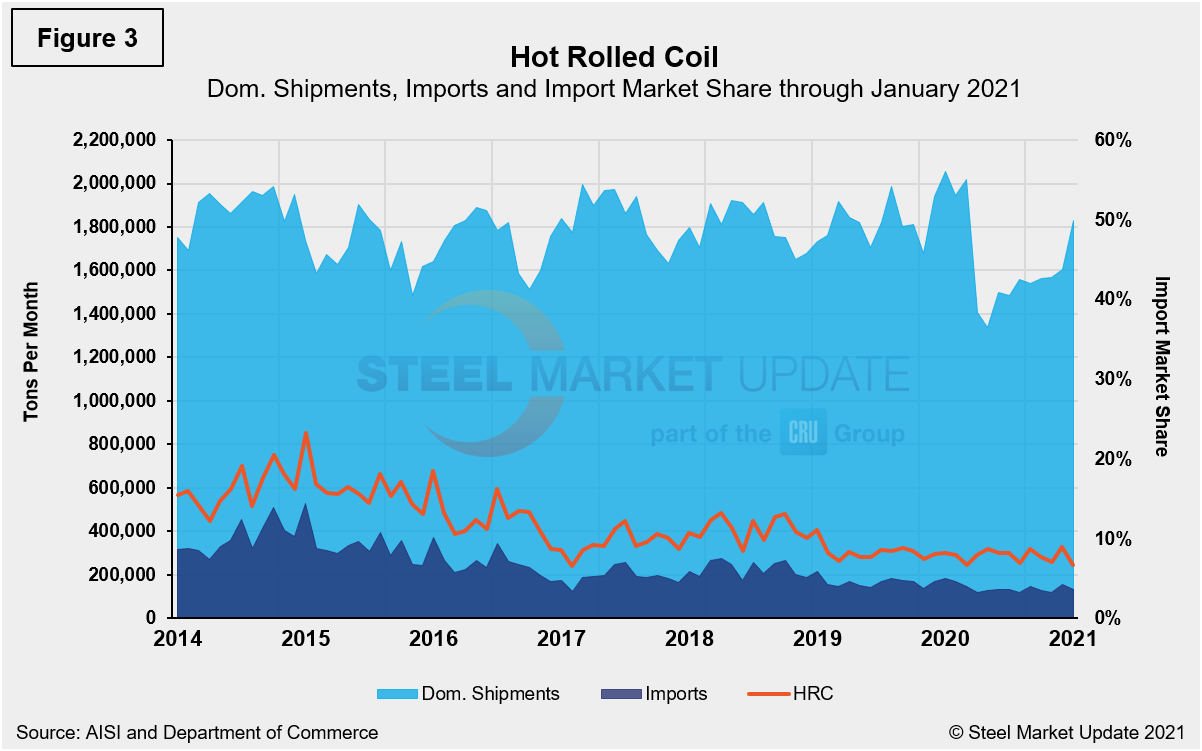
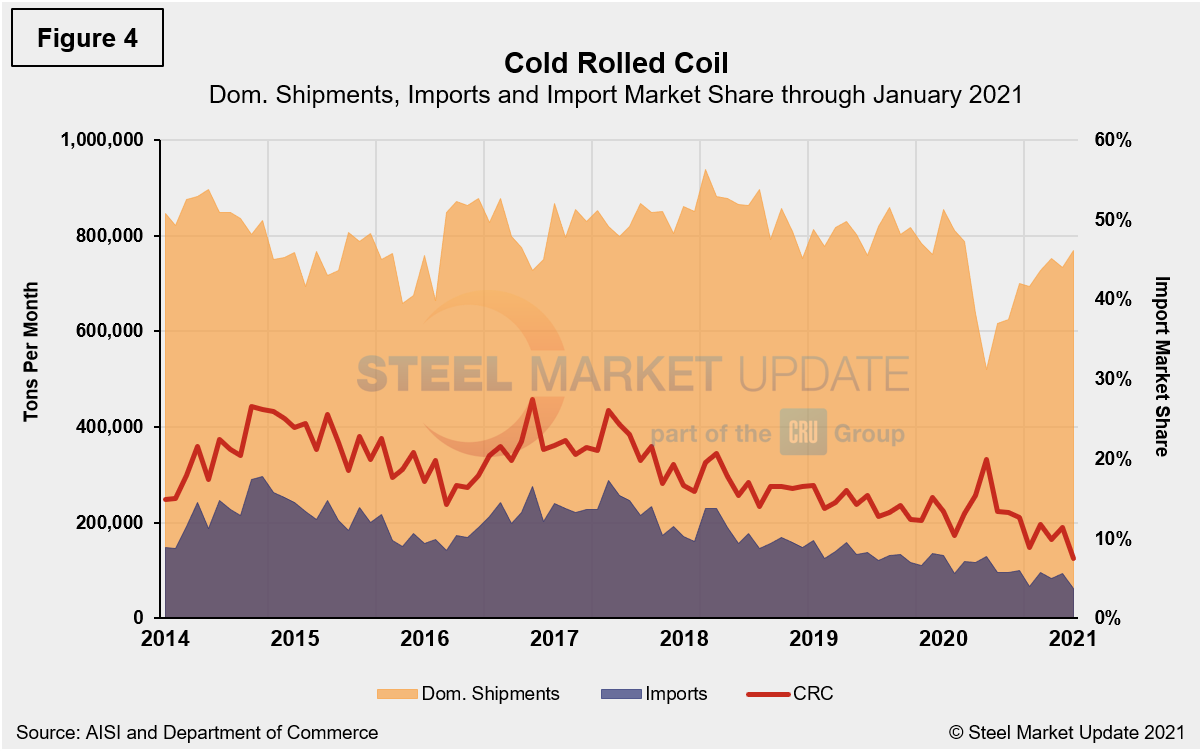
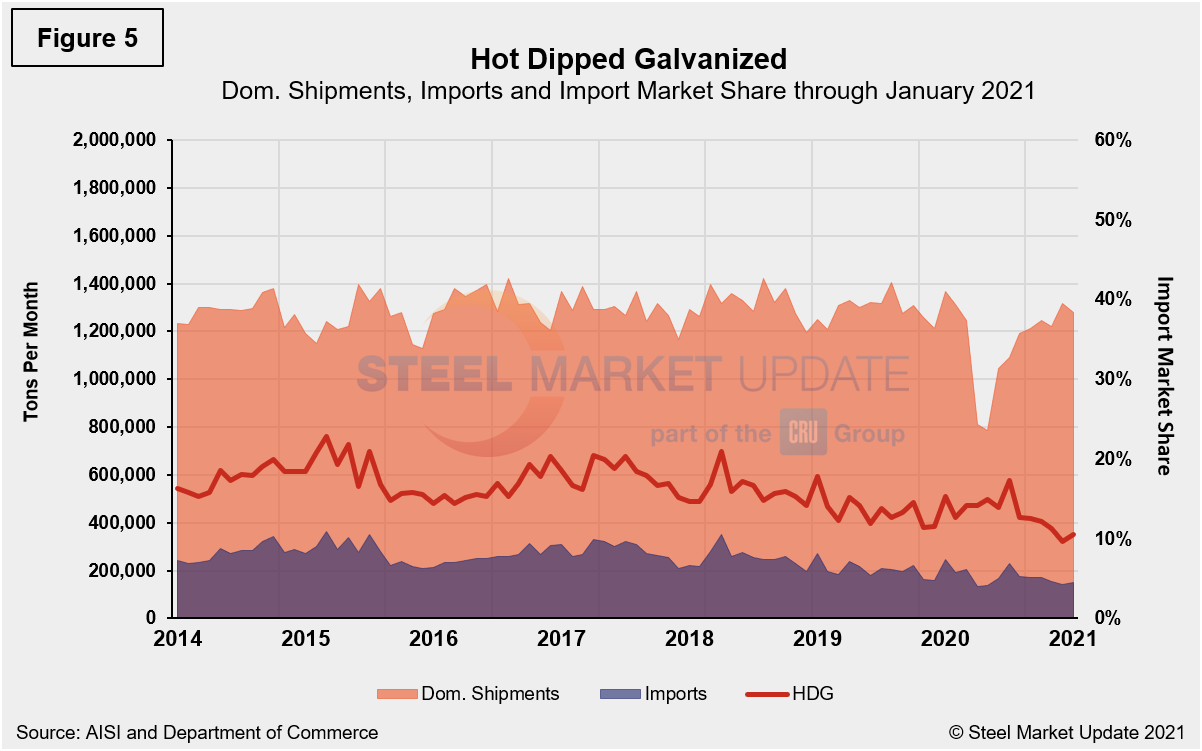
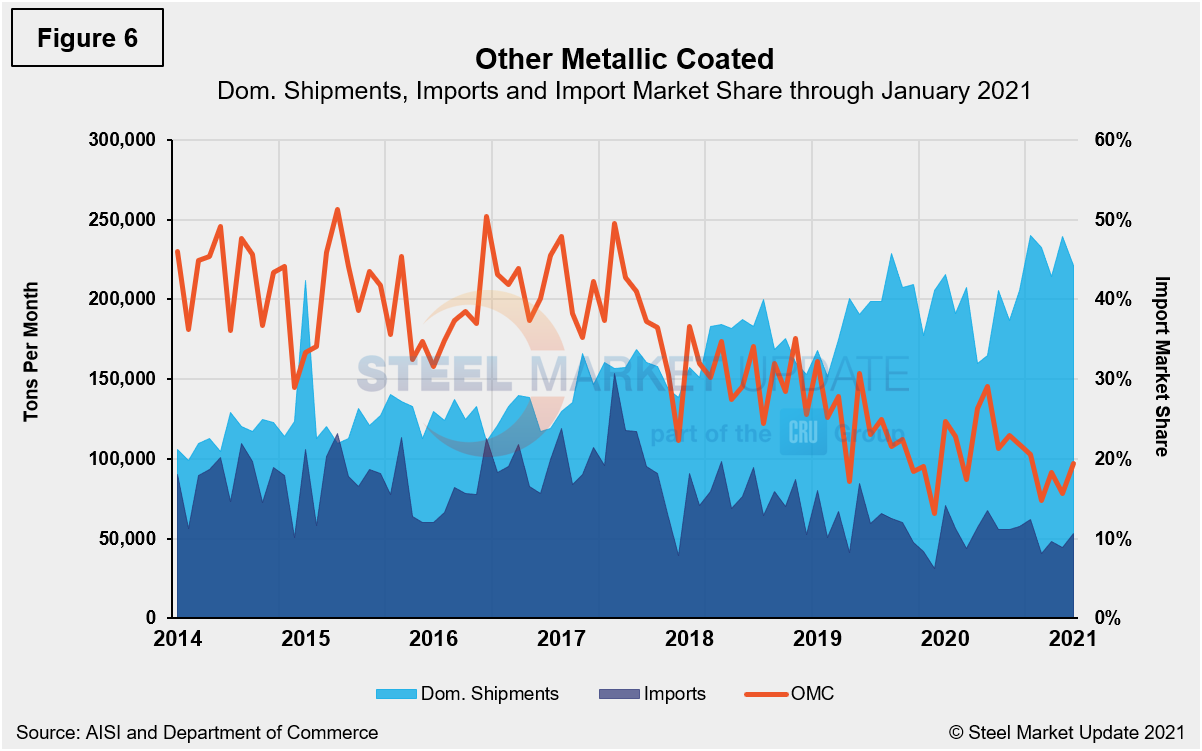
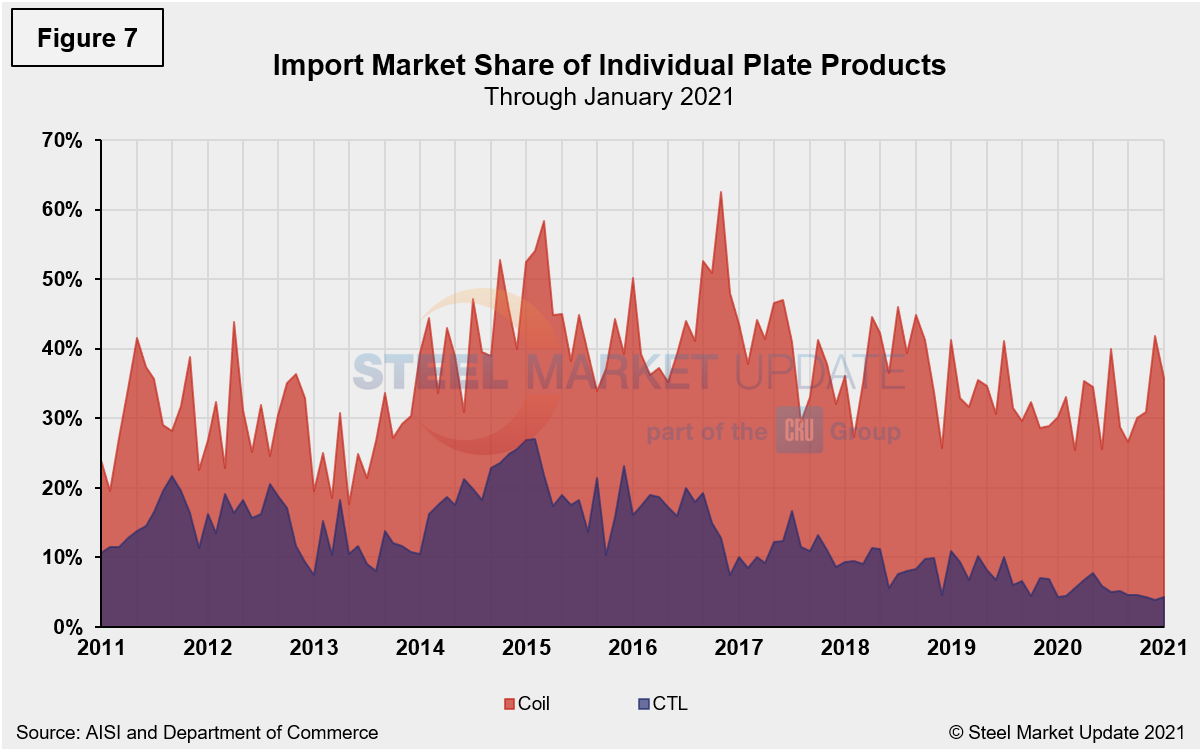
Figure 7 breaks out coiled and discrete plate from the flat rolled total and shows that from January 2020 through January 2021 coiled plate imports had more than five times the market share of CTL imports. CTL imports fell from 20.0% in July 2016 to just 4.3% this January, but up from 3.9% month on month. By comparison, coiled plate imports rose from 26.6% in September to 41.9% in December, but slipped to 35.8% in January.
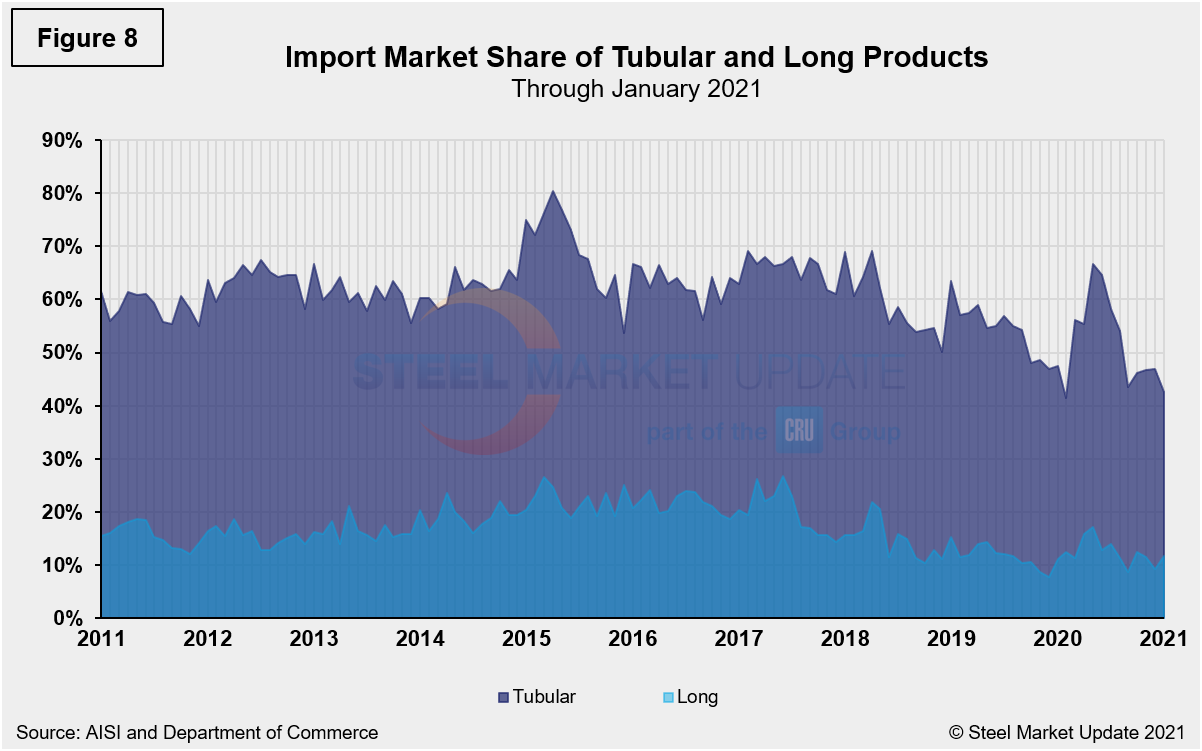
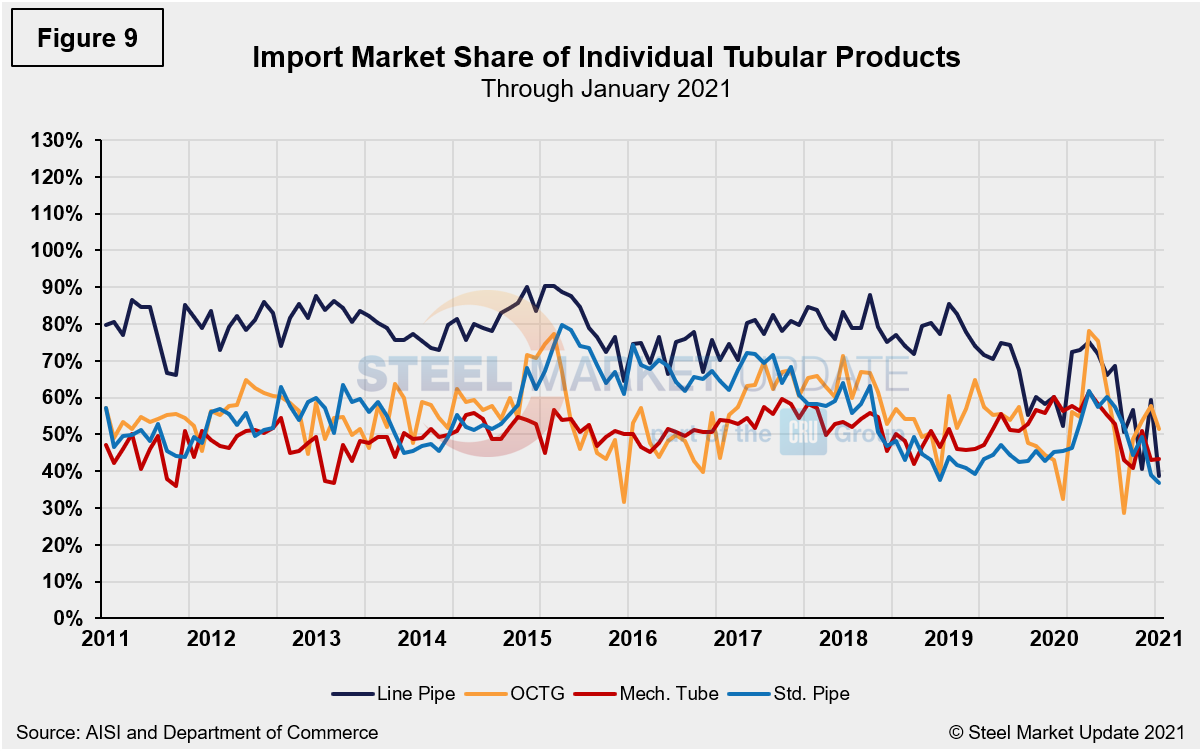
The following is the total import share of tubular goods and long products (Figure 8) and the import market share of the individual tubular products (Figure 9). Both import share of tubular goods and longs have come off from their highs in 2015, though long products at a more accentuated rate. Since 2016 alone, the import market share of long products (Figure 8) has declined by more than half, while tubular goods’ share has decreased by nearly 29%. Long products rose slightly in January to 11.7% compared to 9.4% in December, while tubular goods dipped to 42.5% in January from 47.0% the month prior. The import market share of the individual tubular products (Figure 9) is very high compared to other steel product groups. Standard pipe, which was the highest, fell in January to 38.8% from 59.3% the month prior. OCTG has rebounded, after dropping from 78.2% last May to 28.7% in September, but slipped from 57.8% in December to 51.3% in January.
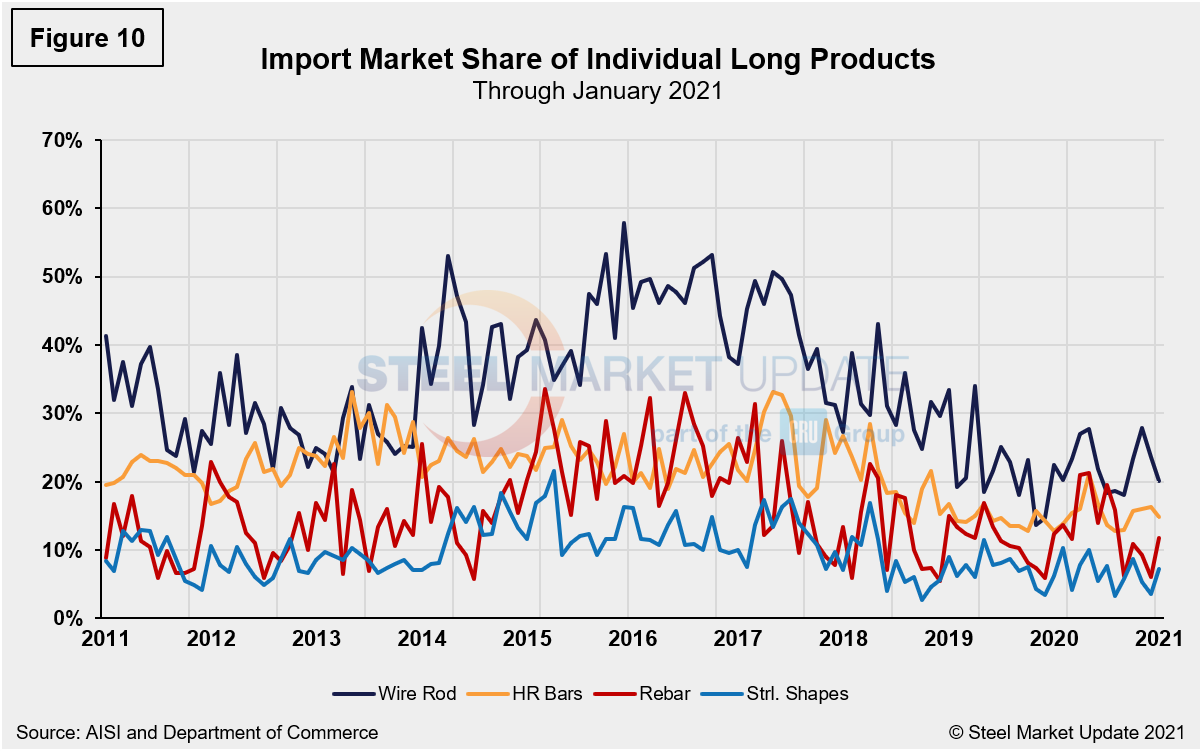
The detail for the four major sectors of the long products group since January 2011 is shown in Figure 10. The most significant change in this sector was for wire rod, which in the years 2014 through most of 2017 had double the import market share of the other long products. In the second half of 2017, the gap began to narrow; the import share of wire rod fell below that of rebar this past July. The sole long product to close out 2020 on an uptrend was hot rolled bars, seeing repeated increases from 12.7% in August to 16.3% in December.
SMU Comment: January’s import market paints a very different picture than what’s expected in the coming months. Although the overall import market share decreased over three months compared to 12 months through January, the balance of the first quarter, and likely the first half of the year, will see a rising trend of lower-priced foreign steel arriving on U.S. soil as a direct result of historically high domestic prices.
By David Schollaert, David@SteelMarketUpdate.com


