

Market Data

April 3, 2021
U.S. GDP Declines in 2020 Despite Recovery in Q3 and Q4
Written by David Schollaert
U.S. gross domestic product (GDP) finished 2020 with annualized growth of 4.3% in the fourth quarter, a slight upward adjustment based on the third estimate from the Bureau of Economic Analysis (BEA). The third estimate included upward revisions to private inventory investment that was partly offset by a downward revision to nonresidential fixed investment.
An annualized GDP growth of 4.3% in Q4 is rather remarkable considering what transpired in 2020. Following the sharpest decline in U.S. history in Q2, GDP fell by a negative 31.4% during the height of the global pandemic, but bounced back strong with the highest jump ever recorded at 33.4% in Q3. Still, for full-year 2020, real GDP declined by 3.4% versus 2019, the worst year for the economy since 1946.
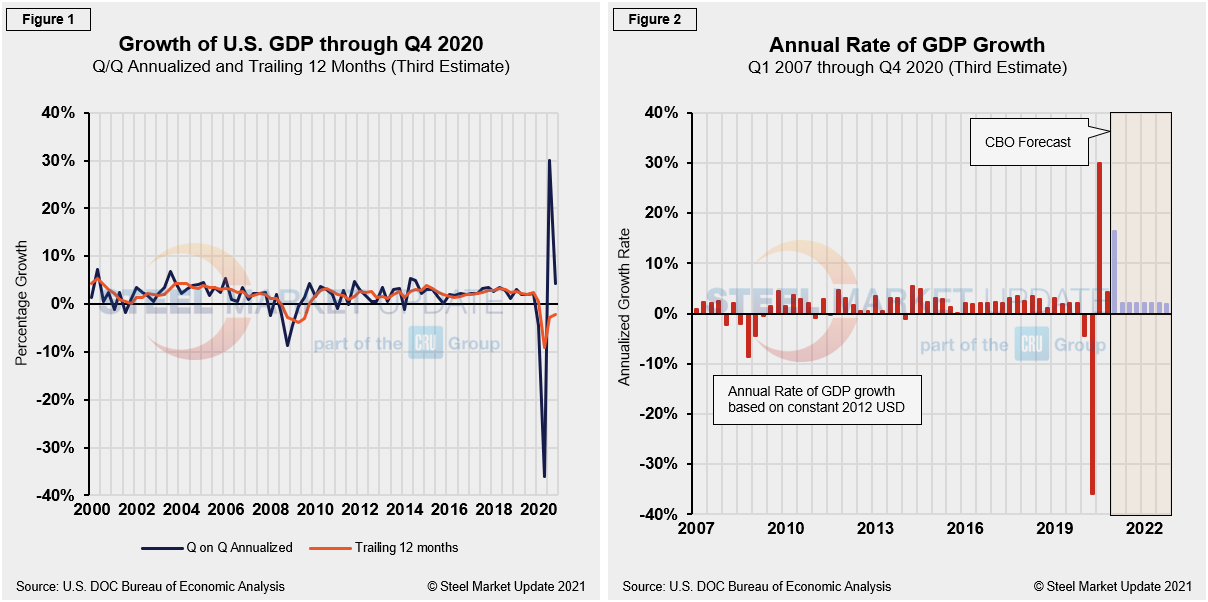
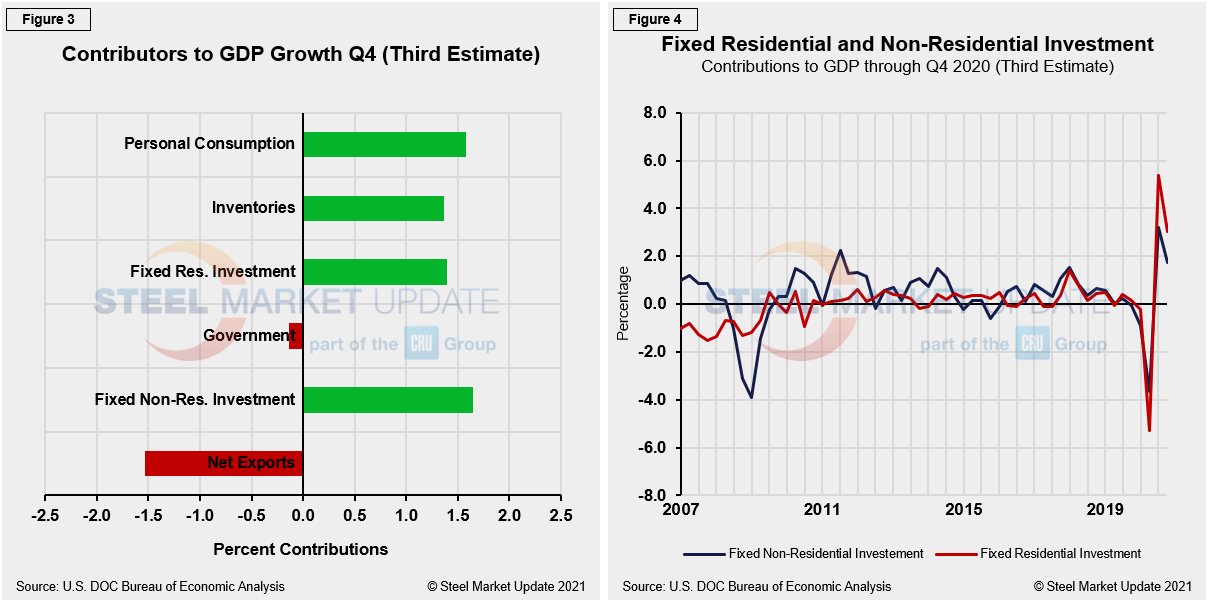
Fourth-quarter GDP totaled $21.49 trillion, up from $19.22 trillion in Q4 2019, measured in chained 2012 dollars on an annualized basis. In Figure 1, the orange line is the trailing 12-month growth and the dark blue line is the headline quarterly result. On a trailing 12-month basis, GDP was down by 2.22% in Q4, though it was an improvement from negative 9.04% in Q2 and negative 2.74% in Q3. In the same period in 2019, the trailing 12-month growth rate was positive 2.33%. For comparison, the average in 43 quarters since Q1 2010 has been a positive growth of 1.95% in the latest revision, up from 1.87% in the second estimate. The blue line in Figure 1 shows the progress of the trailing 12-month result since Q1 of 2000. Figure 2 details the headline quarterly results also since Q1 2007 including the Congressional Budget Office’s (CBO) GDP projection through 2022.
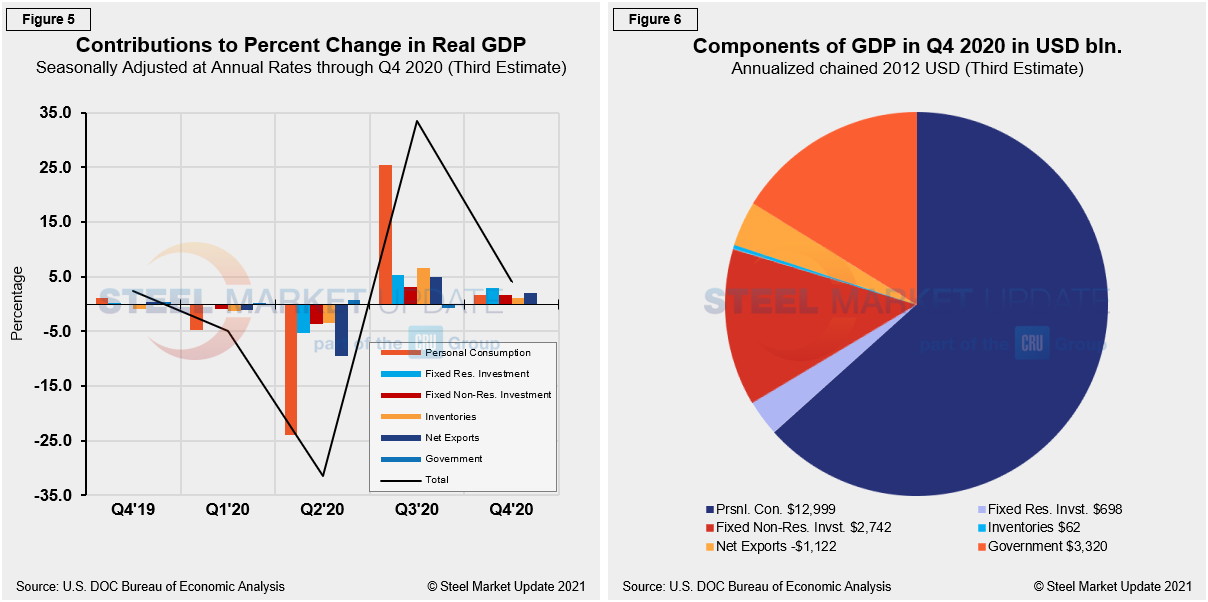
The mix of the six major contributory components in the final GDP growth calculation is shown in Figure 3. The most notable change and major source of GDP fluctuation is still personal consumption, which saw a negative 24.01% contribution in Q2, followed by a positive 25.44% contribution in Q3, but only providing a meager positive 1.58% contribution in Q4’s third estimate, a marginal decrease from 1.61% in Q4’s second estimate. Personal consumption typically best highlights consumer confidence and spending engagement. The fact that it was not the dominant growth driver in Q4, but a close second at 1.58% growth, continues to shine a spotlight on the COVID-19 effect on overall market sentiment and the U.S. economy.
Fixed nonresidential investment (Figure 4) was the main driver in Q4’s third estimate with 1.65% growth, down, however, from 1.76% growth in the second estimate. Government and net exports were the only major components with negative results in the latest fourth-quarter GDP revision. The comparison below between fixed residential and nonresidential investment notes that both GDP contributing components are still edging down from the over-correction growth seen in Q3.
Quarterly contributions of the six major subcomponents of GDP since Q4 2019 are shown in Figure 5. Clearly, the contraction and recovery were driven by the consumer in the previous two quarters. In Q4 there wasn’t a single standout contribution from the six major GDP components; however, the overall positive report is the first consecutive growth quarter on quarter in two years. Figure 5 is detailed out for cross-comparison with Figures 1 and 2, while Figure 6 shows the breakdown of the $21.49 trillion economy in BEA’s third estimate of Q4’s GDP.
SMU Comment: Although the fourth-quarter GDP third estimate edged up to 4.3% from 4.1% in the second estimate, the increase is nowhere near the record-setting 33.4% growth seen in Q3. General market sentiment remains hopeful and expectant. However, final Q4 results underscore that the economic recovery is far from over as the long-term impact of the global pandemic is still being quantified. Despite repeated GDP growth in the second half of 2020, the damage done in Q1 and Q2 were too extensive.
By David Schollaert, David@SteelMarketUpdate.com


