

Market Data

April 30, 2021
GDP Shows 6.4% Growth in Q1’s Early Estimate
Written by David Schollaert
U.S. gross domestic product (GDP) rose by 6.4% in the first quarter of 2021 on an annualized basis, according to the advanced estimate from the Bureau of Economic Analysis (BEA). The gain marks the second-fastest pace of growth since Q2 2003 and was exceeded only by the pandemic-reopening-fueled burst of Q3 in 2020. This growth follows the 4.3% real GDP increase seen in Q4 2020.
Economic activity in the U.S. took off to start 2021 due to continued recovery following widespread vaccination efforts, another round of federal direct economic impact payments and expanded unemployment benefits. The boost in real GDP in the first quarter reflected increases in personal consumption expenditures, residential and nonresidential fixed investment, federal government stimulus, and state and local government spending, which were partly offset by decreases in private inventory investment and exports.
The increase in Q1 marks the third consecutive quarter of growth, which is remarkable considering the historic slowdown seen in the first half of 2020. When COVID hit, more than 22 million American workers were forced to the unemployment line as GDP plunge an unprecedented 31.4% in Q2 of 2020. It has since bounced back with the highest jump ever recorded at 33.4% in Q3. Government assistance payments have helped the economy rebound. However, the Bureau of Economic Research still has not declared an end to the recession as GDP in total dollars has not recovered to prior levels.
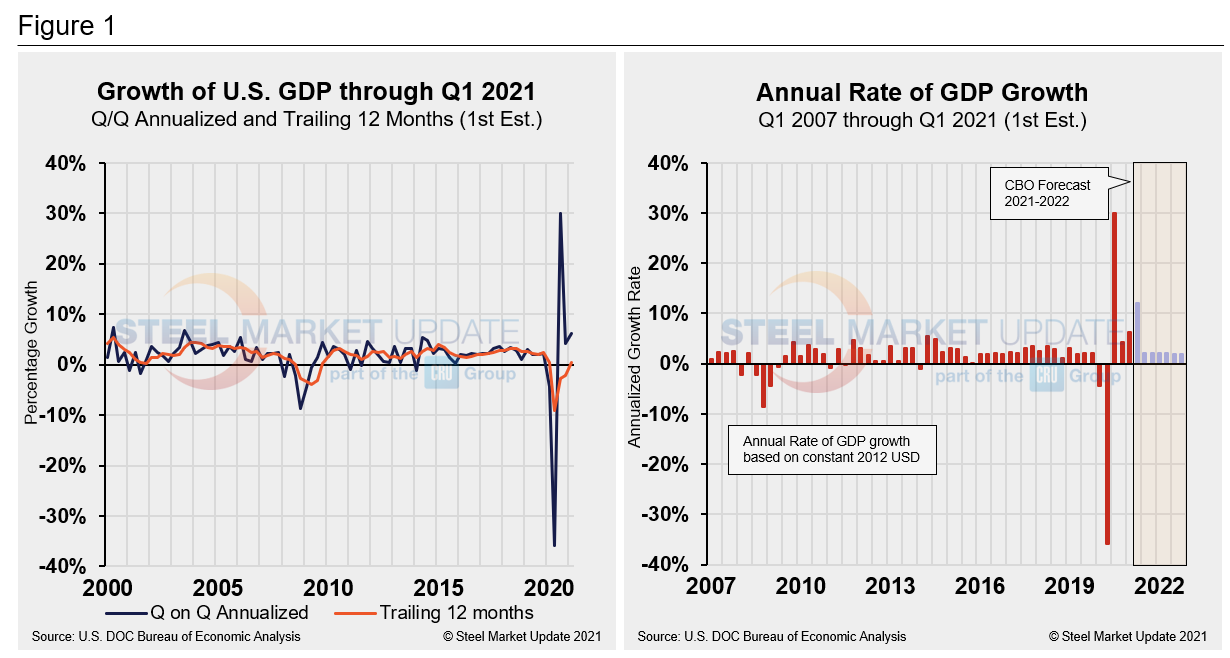
First-quarter GDP totaled $22.05 trillion, a 10.7% or $554.2 billion increase from the previous quarter, and up from $21.54 trillion in Q1 2020, measured in chained 2012 dollars on an annualized basis. Below in Figure 1 is a side-by-side comparison of the growth of U.S. GDP and the annual rate of GDP, both through Q1 2021. In the first chart, the orange line is the trailing 12-month growth and the dark blue line is the headline quarterly result. On a trailing 12-month basis, GDP was up by 0.40% in Q1, a positive swing from a negative 2.22% in Q4, and a vast improvement from negative 9.04% in Q2 at the height of the pandemic. In the same period in 2020, the trailing 12-month growth rate was slightly higher at a positive 0.44%. For comparison, the average in 43 quarters since Q1 2010 has been a growth rate of 1.96%. The blue line in the same chart shows the progress of the trailing 12-month result since Q1 of 2000. The chart on the right details the headline quarterly results since Q1 2007 including the Congressional Budget Office’s GDP projection through 2022.
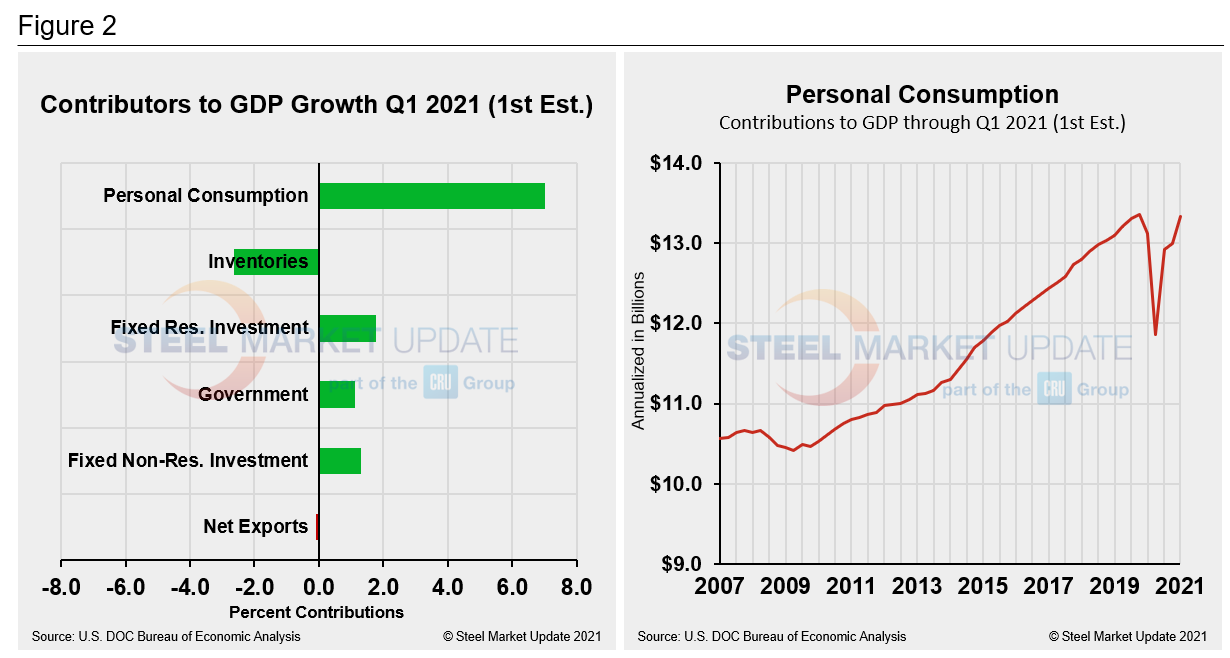
Shown below in Figure 2 is a side-by-side comparison of two charts. On the left is the mix of the six major contributory components in the GDP growth calculation, while the chart on the right puts a spotlight on personal consumption. The most notable change and major source of GDP fluctuation is still personal consumption, which saw a negative 24.01% contribution in Q2, followed by a positive 25.44% contribution in Q3 last year. Personal consumption in the first quarter of 2021 rose to a positive 7.02%, up from positive 1.58% the prior quarter. Personal consumption typically reflects consumer confidence and spending engagement. The fact that it was the dominant contributor in the first quarter of 2021—for the first time since Q4 2019—highlights the continued recovery across to the U.S. economy and improved overall market sentiment.
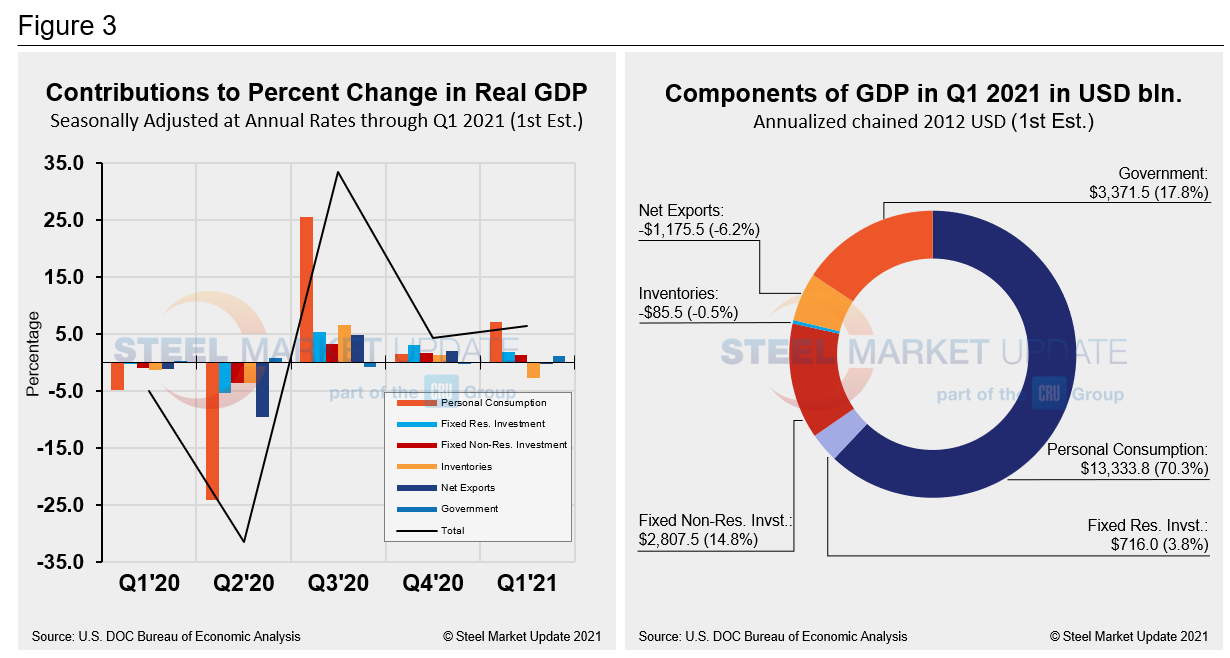
Quarterly contributions of the six major subcomponents of GDP since Q1 2020 and the breakdown of the $22.05 trillion economy in BEA’s advanced estimate of Q1’s GDP are both shown in Figure 3. The chart on the left is detailed out for cross-comparison with Figure 1 above. The chart on the right shows how personal consumption was the biggest contributor to the recovery in Q1.
SMU Comment: The reported 6.4% GDP increase in BEA’s Q1 2021 advanced estimate is a hopeful sign that the worst of the pandemic has passed, though the economic recovery is still ongoing. The long-term impact of the global pandemic remains to be quantified.
By David Schollaert, David@SteelMarketUpdate.com


