Analysis

January 18, 2022
Final Thoughts
Written by Michael Cowden
SMU’s latest prices are out, and hot-rolled coil is down by $55 per ton while galvanized prices are down a comparatively modest $25 per ton.
That’s been the trend for a while now – that galvanized prices have been “stickier” than hot-rolled coil prices on the way down.
I wrote last week in Final Thoughts that I didn’t think that trend would continue, and I’m going to double down on that prediction this week – with some charts that I think provide clear evidence that galvanized prices can’t defy gravity forever. Here is the first:
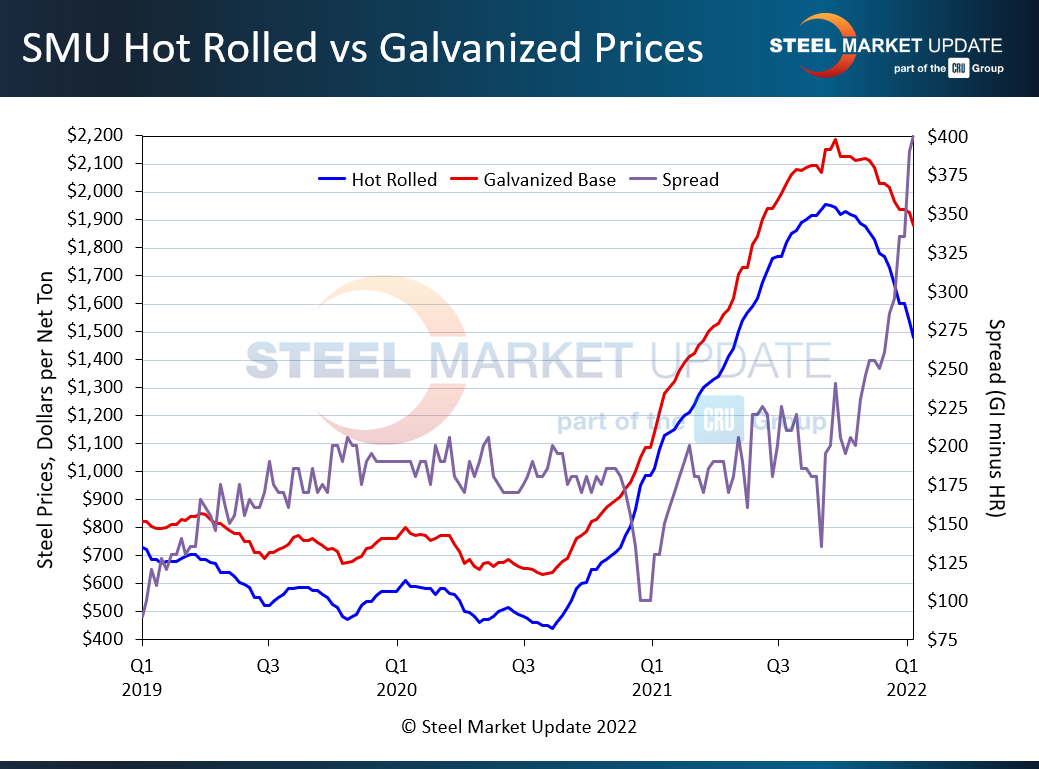
It’s a little complicated. But bear with me. The blue line is hot rolled prices. The red line is galvanized base prices. And the purple line is the spreads between the two. Prices in dollars per ton are on the left. And the spreads between the hot-rolled and galvanized are on the right. What’s the result of HRC prices falling faster than galvanized prices since last fall? Spreads that have ballooned to levels we’ve never seen before. We’re talking spreads of $400 per ton or more. That’s more than four times what they were around a year ago when HRC-galv spreads briefly fell below $100 per ton.
Let’s narrow in on just the spreads:
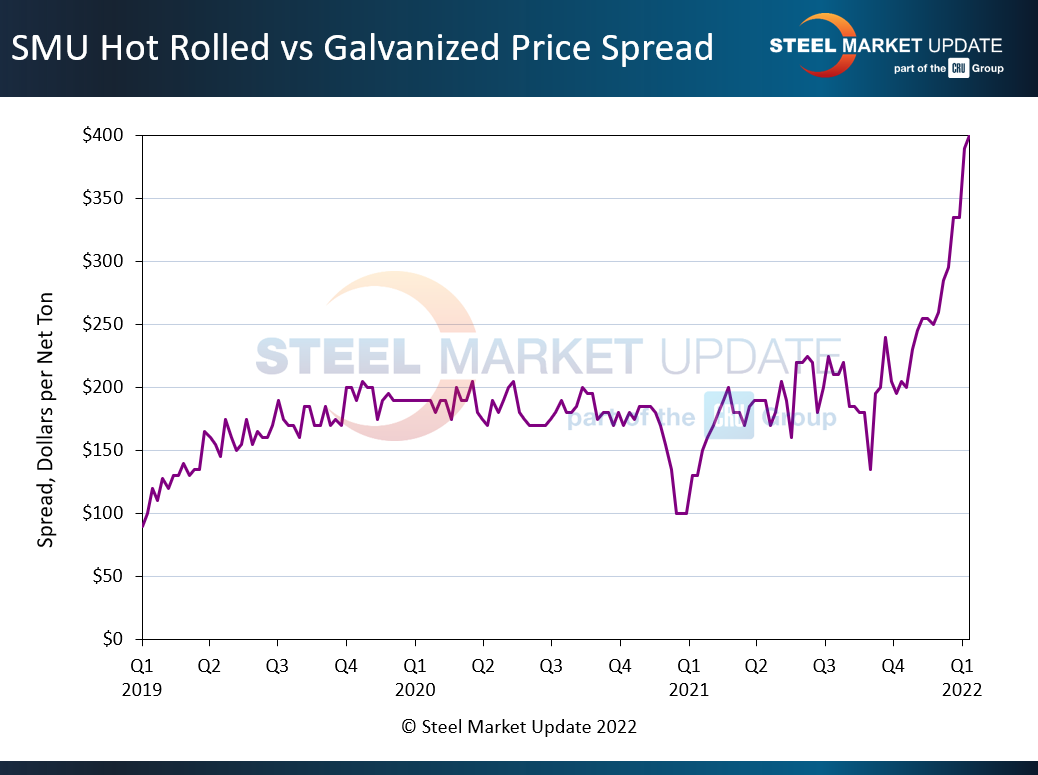
You can see HRC-galv spreads since 2019 have mostly been in the range of $150-200 per ton – let’s say $175 per ton on average. In other words, spreads are now more than double what they were over the last few years. And I just don’t think that is sustainable.
And keep in mind that spreads since 2019 have been wider than they were if you look back to 2008-09, the last time we had market swings on par with what we’re seeing now.
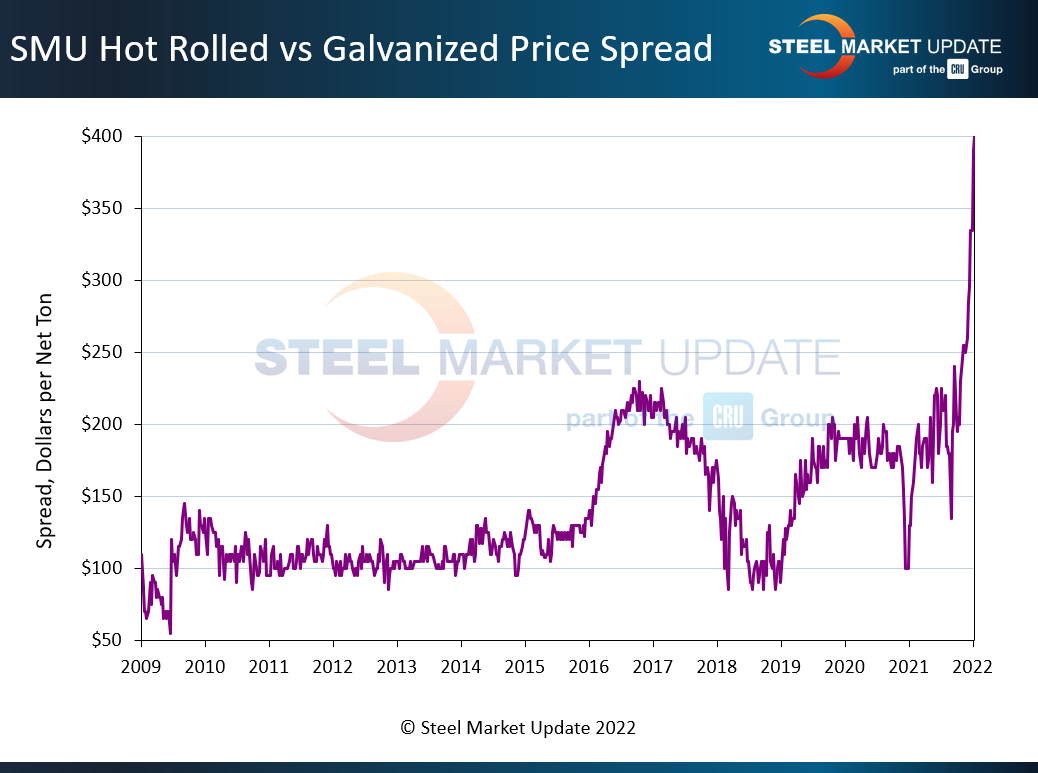
You can see that from roughly 2009 to 2016 spreads were mostly in the range of $100-$150 per ton – let’s say $125 per ton on average.
If there is a saving grace, it’s that what we’re seeing is comparatively modest compared to past cycles. This is the HRC-galv spread as a percentage of HR prices. So what we’re seeing now might be unprecedented in absolute terms – in dollars per ton. But this kind of volatility, at least so far, is muted compared to what we’ve seen since about 2015.
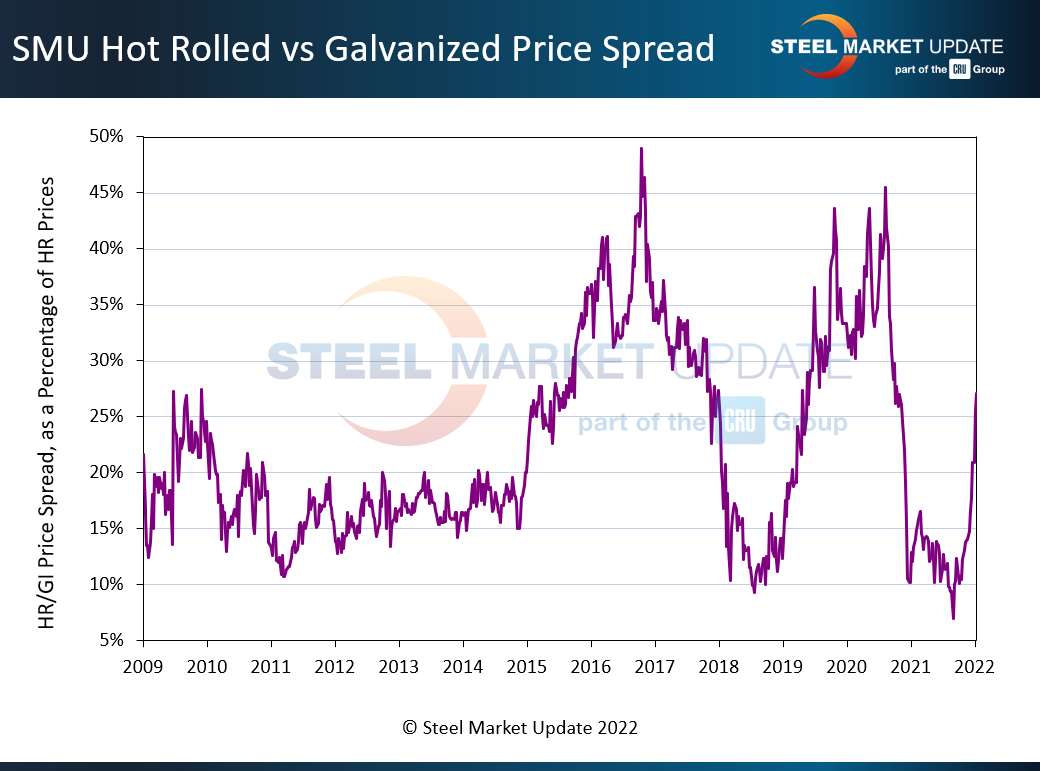
I’m honestly not sure why things have been so volatile since ’15. Is it trade cases, changes in inventory management, or something else entirely? Some of our members are no doubt in a better position than me to answer that one.
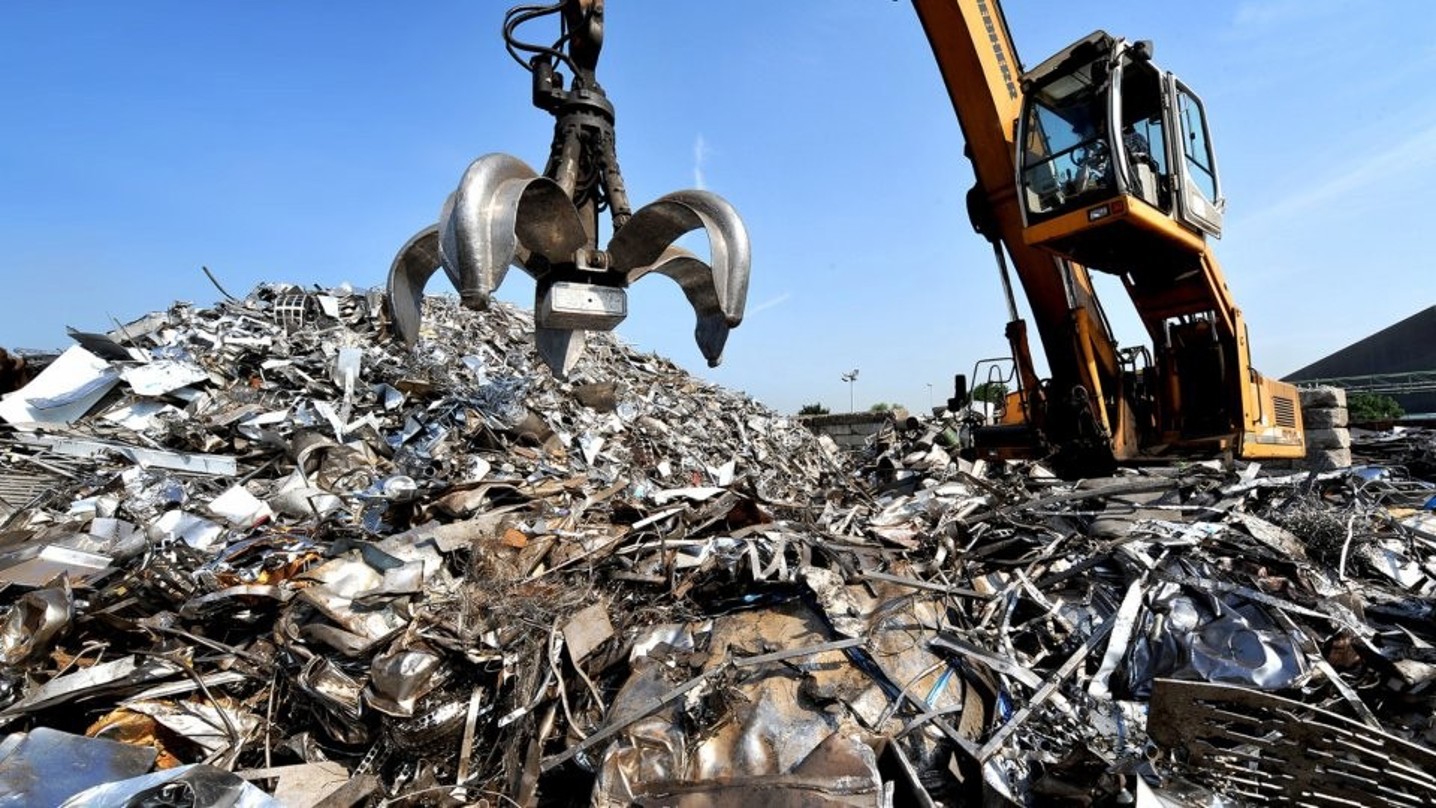
The other thing I’d note about 2015 is that was the last time we had scrap fall in a big way in the first quarter. And 2015 turned out to be a bad year for steel – scrap prices fell hard in February of that year, and steel prices continued to dribble down for the balance of the year. Scrap fell $60 per ton this month. That’s not a great start to the year, and that’s definitely a bearish signal. Still, underlying demand seems to be good – or at least that’s what people are telling us.
I think we’re all focused on potential downsides right now: How far will prices fall and how quickly? And rightly so. But let’s not be so focused on the negative that we don’t consider potential upside risks. Higher energy costs in Europe, flooding in Brazil – these are things that could put a floor under prices abroad. Also, there are a lot of factors to consider now that we didn’t have to think about much in 2015 – or in 2008-09, for that matter. Inflation, COVID-19, shortages of parts and labor. And I would not underestimate a pandemic economy’s tendency to throw curve balls. (Any bets on the next new variant?)
It’s dumb to say this time is different. But it’s not smart to say this time is the same. Let’s try not to let the past cloud our vision so much that we can’t see what’s in front of us.
Good luck out there. And thanks from all of us at SMU for your business.
By Michael Cowden, Michael@SteelMarketUpdate.com