

Market Data

February 25, 2022
U.S. GDP Expands at Strong 7% Rate in Q4
Written by David Schollaert
U.S. gross domestic product (GDP) expanded at a 7% annualized rate in the fourth quarter as businesses stepped up their restocking of supplies, according to the Bureau of Economic Analysis (BEA) advanced estimate.
This second review and upward revision to fourth-quarter GDP growth by the BEA reflected more business spending on nonresidential structures and investment in homebuilding than initially thought. There were also modest upgrades to state and local government spending that were partly offset by downward revisions to personal consumption expenditures and exports.
The economic momentum in early fourth quarter, however, appeared to have faded by December amid a strong headwind from Omicron variant infections. But activity has since picked up as the winter wave of infections subsided. Despite the deceleration at end of the year, the boost was well above the 2.3% growth in Q3, and surprisingly higher than estimated gains of 5.5% from market experts.
For all of 2021, the nation’s GDP jumped by 5.7%, the fastest calendar-year growth since a 7.2% surge in 1984 in the aftermath of a recession.
So far this year, though, the outlook for the economy has dimmed considerably in the face of accelerating inflation, higher borrowing rates, anxious financial markets, a snarled supply chain, and Russia’s aggression in Ukraine. That has led to GDP growth estimates for the first quarter at or below a 2.0% rate.
Personal consumption, which accounts for more than two-thirds of GDP, rose 3.1% for the quarter, a 0.2 percentage point downward revision during the government’s second review. Gross private domestic investment, a gauge of business spending and inventory build, soared 32%. Inventories added substantially to the headline growth, boosted by motor vehicle dealers.
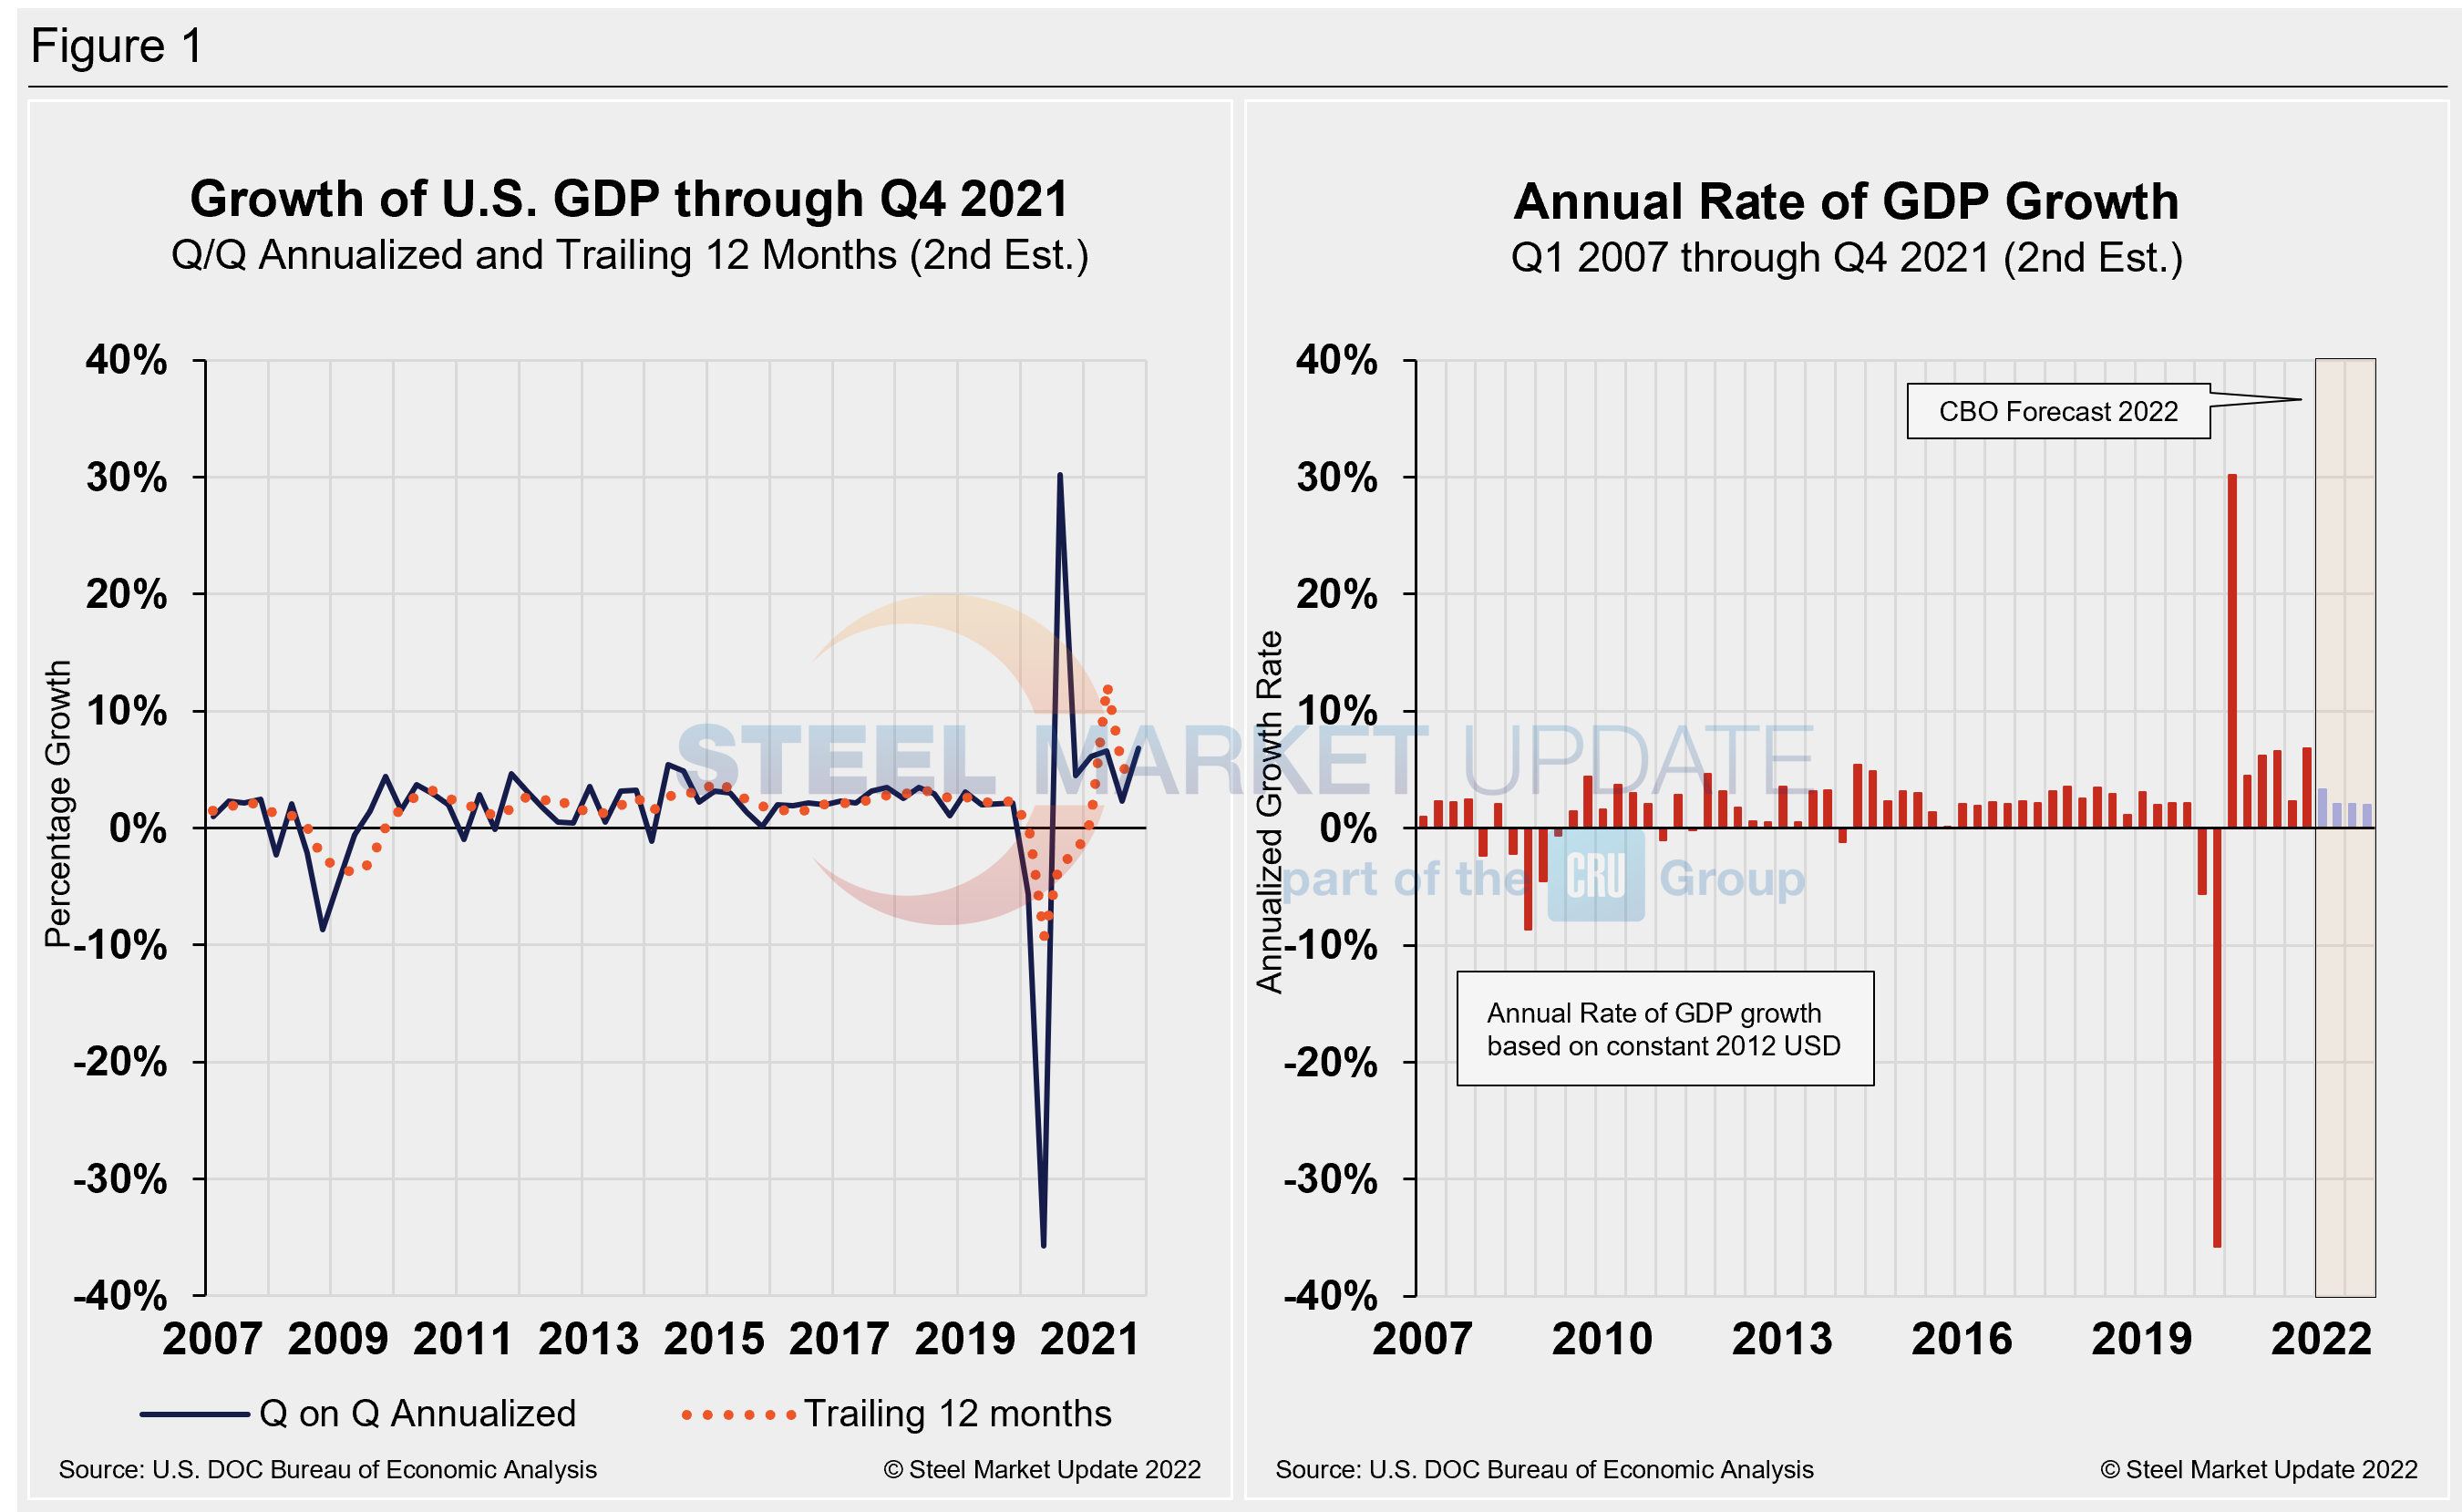
The Department of Commerce’s second look at U.S. GDP in Q4 totaled $24.01 trillion, a 14.6% jump or $806.2 billion over the previous quarter, measured in chained 2012 dollars on an annualized basis. Below in Figure 1 is a side-by-side comparison of the growth of U.S. GDP and the annual rate of GDP, both through Q4 2021. In the first chart, you’ll see the contrast between the trailing 12-month growth and the headline quarterly result. The chart on the right details the headline quarterly results since Q1 2007 including the Congressional Budget Office’s GDP projection through 2022.
On a trailing 12-month basis, GDP accelerated to 5.56% in the fourth quarter, up from 4.95% in the prior quarter but still well behind the 12.23% growth in Q2. Nevertheless, it’s a vast improvement from -9.27% in Q2 2020 at the height of the pandemic. For comparison, the average in 48 quarters since Q1 2010 has been a growth rate of 2.09%.
The economy’s growth in the final quarter of 2021 was driven by a 33.5% jump in business investment as companies worked to replenish their inventories. In fact, inventory restocking accounted for 70% of the fourth-quarter growth.
Also contributing to the upgraded estimate of growth in Q4 were stronger business investment and state and local government spending, offset by modestly weaker consumer spending.
For all of 2021, consumer spending surged 7.9%, the fastest such growth since 1946. But it slowed to an annual pace of 3.1% in the fourth quarter as an uptick in COVID variant cases, which has now faded, kept more Americans at home and away from restaurants, travel destinations and entertainment venues.
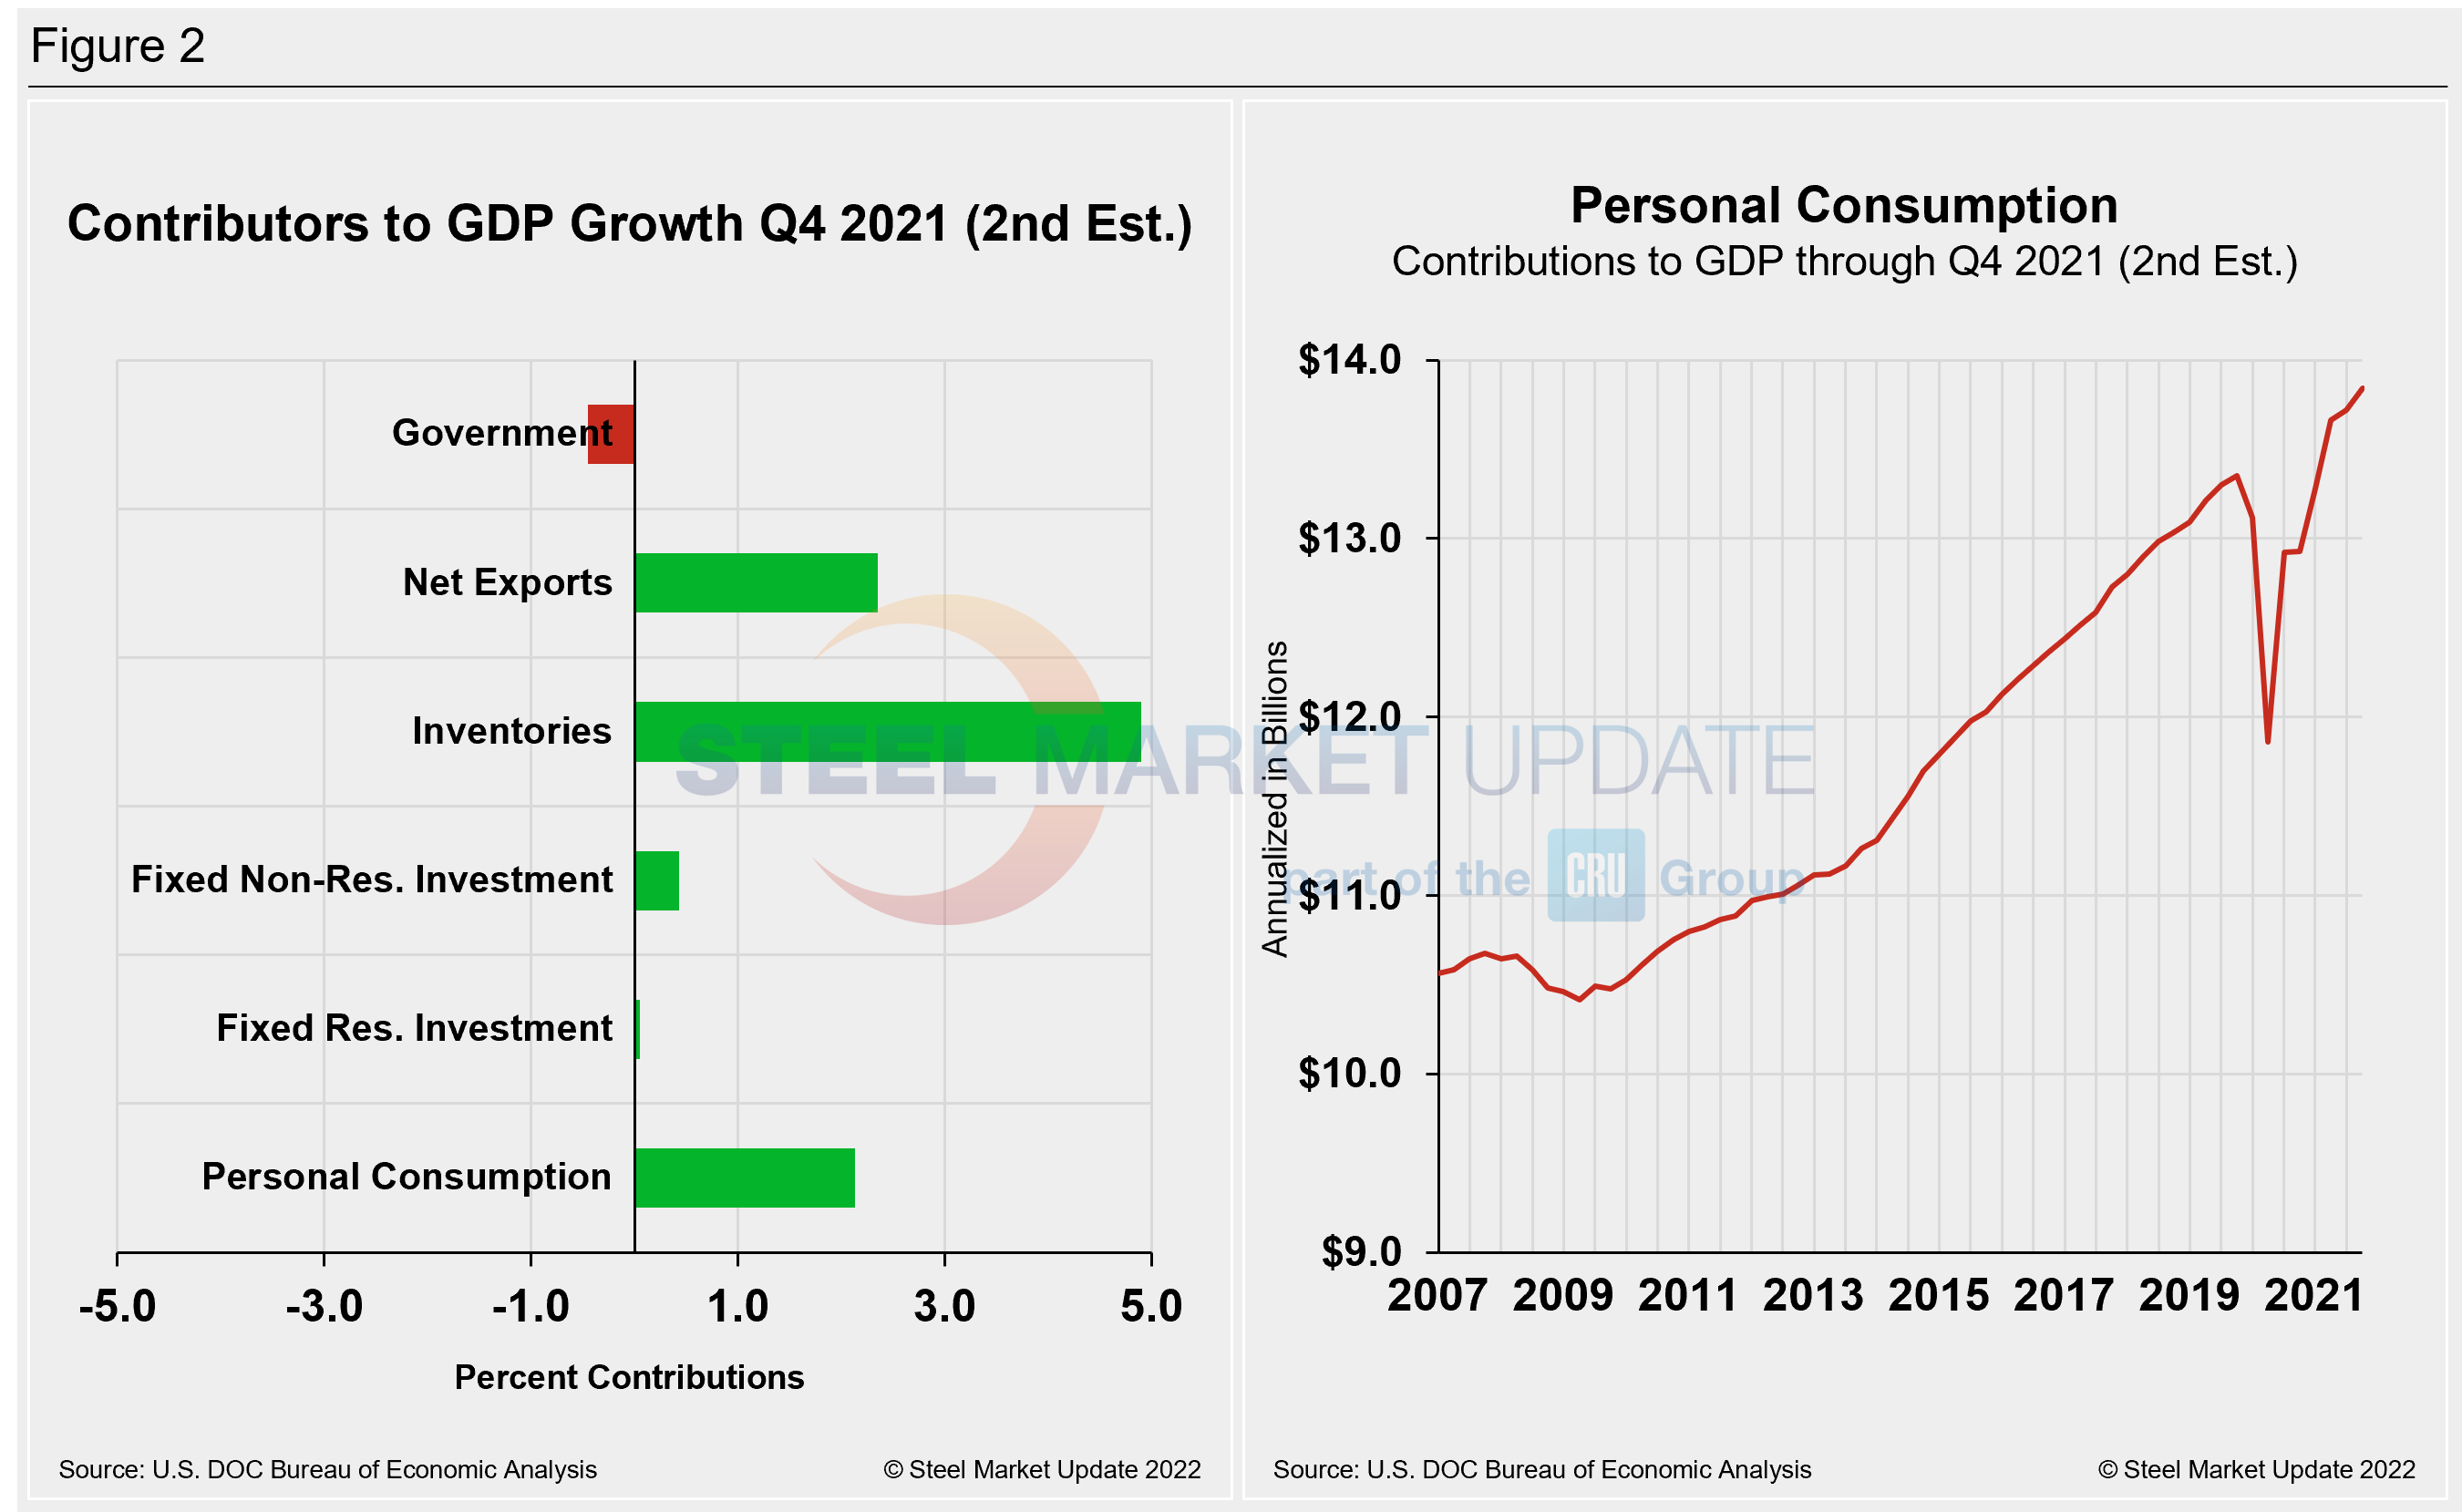
Shown below in Figure 2 is a side-by-side comparison of two charts. On the left is the mix of the six major components in the GDP growth calculation, while the chart on the right puts a spotlight on personal consumption, a measure of consumer confidence and spending engagement. The most notable change and major source of GDP fluctuation is personal consumption, which saw a -24.01% contribution in Q2 2020 at the onset of COVID, followed by a 25.44% rebound the following quarter as the economy reopened.
Personal consumption jumped from 1.58% in Q4 of 2020 to 7.42% in Q1, edging up to 7.92% in the second quarter. The slump to 1.35% in the third quarter was disappointing; however, Q4’s slight recovery to 2.13% was a welcome sign of economic improvement. The extreme shifts the U.S. economy has experienced over the past 16-24 months can be seen in the big swings in personal consumption.
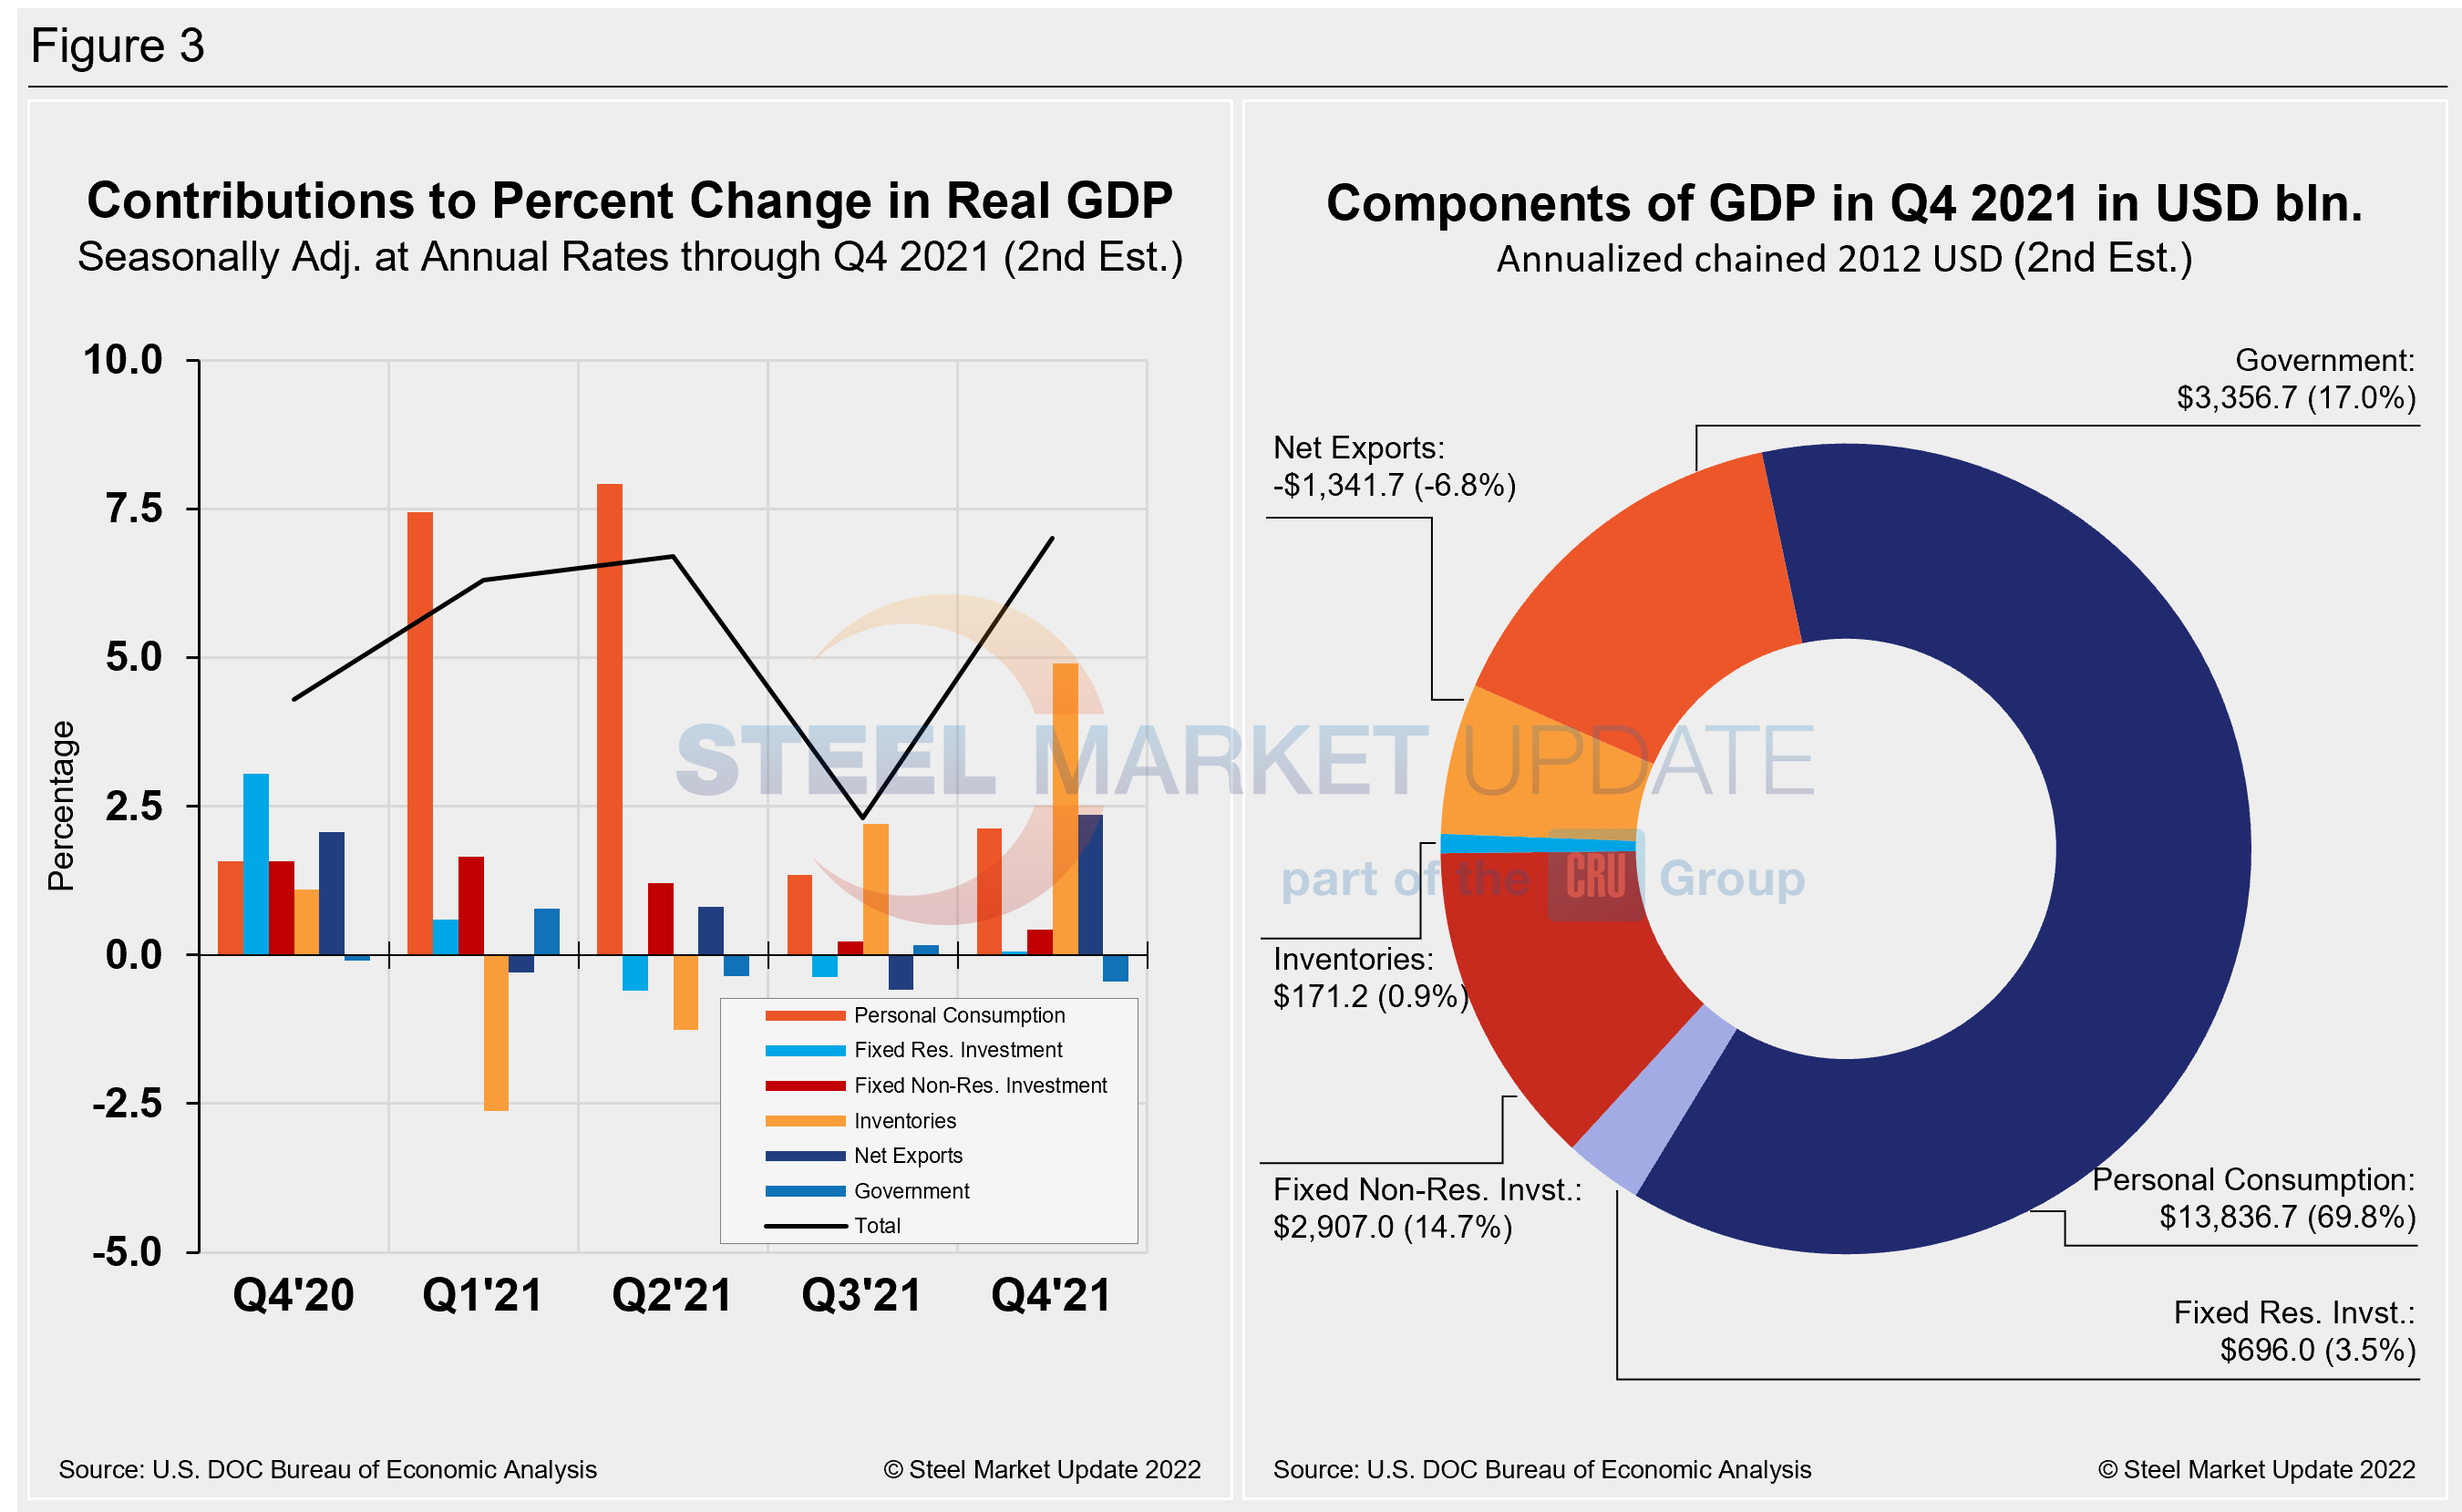
Quarterly contributions of the six major subcomponents of GDP since Q4 2020 and the breakdown of the $24.01 trillion economy in BEA’s second review of Q4 GDP are both shown in Figure 3. The chart on the left is detailed out for cross-comparison with Figure 1 above. The chart on the right shows the size of the other components relative to personal consumption.
SMU Comment: U.S. economic growth is being overshadowed by accelerating inflation and snarled supply chains that have resulted in shortages of parts and goods, disrupting businesses. Government stimulus aid that helped drive strong consumer spending in 2021 won’t be arriving to American households this year. Tack on higher borrowing rates the Fed is forced to impose due to high inflation, along with anxious financial markets and Russia’s invasion of Ukraine – a likely fallout on world energy markets – and it all adds to uncertainty in the economic outlook.
The International Monetary Fund has estimated that the U.S. economy will slow to growth of 4% this year. But the economy could weaken further if the Federal Reserve’s planned interest rate increases end up significantly slowing Americans’ borrowing and spending, as most estimates for first quarter 2022 are below a 2.0% rate. Needless to say, the U.S. economy will face significant headwinds in the months ahead.
By David Schollaert, David@SteelMarketUpdate.com


