

Market Data

March 3, 2022
Steel Mill Lead Times Inch Up; Still a Buyer's Market
Written by Brett Linton
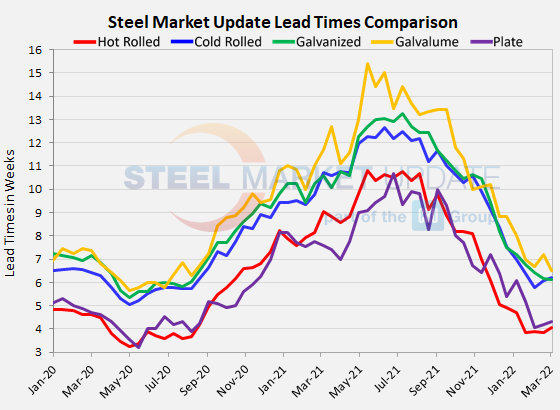
Steel mill lead times remain short, but yielded minor upward movements this week for most products, based on Steel Market Update’s latest check of the market. SMU’s data on mill negotiations shows buyers still have the upper hand.
Buyers polled this week by SMU reported mill lead times ranging from 2-6 weeks for hot rolled, 4-8 weeks for cold rolled, 4-8 weeks for galvanized, 4-8 weeks for Galvalume, and 3-6 weeks for plate.
The latest survey shows that the average lead time for hot rolled rose one-quarter of a week to 4.07 weeks, a two-month high. Cold rolled lead times now average 6.22 weeks, a small increase from 6.07 in late-February. Galvanized lead times slipped to a new low of 6.12 weeks, now at the lowest level seen since August 2020. The average Galvalume lead time fell from 7.20 weeks to 6.50, but due to the small AZ sample size this drop should be taken lightly. Mill lead times for plate are now at 4.33 weeks, up slightly from 4.20 in SMU’s previous check of the market.
When Will Lead Times Extend?
SMU asked buyers in this week’s poll: When do you expect mill lead times to begin extending again? Only 12% said lead times are still getting shorter, while 11% said they were extending already. About 41% of the respondents said lead times will soon extend. Another 26% don’t expect longer lead times until the second quarter, and 10% said not until the second half of 2022.
Here’s what a few survey respondents had to say:
“Most folks still have the luxury of sitting on the sidelines, but with demand being strong, that won’t be the case for much longer.”
“Supply-demand is still not in equilibrium. Until it is – status quo.”
“Panic buying due to the Russian invasion of Ukraine.”
“As demand starts to slowly increase, mills will find the mechanism to control production. Be it longer lead times or maintenance.”
“I believe we are at a turning point with destocking reaching almost a level when customers will start to reorder domestically and stretch lead times.”
Steel prices continue to decline each week; SMU’s weekly hot rolled coil index declined $20 to $1,000 per ton on Tuesday, down 49% from its peak last September.
Note: These lead times are based on the average from manufacturers and steel service centers who participated in this week’s SMU market trends analysis. SMU measures lead times as the time it takes from when an order is placed with the mill to when the order is processed and ready for shipping, not including delivery time to the buyer. Our lead times do not predict what any individual may get from any specific mill supplier. Look to your mill rep for actual lead times. To see an interactive history of our Steel Mill Lead Times data, visit our website here.
Negotiations
Buyers continue to hold the power position in price negotiations with the mills, a position they have enjoyed for the past three months as seen in the graphic below.
Every two weeks, Steel Market Update asks buyers: Are you finding the domestic mills willing to negotiate spot pricing on new orders placed this week? The vast majority of buyers in the flat-rolled categories tell SMU that mills are in a deal-making mode to secure sales, while plate buyers report a lessening in mills’ willingness to negotiate.
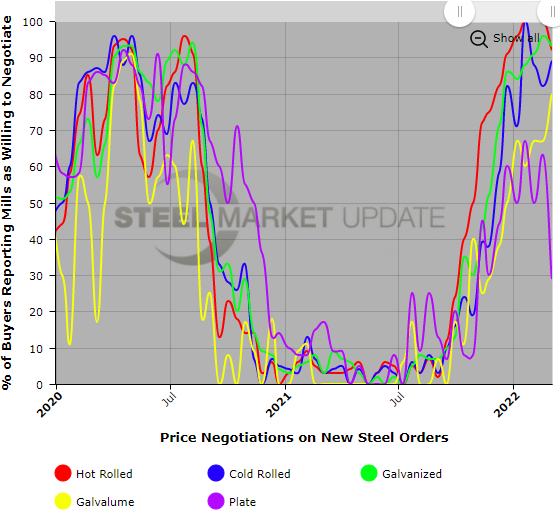
Like lead times, which can’t get much shorter, price negotiations can’t get much more one-sided. It won’t be until lead times begin to lengthen again and mills begin to say “no” again when customers ask for a discount that this data will signal a change in the direction of pricing.
Note: SMU surveys active steel buyers twice each month to gauge the willingness of their steel suppliers to negotiate pricing. The results reflect current steel demand and changing spot pricing trends. SMU provides our members with a number of ways to interact with current and historical data. To see an interactive history of our Steel Mill Negotiations data, visit our website here.
By Brett Linton, Brett@SteelMarketUpdate.com


