

Plate

April 22, 2022
February Import Share of US Sheet and Plate Markets
Written by David Schollaert
Imports of less expensive sheet and plate products continue to arrive at US ports, but at a slower pace. February marked only the second decrease in overall flat product imports in 10 months, according to Commerce Department data.
Imports’ share of the US sheet and plate products markets peaked in December, reaching their highest levels in the past 4-5 years. The trend was driven by the need for buyers to find relief from inflated steel prices in the US. As the market slowed at year-end, so did imports.
Imports’ share of total sheet product shipments into the US was 14.6% in February, down from its peak of 19.5% in January. Though domestic shipments were down 4.5%, the 4.9 percentage point drop was driven by a 33.1% decline in foreign sheet. The market share of plate product imports also fell in February to 20.3% from 25.8% the month prior.
February’s sheet products imports totaled 676,425 tons, down from 1.01 million tons in January, and the lowest total since April 2021.
Overall sheet product shipments (domestic shipments plus imports) were down 10.1% in February versus January. They totaled 4.647 million tons, and that lower figure was driven by a 333,962-ton decrease in foreign shipments. Hot-rolled coil (HRC) imports totaled 154,441 tons in February, down a whopping 46.4% versus the month prior. The details are below in Figure 1.
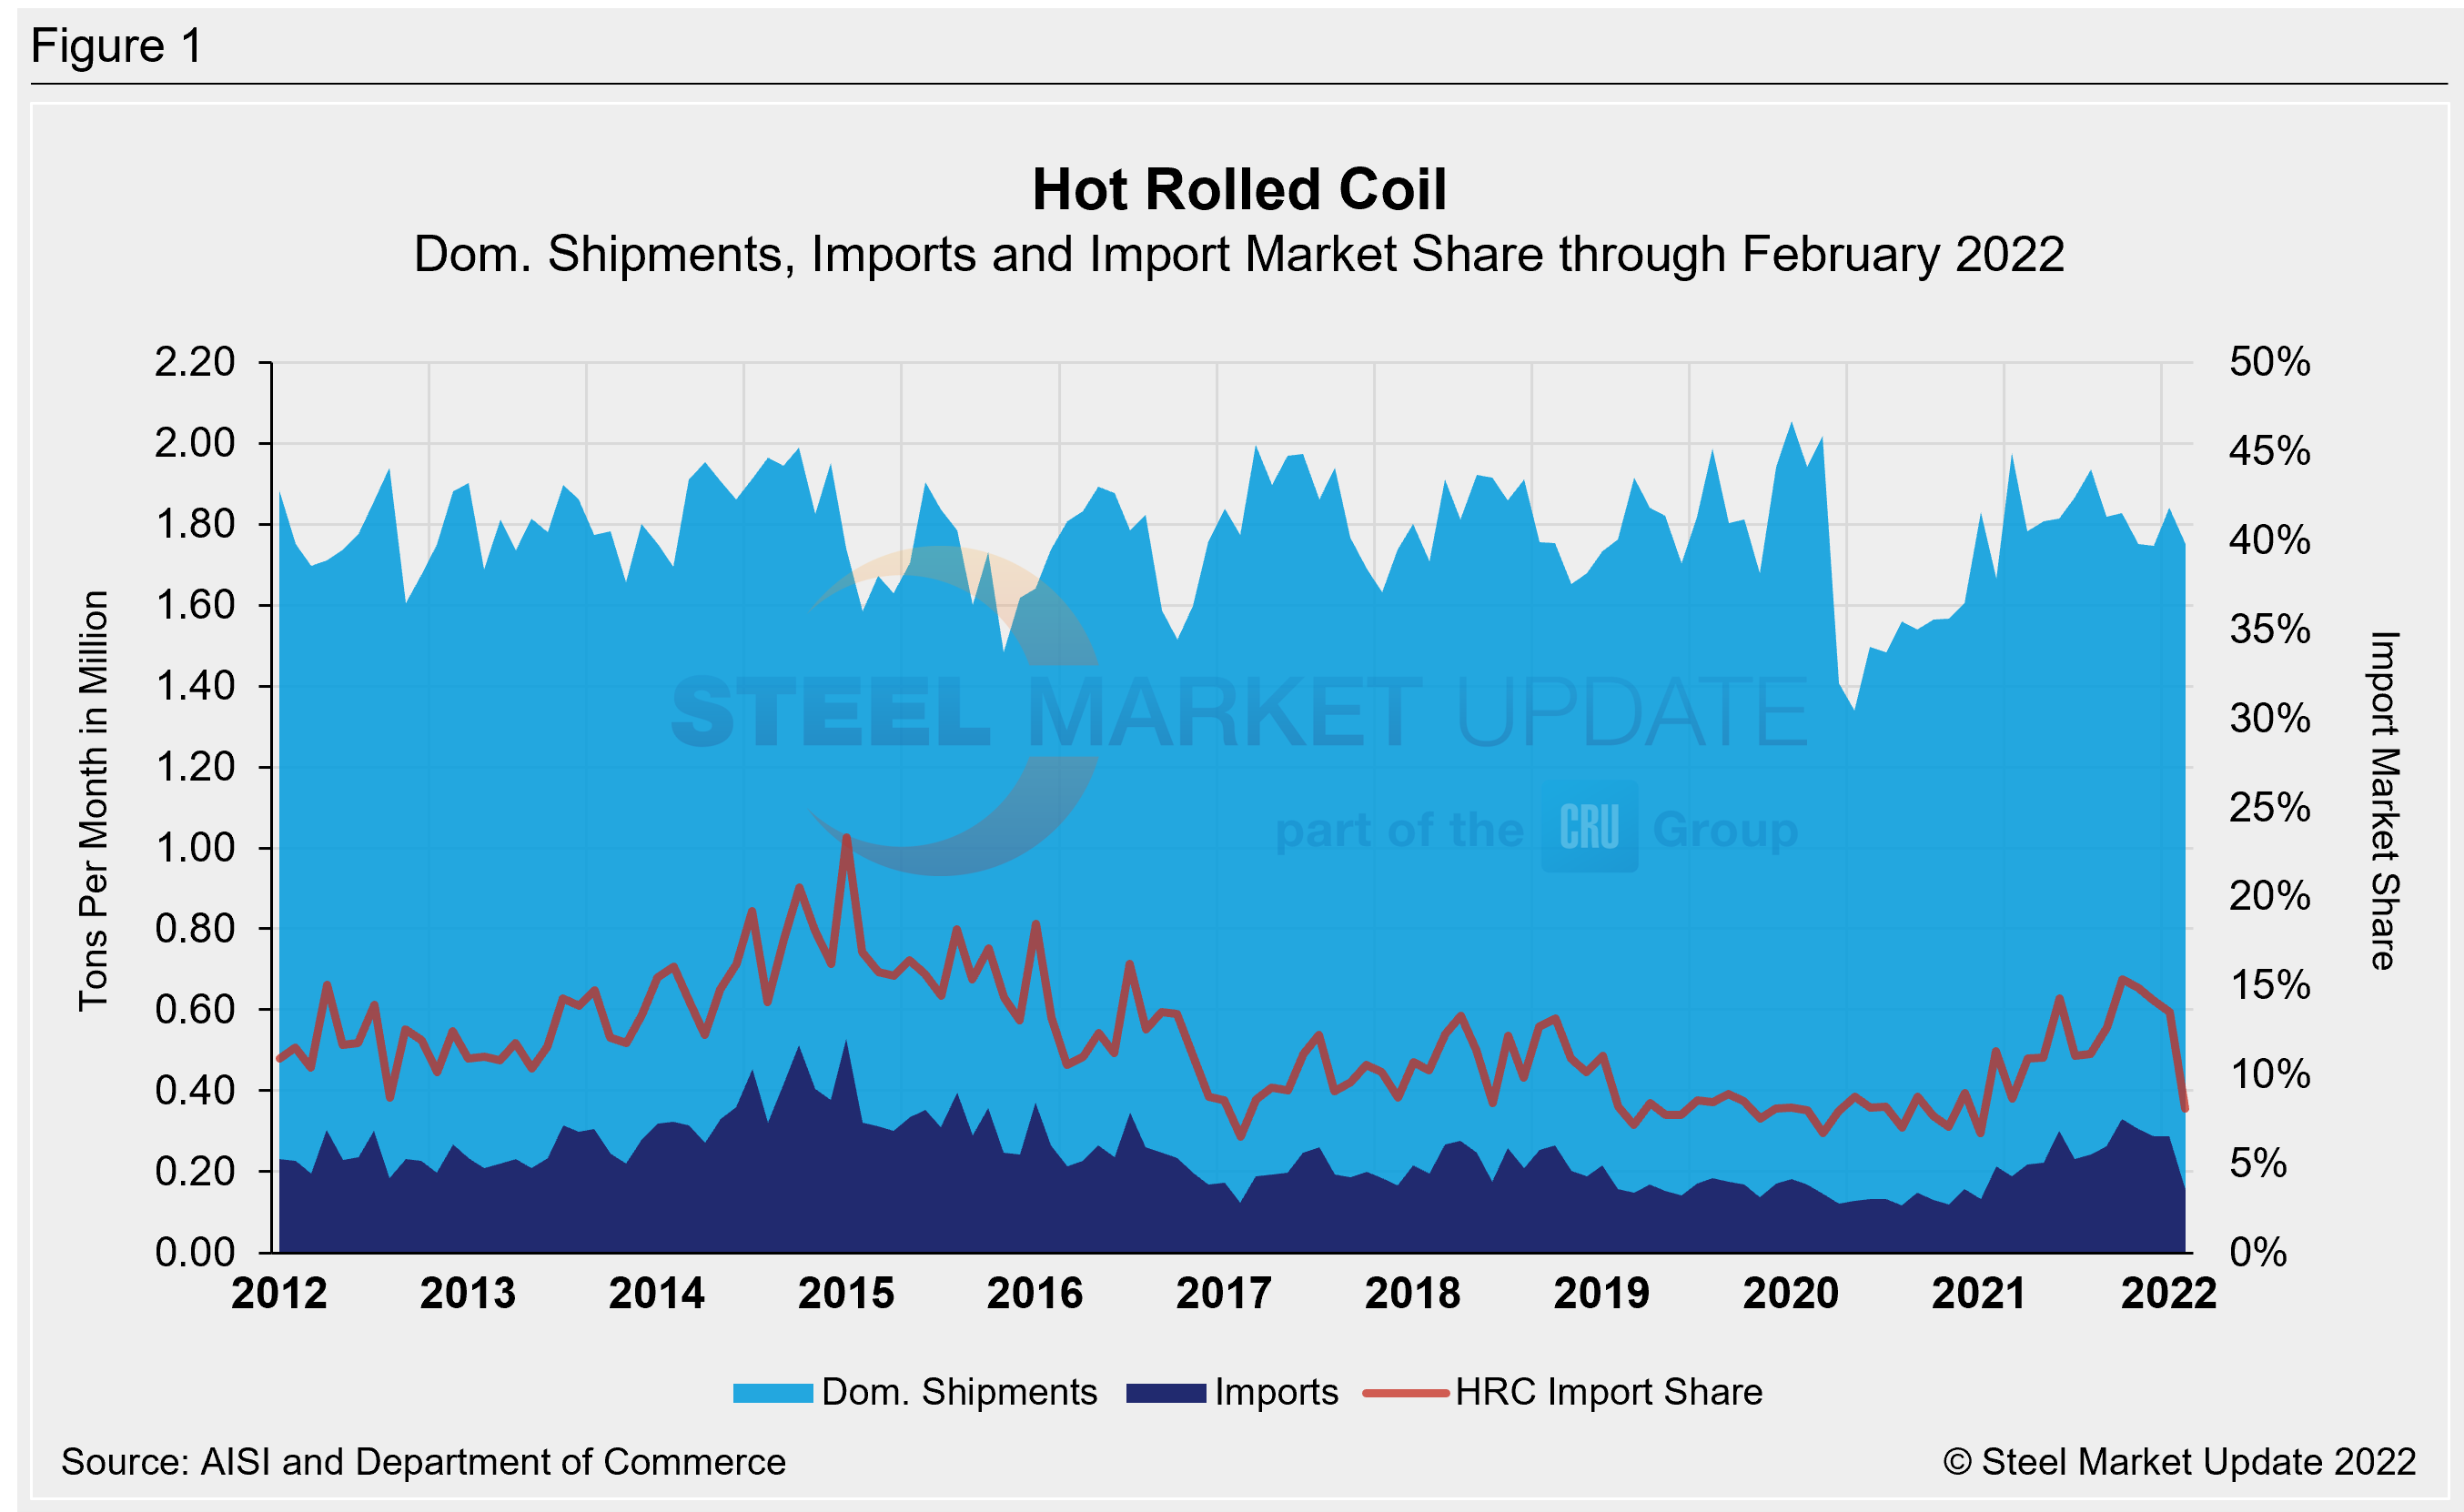
Plate products in February saw an overall decrease in shipments as apparent supply slipped by 10% month on month. The loss was driven by a decline of 29.1% in imports and 3.4% in domestic plate shipments. February plate imports of 124,583 tons were the lowest total in nearly a year. Foreign supply declined for the second straight month in February after peaking at 184,226 tons last December. All told, total plate shipments, including foreign and domestic, were 612,655 tons in February, down from 680,891 tons the month prior.
The import share of HRC fell 5.4 percentage points to 8.1% in February, the lowest mark since last March. The drop in share was driven by a 46.4% decrease in foreign material, while domestic shipments slipped just 4.9% month on month. HRC imports totaled 154,441 tons, the lowest total in more than a year.
Imports of cold-rolled coil (CRC), galvanized (hot dipped and electrolytic), and other metallic coat (OMC) were all down in February. Galvanized saw the biggest decline, down 31.1% MoM, followed by CRC (-24.3%), and OMC (-20.7%).
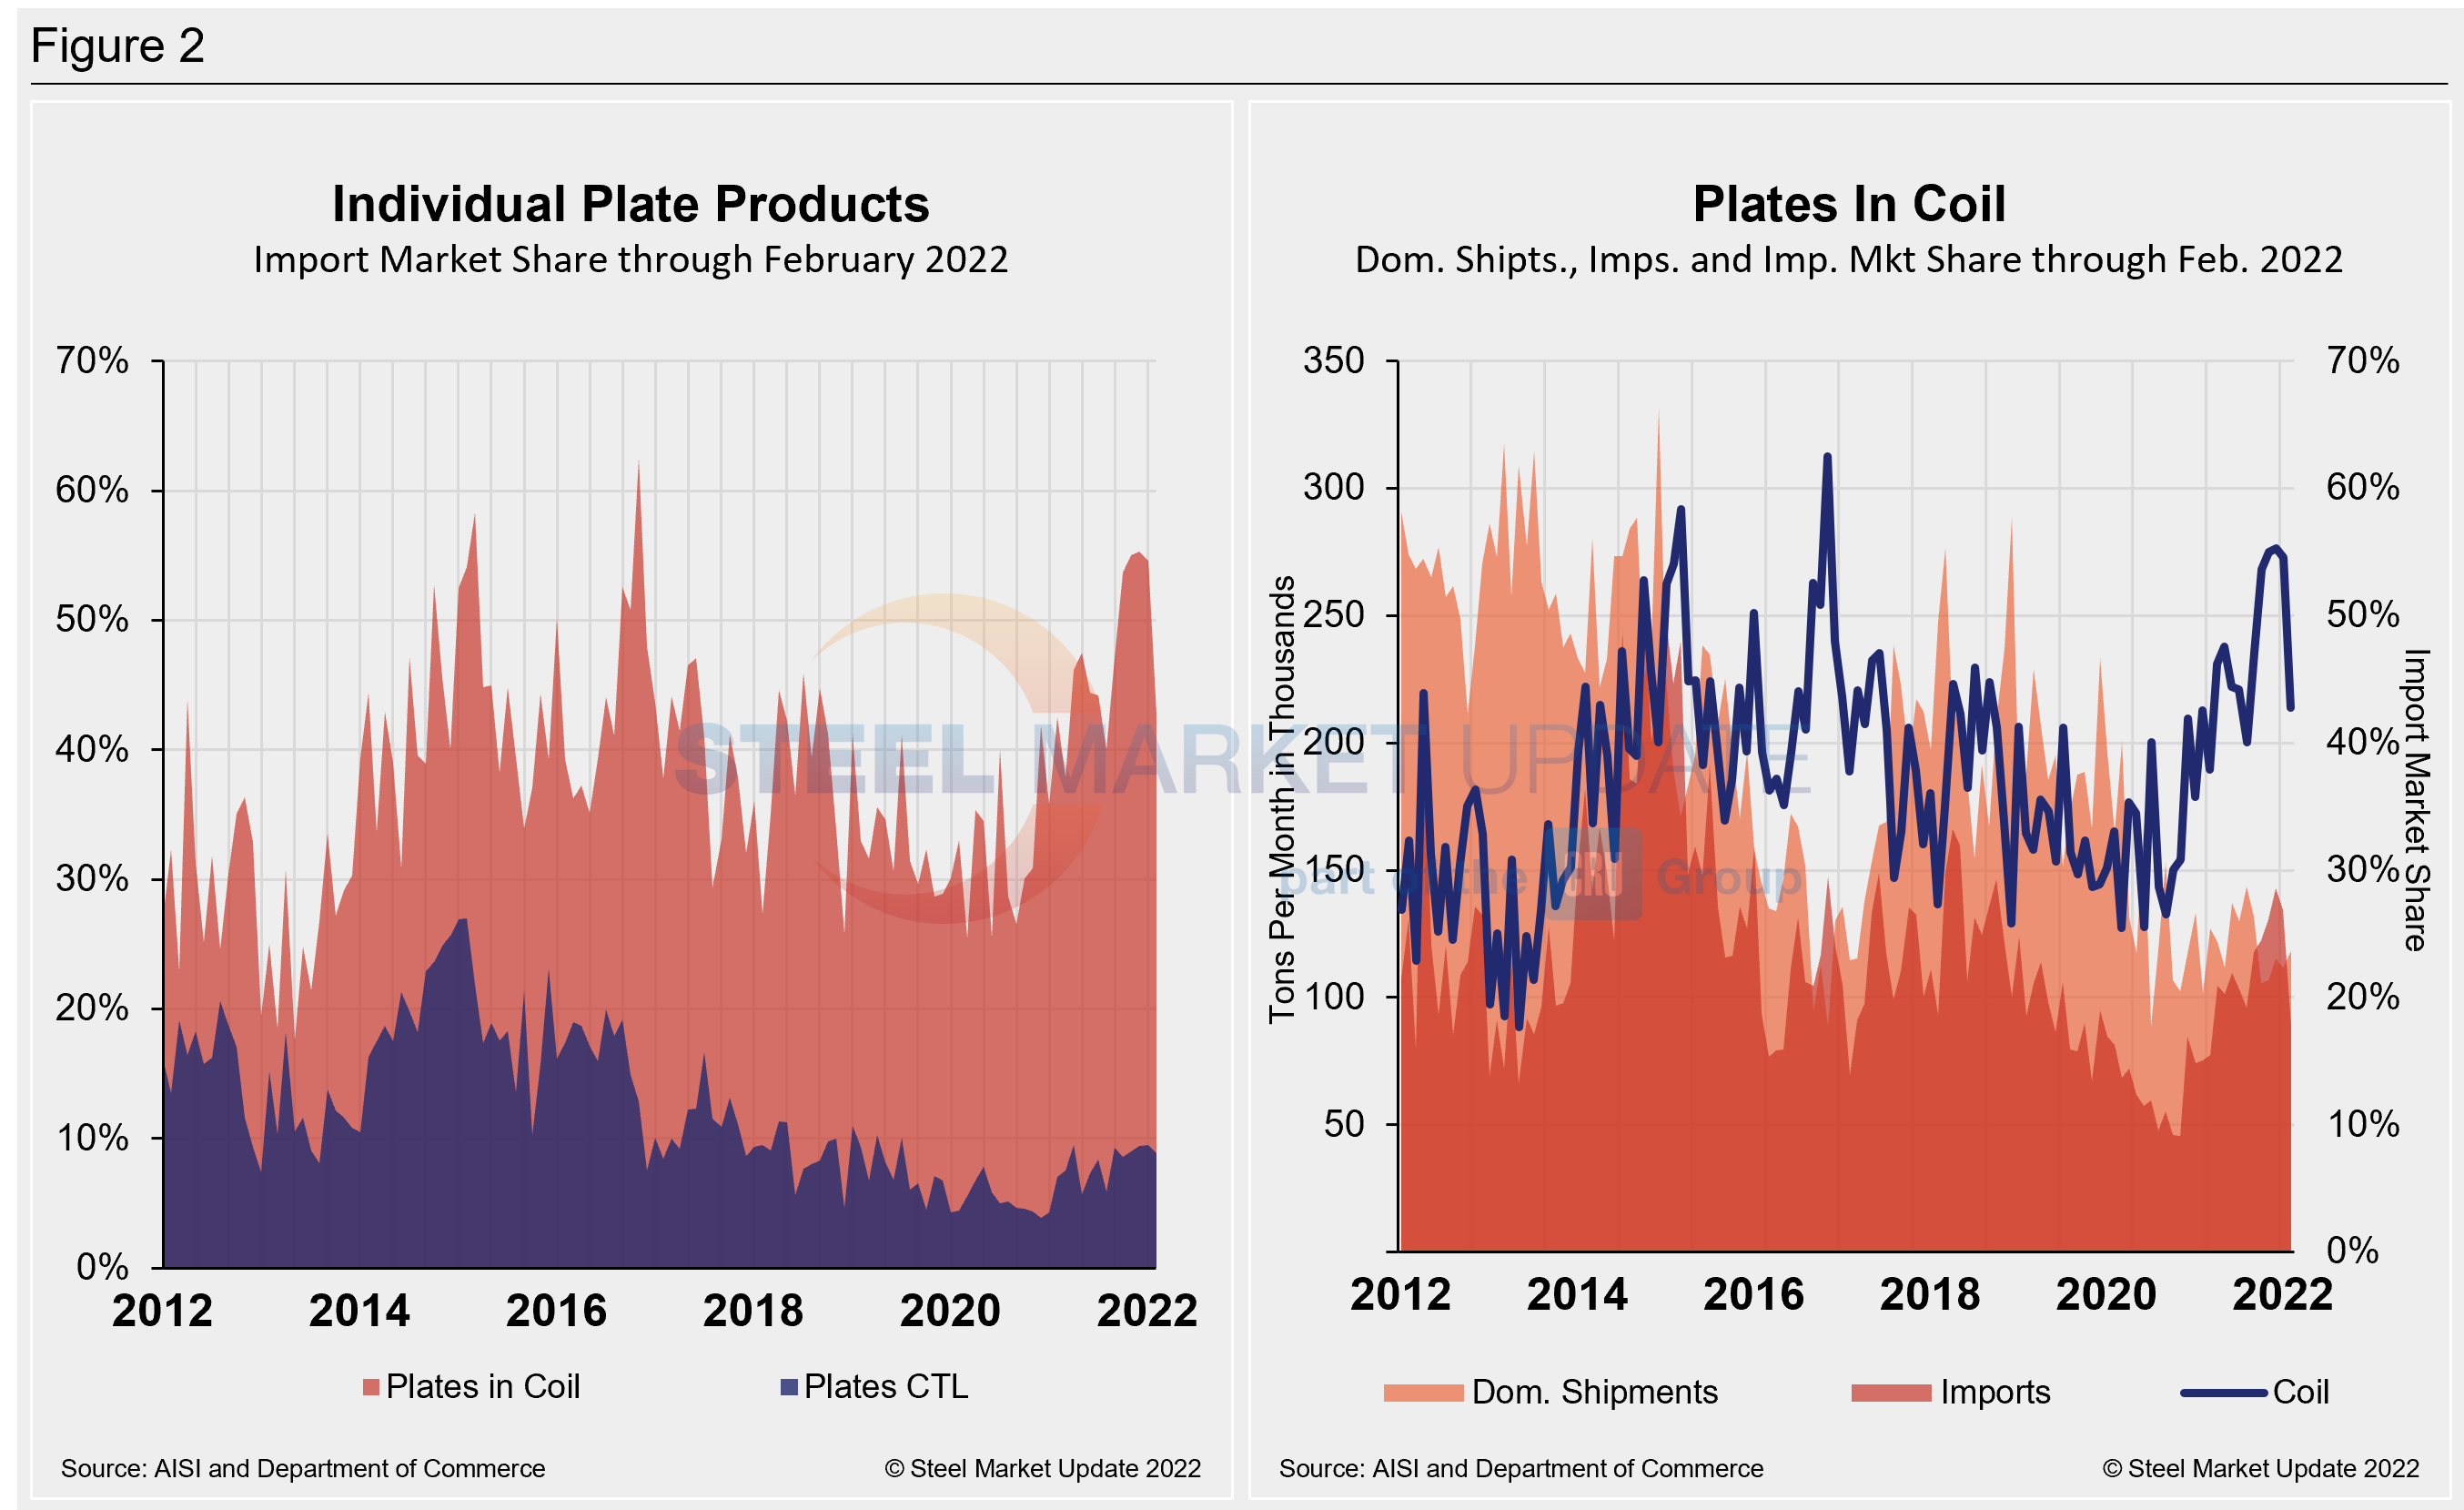
The import market share for plates in coil fell to 20.3% in February, a 5.5 percentage point decline month on month. The decrease was driven by a 29.1% decrease in total imports in February, while domestic shipments slipped 3.4% over the same period. Total imports of plates in coil were 88,468 tons in February, down from January’s 134,456 tons – the lowest mark since March 2021.
The table below displays the total supply to the market in three months and 12 months through February 2022 for sheet and plate products and six subcategories. Supply to the market is the total of domestic mill shipments plus imports. It shows imports on the same three- and 12-month basis and then calculates import market share for the two time periods for six products. Finally, it subtracts the 12-month share from the three-month share and color codes the resulting green or red according to gains or losses. If the result is positive, it means that the import share is increasing, and the code is red.
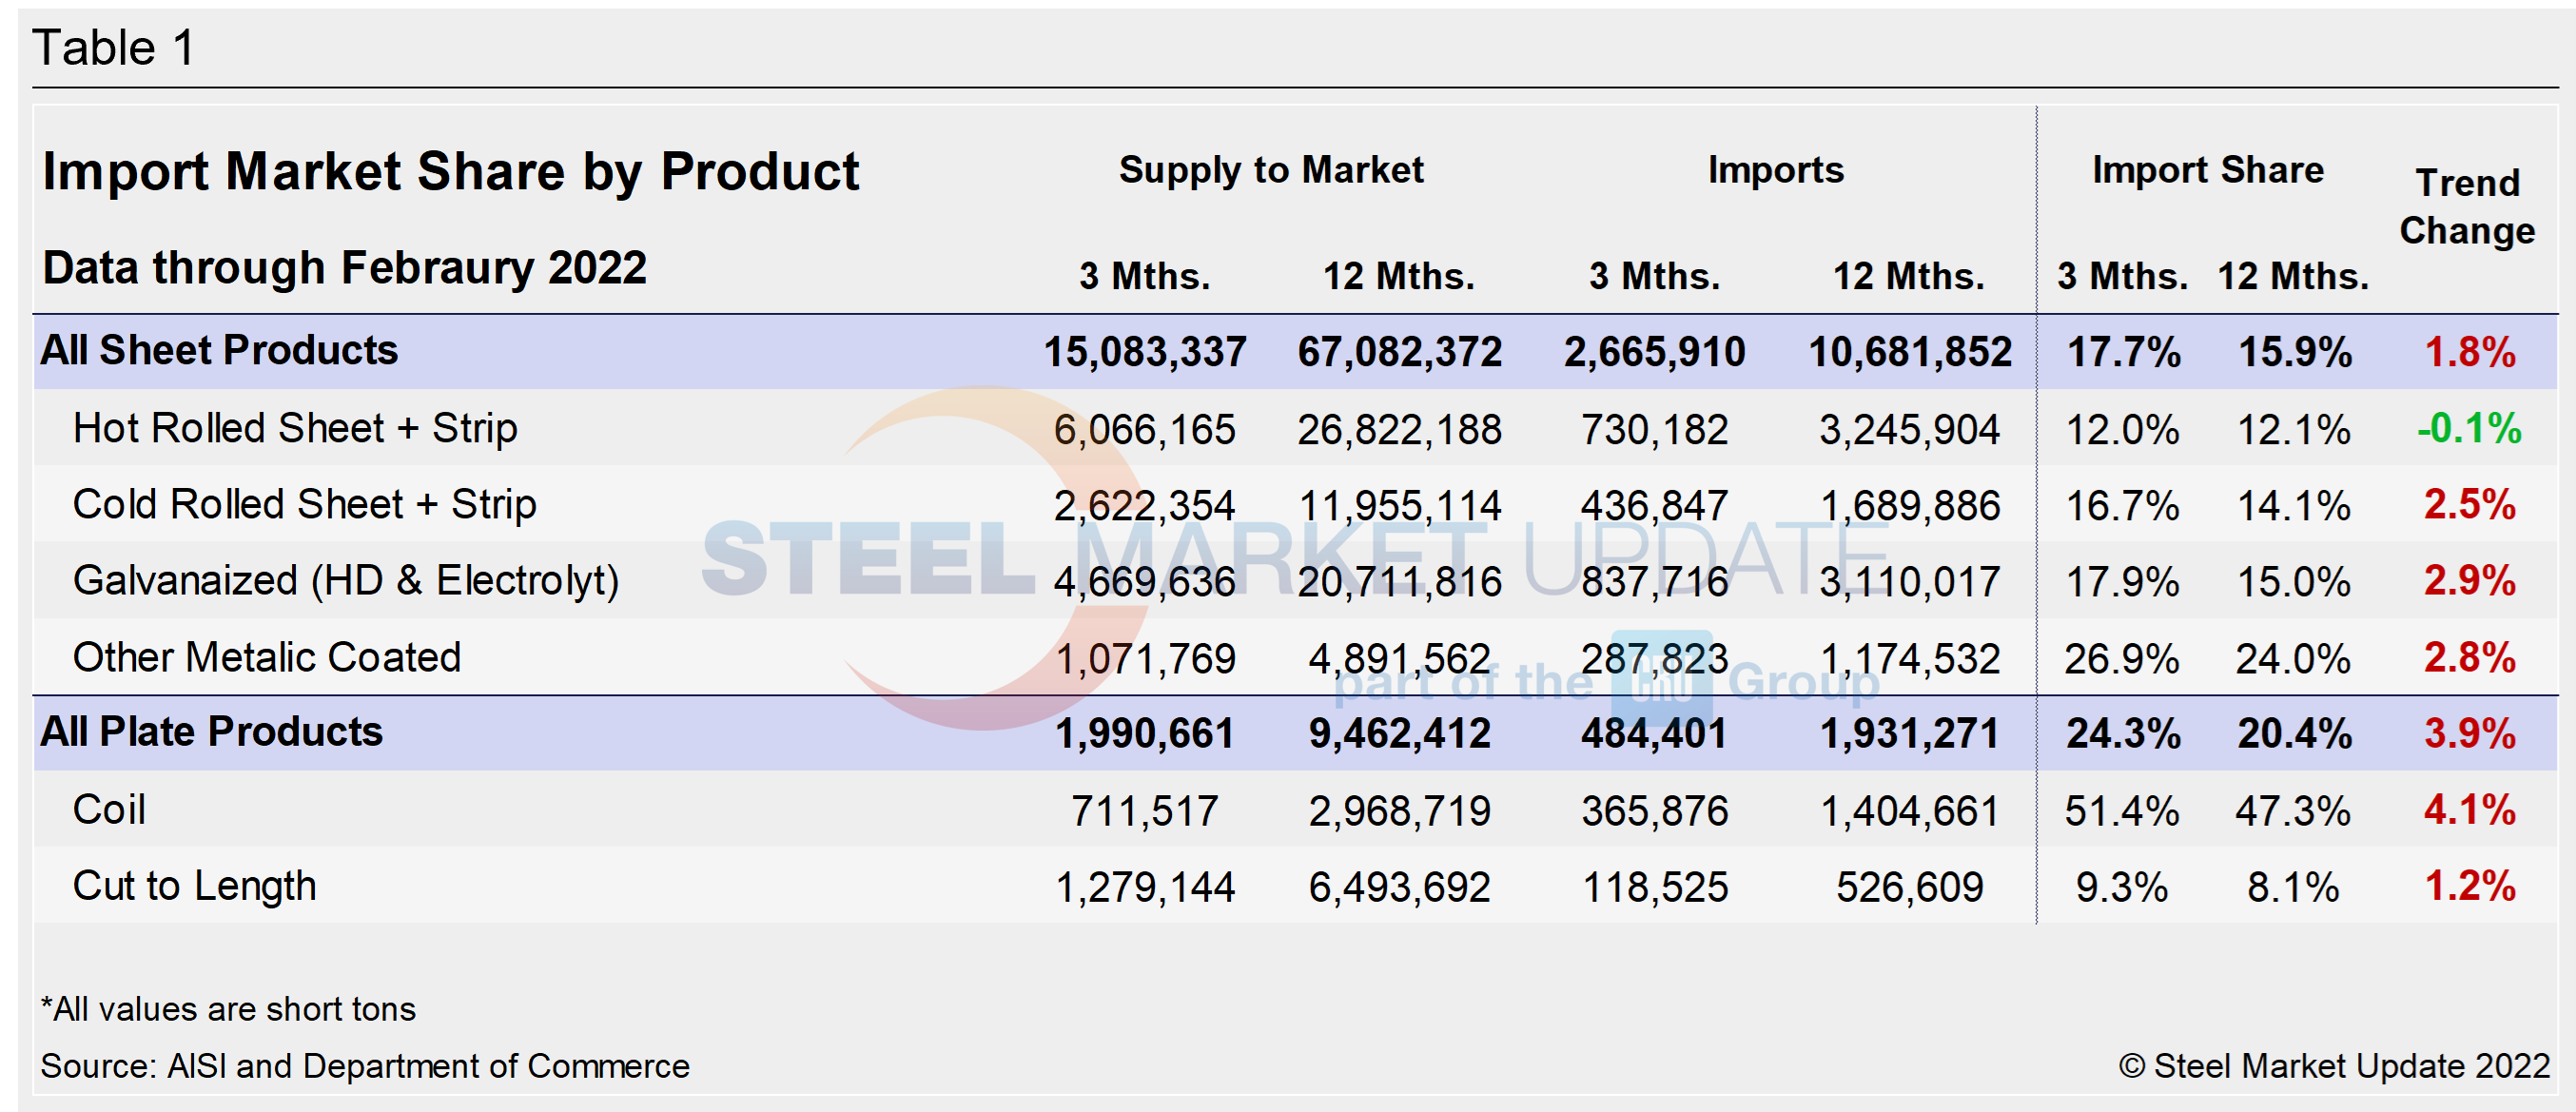
The big picture is that imports’ share of US sheet and plate sales, although down, remain high. The big second-half jump in total imports was the result of historically and disproportionately high domestic steel prices. The influx of foreign material has been declining, but it coincides with declining domestic shipments over the same period.
Hot-rolled and cold-rolled sheet and strip have seen a trend shift along with plate products, illustrating how import competition is impacting domestic products in three months compared to 12 months. The most notable of those subcategories is HRC showing a declining import market share through February.
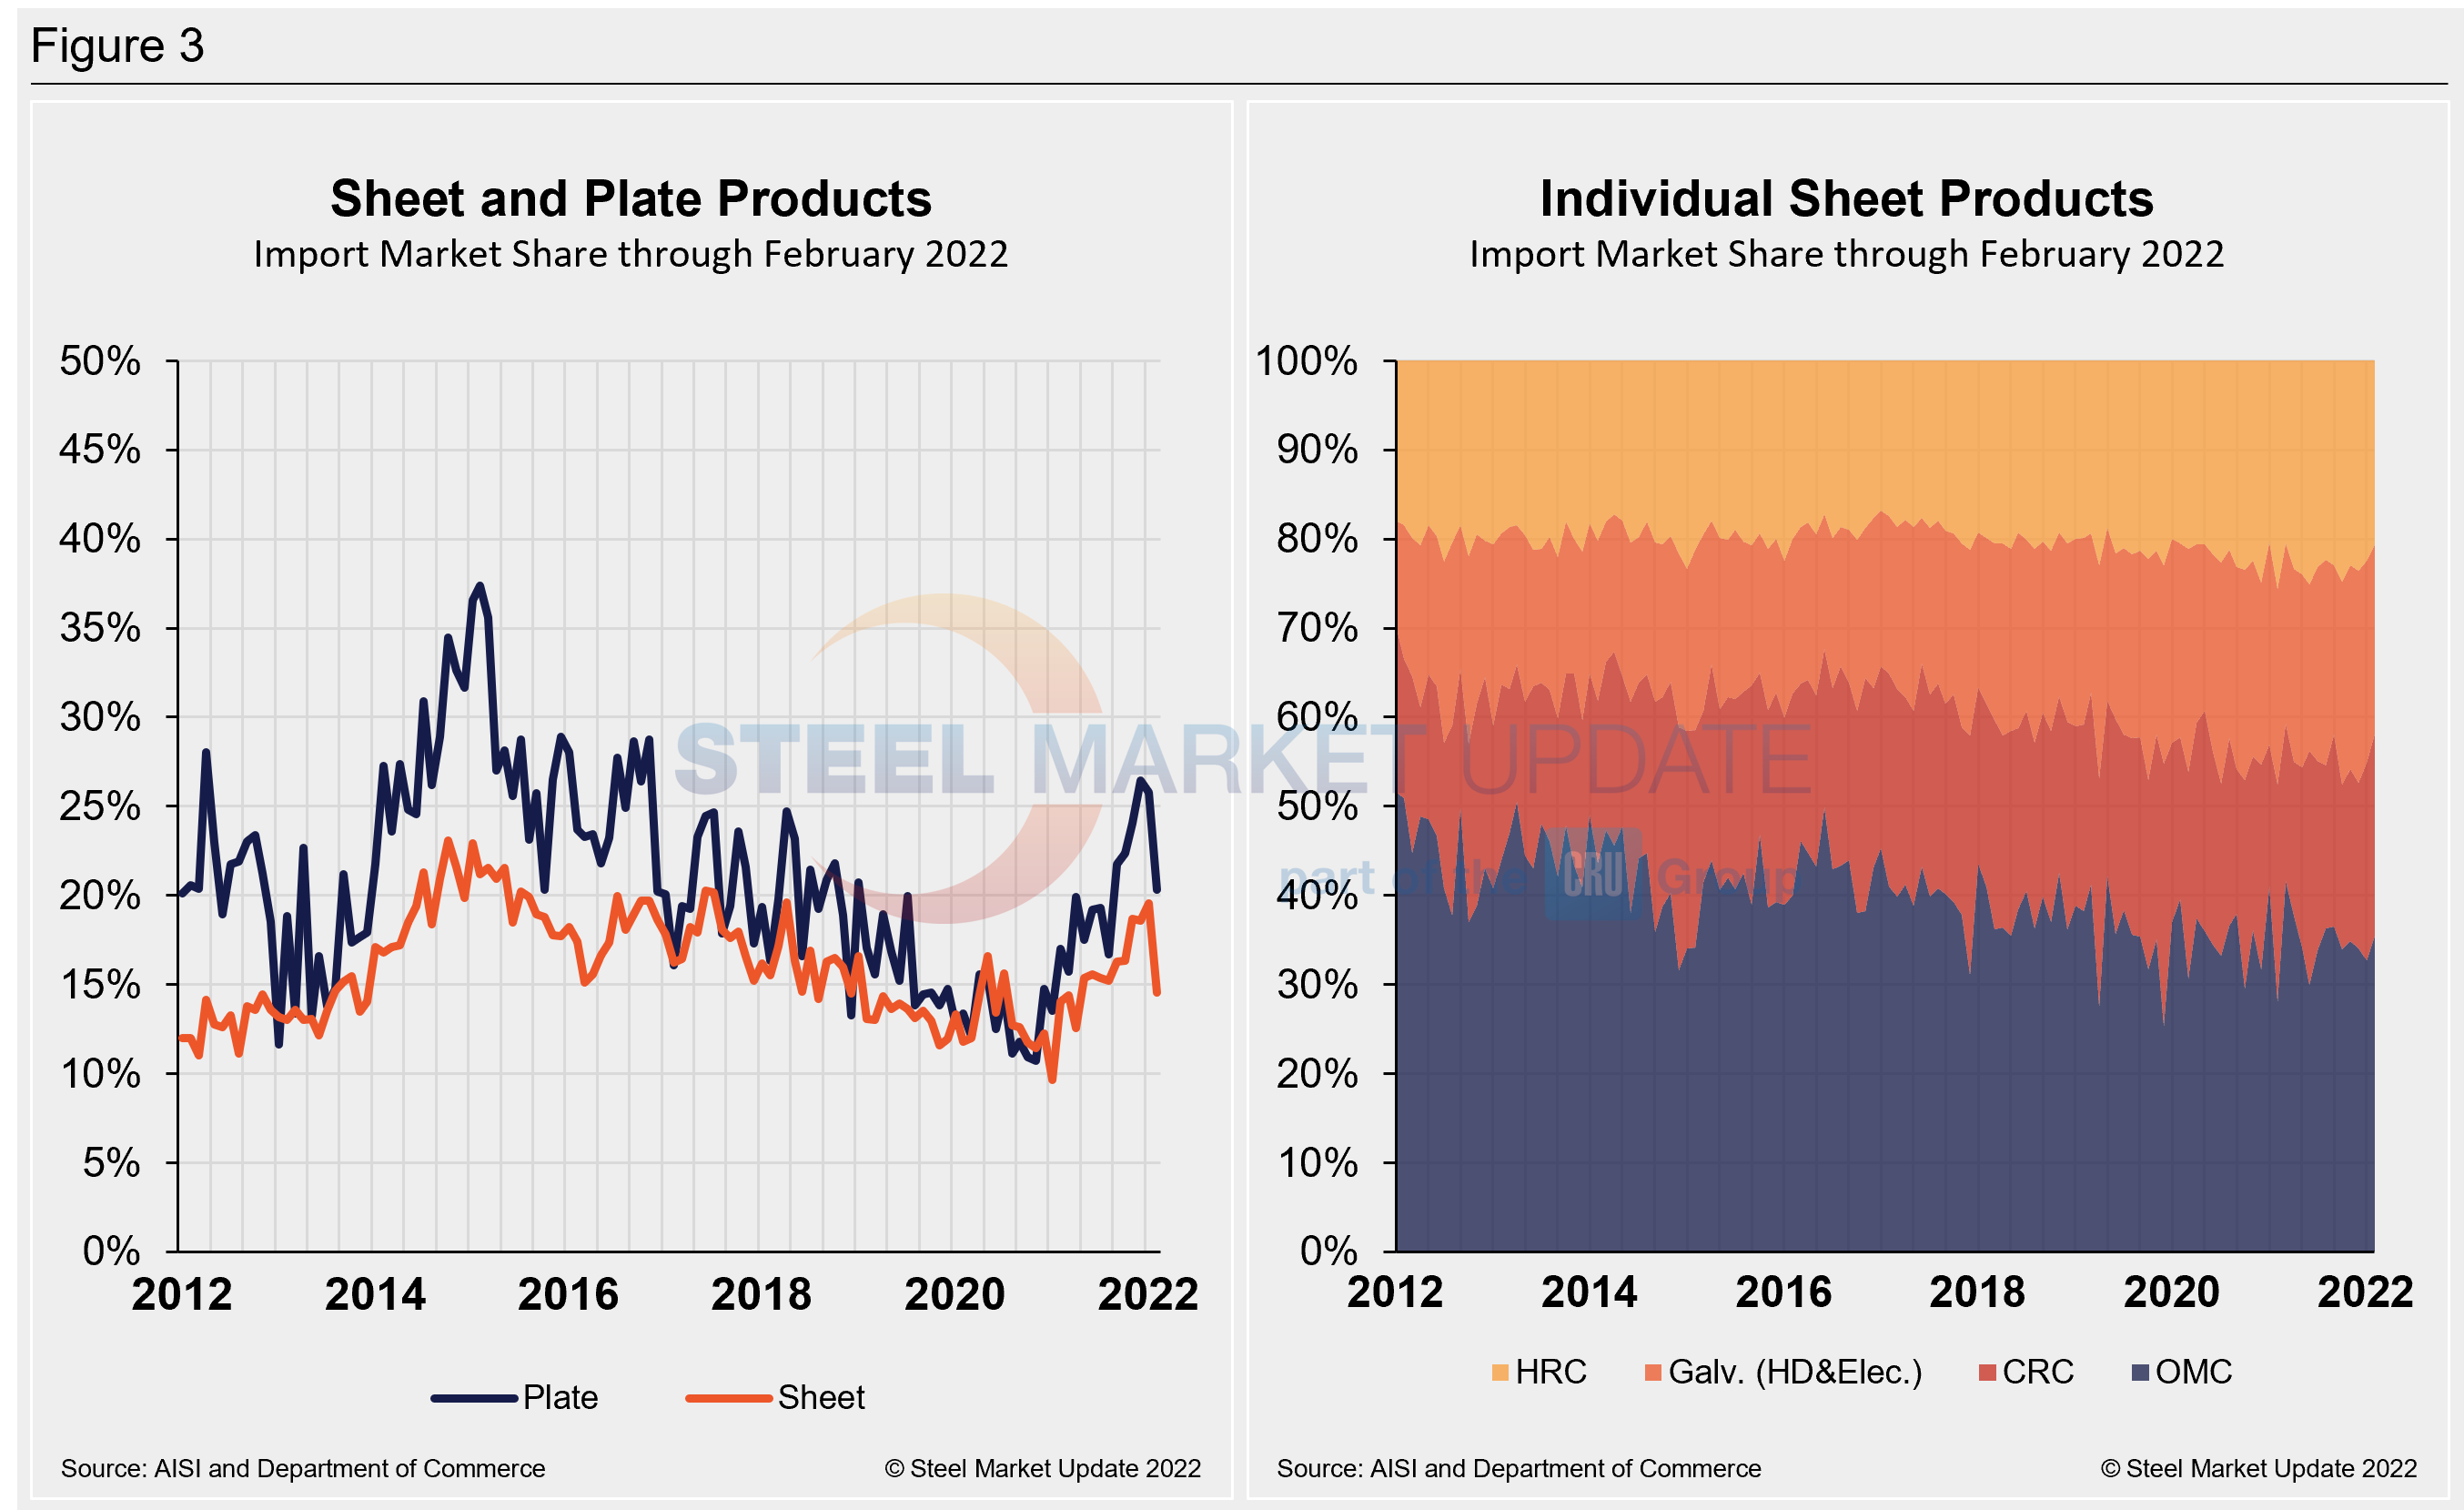
The import market share of individual plate products as well as a breakdown of the market share for plates in coil are displayed together in Figure 2. The historical import market share of plate and sheet products, and the import market share of the four major sheet products, are shown side-by-side in Figure 3.
By David Schollaert, David@SteelMarketUpdate.com

