

Market Data

July 24, 2022
SMU’s New Steel Demand Index at a 2-Year Low
Written by David Schollaert
Steel Market Update is pleased to share this new Premium content – an index comparing lead time and demand data – with Executive members. For information on upgrading to a Premium-level subscription, email Info@SteelMarketUpdate.com.
Apparent demand for flat-rolled steel in the US remains on a downward trend – as it has been since late April, according to SMU’s latest survey results.
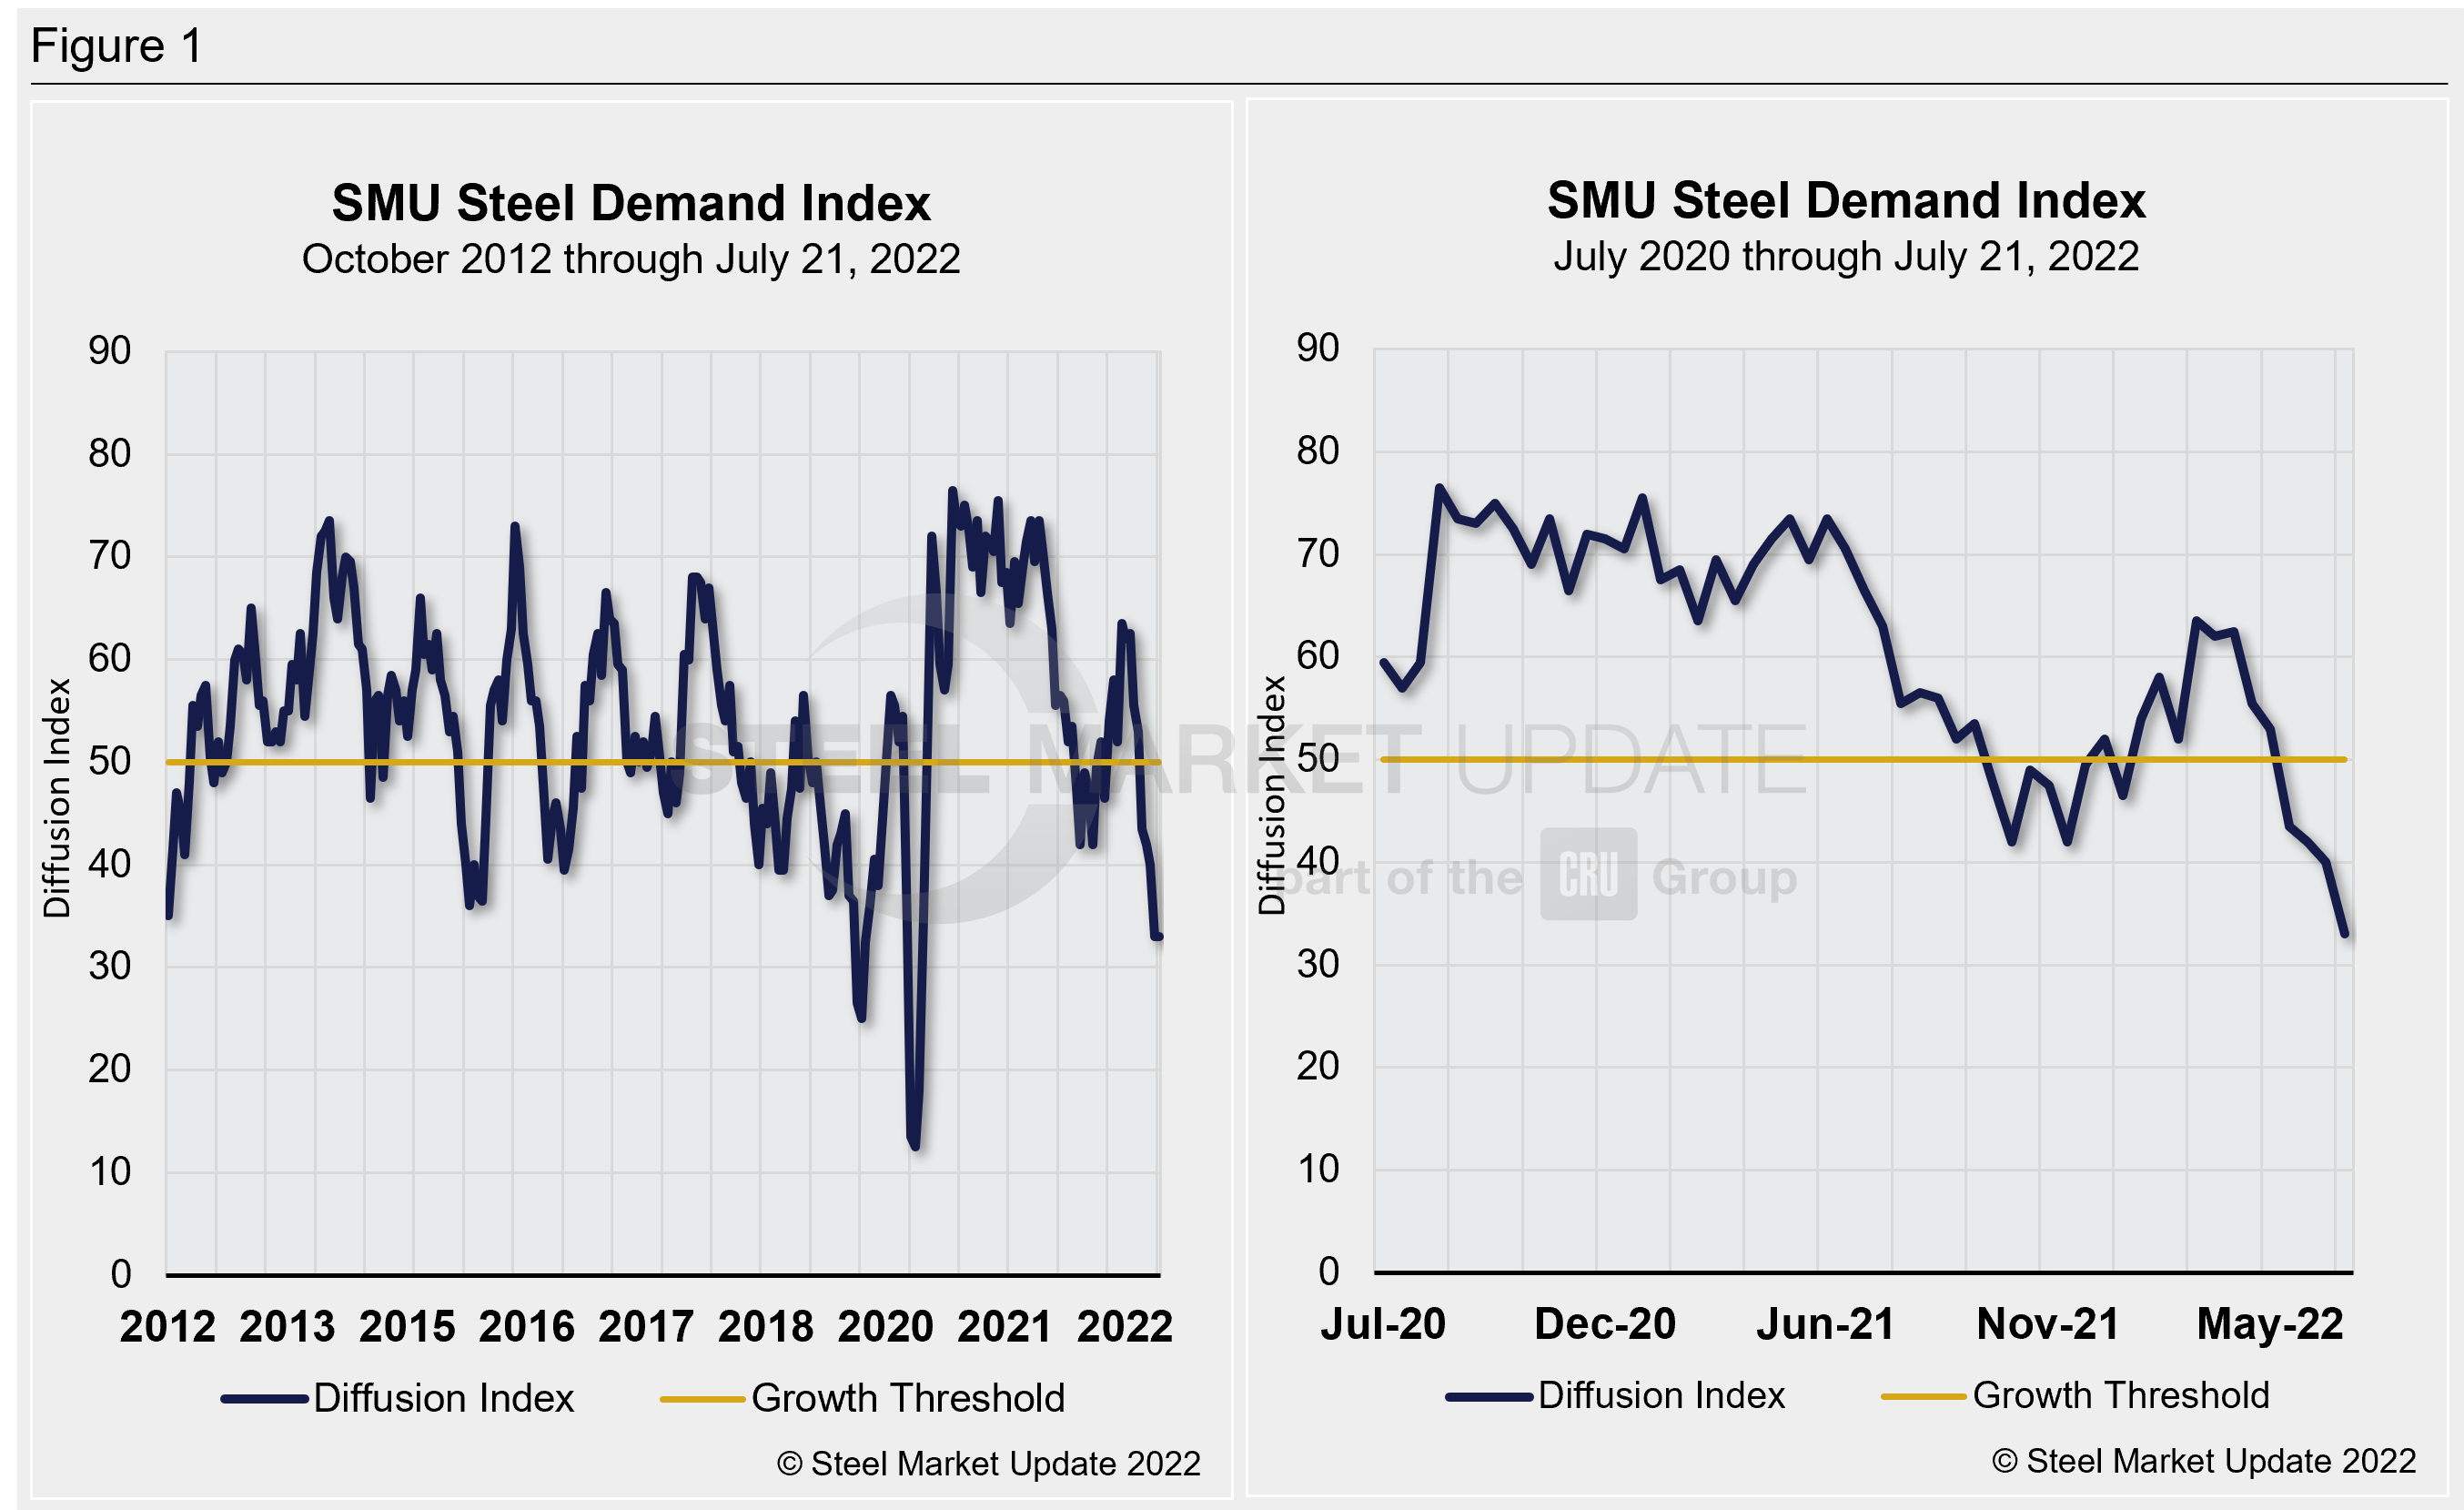
The Steel Market Update (SMU) Steel Demand Index, which compares lead times and demand, is a diffusion index derived from the SMU’s market surveys. We think it’s possible that this indicator might lead lead times. Recall that lead times are already considered to be a leading indicator of steel price moves.
An index score above 50 indicates an increase in demand, and a score below 50 indicates a decrease.
The latest demand index registered 33 on July 21, unchanged compared to a reading from July 7. (SMU sends out full surveys to the market every two weeks.) The result was down seven points from a month-ago and down more than 10 points from mid-May.
It’s the lowest reading since May 2020, when the economy and the steel industry were still reeling from the Covid-19 pandemic. Detailed side-by-side in Figure 1 are both the historical views and latest steel demand index.
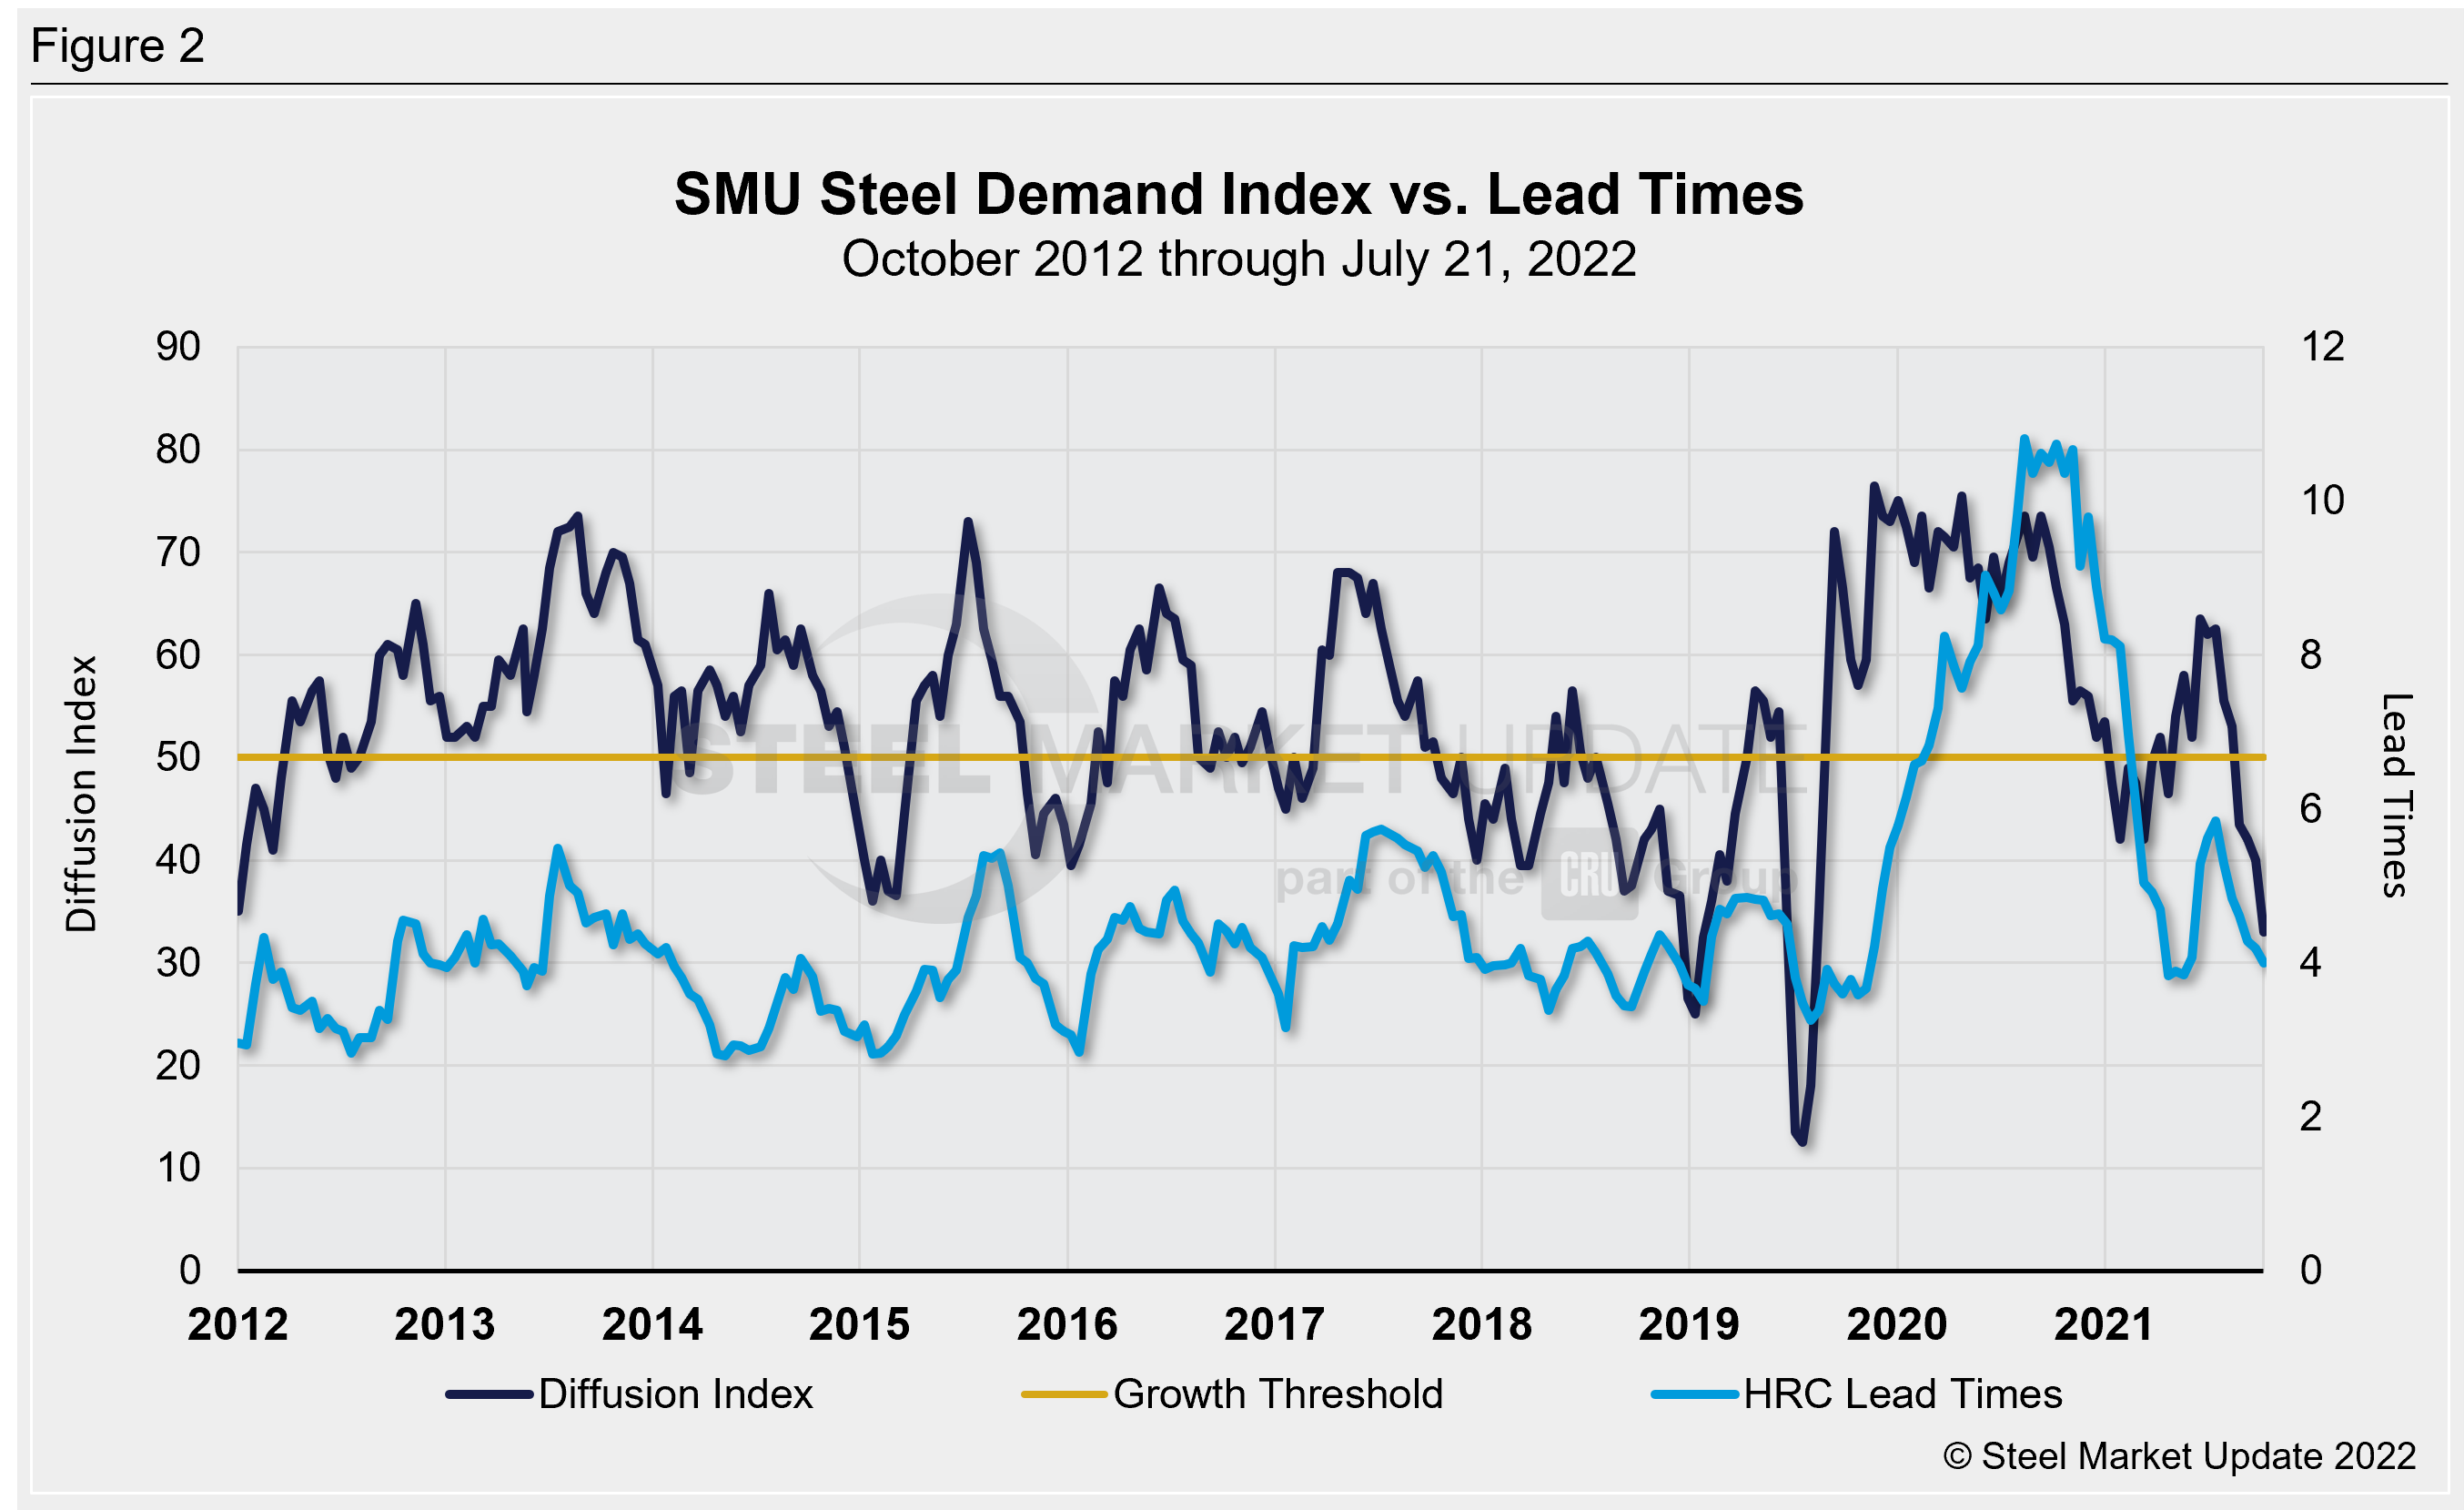
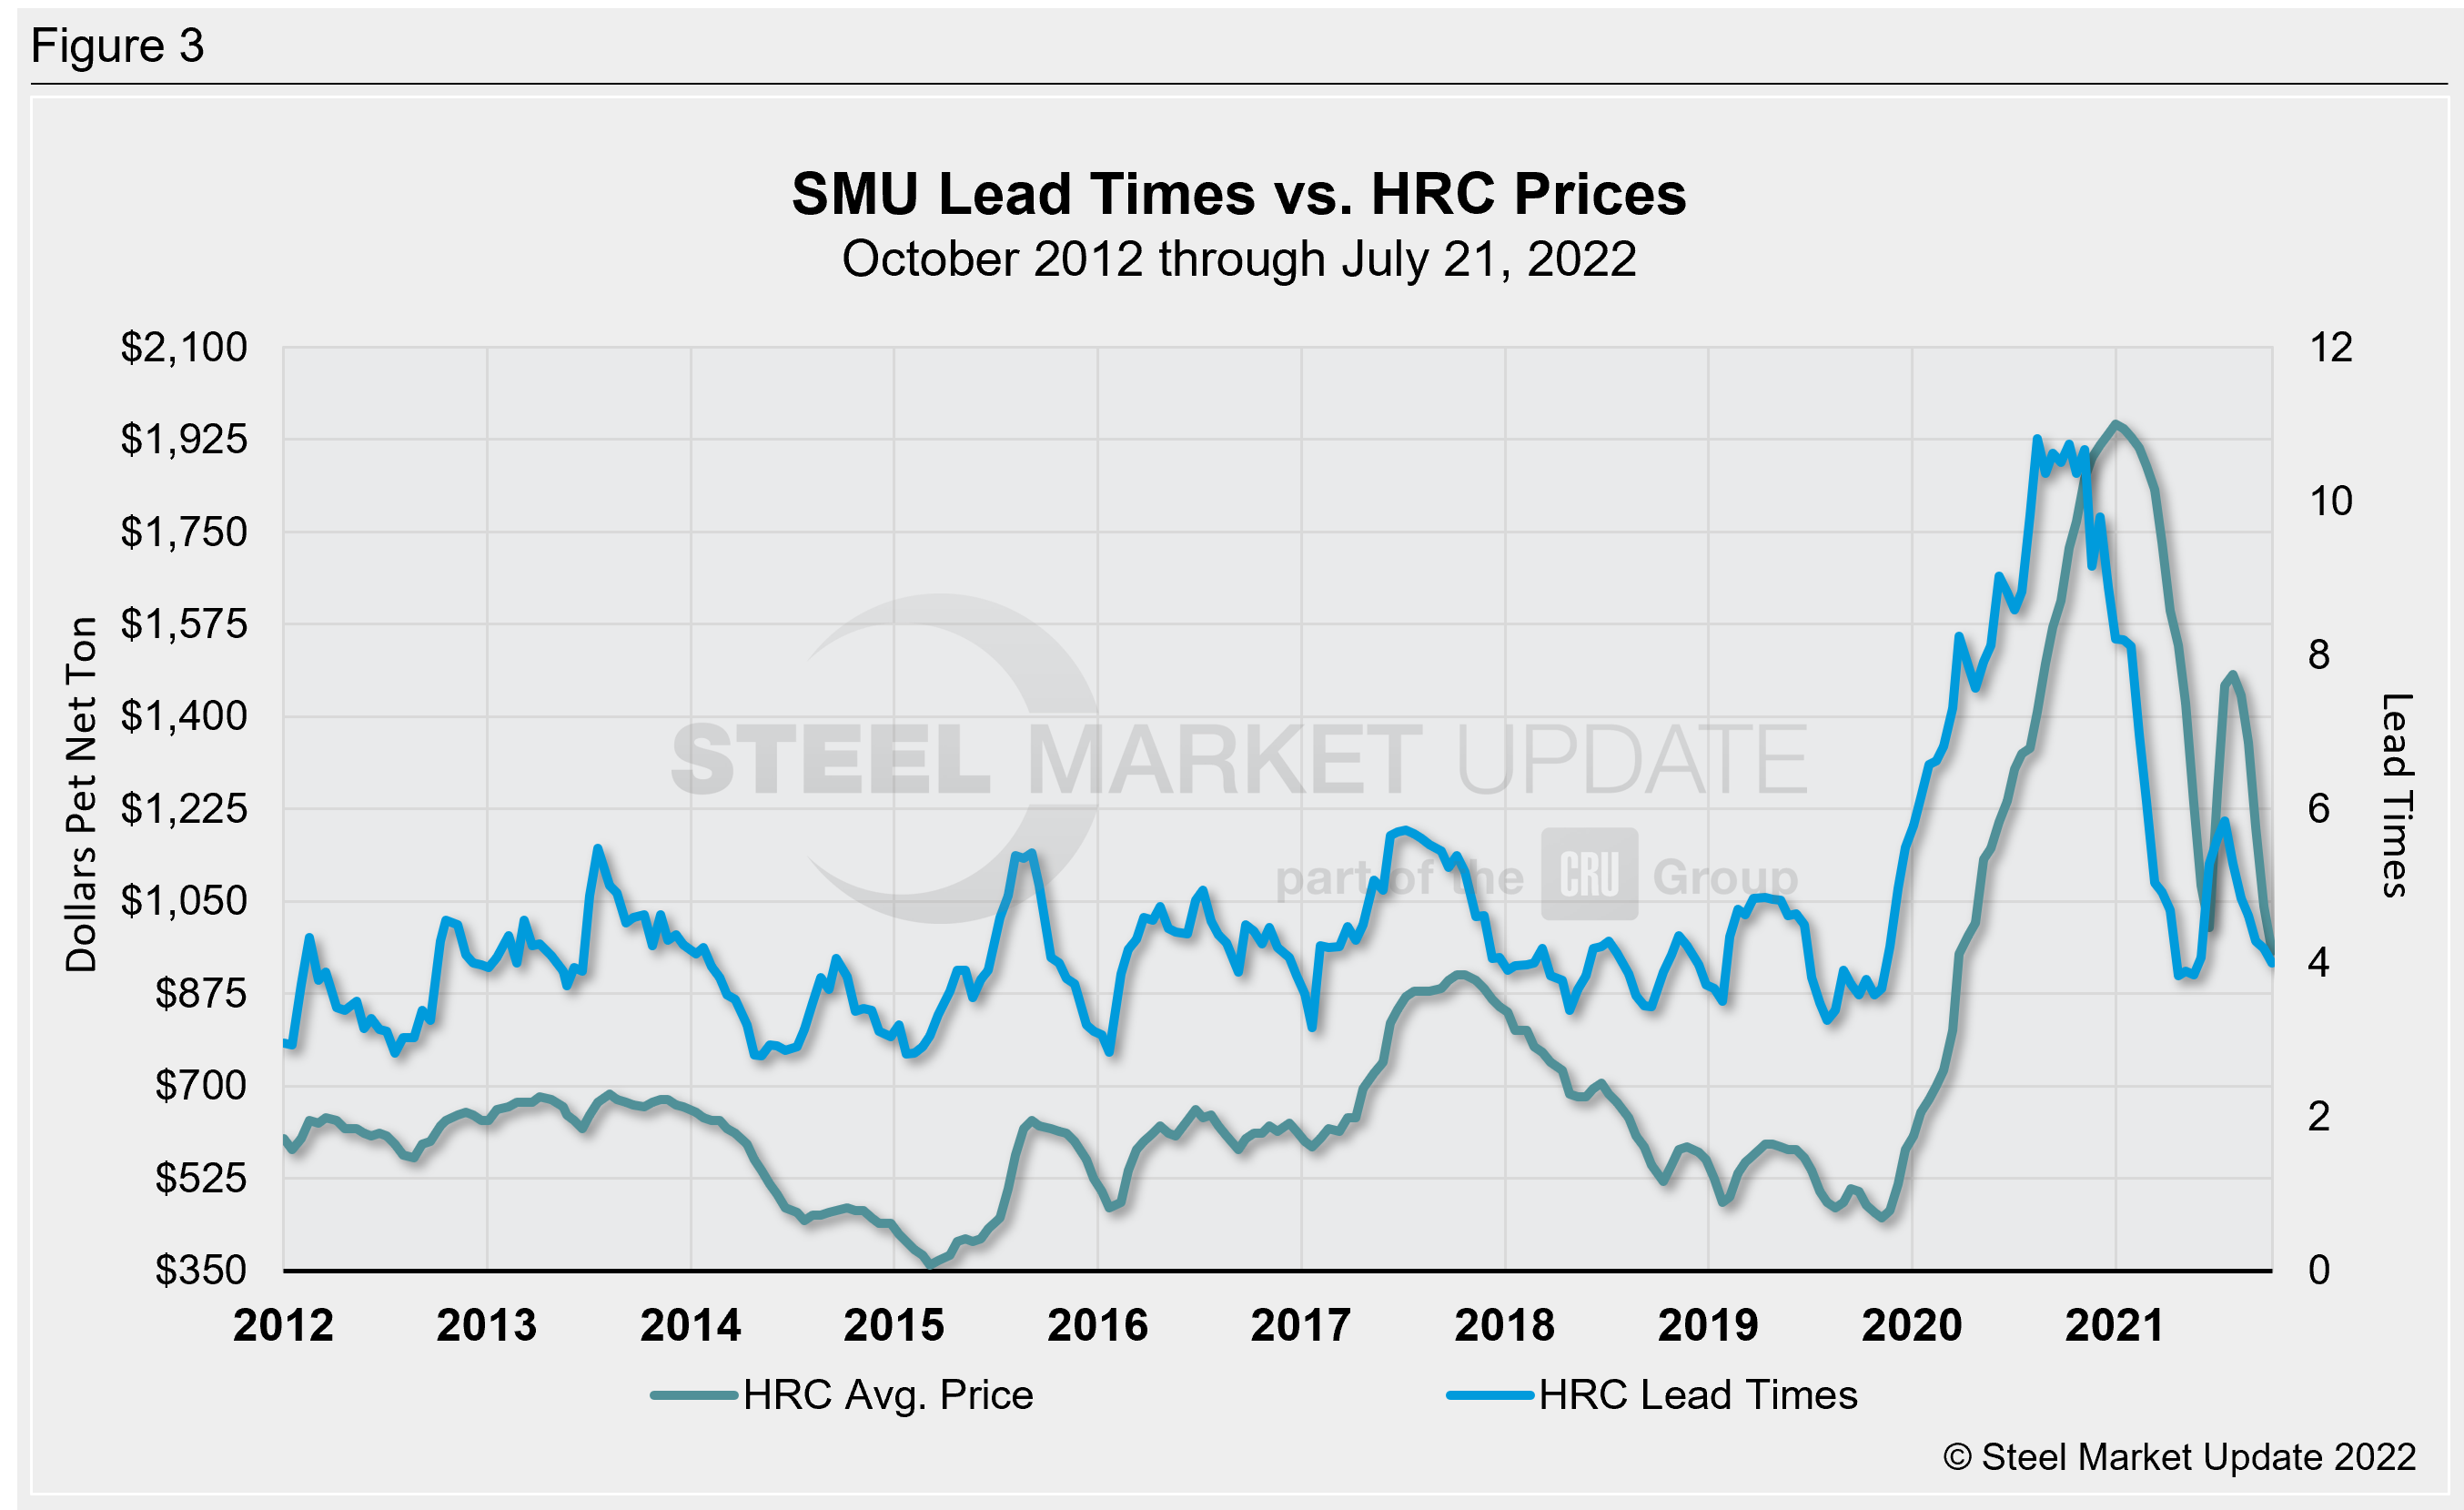
Steel buyers – mainly of OEMs and service centers – have reported sharply declining demand in July. A close analysis of SMU data over nearly a decade indicates that our steel demand diffusion index has consistently preceded steel mill lead times (Figure 2). Lead times have also historically been a leading indicator for flat-rolled steel prices, and hot-rolled coil (HRC) in particular (Figures 3).
SMU’s average hot rolled coil price now stands at $875 per ton ($43.75/cwt). Our overall average is down $35 per ton week on week.
Our hot rolled lead time averages 3.9 weeks, the first time it has been below 4 weeks since mid-February. The lowest hot rolled level this year was 3.8 weeks in January and in February. The record low in our ~11-year data history was 2.8 weeks in October 2016.
The takeaway: Mill executives report a healthy and steady steel demand. Roughly 40% of respondents to our surveys – largely OEM’s and service centers – continue to report declining sentiment. While a price floor might be in sight, our latest data suggest we aren’t there yet.
Note: Demand, lead times and prices are based on the average data from manufacturers and steel service centers who participate in SMU market trends analysis surveys. Our demand and lead times do not predict prices but are leading indicators of overall market dynamics and potential pricing dynamics. Look to your mill rep for actual lead times and prices.
By David Schollaert, David@SteelMarketUpdate.com


