

Market Data

September 22, 2022
SMU Steel Demand Index: Demand Slips, Still Lacking Direction
Written by David Schollaert
Steel Market Update is pleased to share this new, Premium content — an index comparing lead time and demand data — with Executive members. For information on upgrading to a Premium-level subscription, email Info@SteelMarketUpdate.com.
Apparent demand for flat-rolled steel in the US saw its sharpest decline since our early July reading when the index fell seven points. Declining market conditions have been noticeable across the sector over the past few weeks, though the direction remains unclear.
The recent ebb-and-flow in the index highlights the current state of flux in hot-rolled coil (HRC) prices and lead times, according to SMU’s latest survey results.
The lack of clarity across the market and the economy seems to be driving the state of indecision being felt in the industry, though most would agree that there is still significant downward pressure.
Sentiment has been a little up and down of late. Mills have been eager to set a price floor — particularly for HRC — though they remain rather willing to negotiate. Spreads in some cases remain at historic levels, although cold rolled, galvanized and Galvalume have been trying to catch up as of late.
And the economy is still giving no indication of where we’re going. Though the unemployment rate remains near most recent lows and August’s job report was again a pleasant surprise, headwinds are just as notable. Second quarter gross domestic product fell to a -0.6% annualized pace and inflation is running at a 40-year high with no sign of slowing down.
The Fed just delivered a third big rate increase on Wednesday and projected a more aggressive path ahead for monetary policy, one that would lift interest rates higher and keep them elevated longer.
The latest increase, a gain of three-quarters of a percentage point, boosted it to a range of 3% to 3.25%, and could reach 4.4% by the end of the year.
These economic dynamics seem to be mirrored rather closely by the flat-rolled steel market.
Our demand index has ebbed and flowed over the summer months. In July the reading was mostly stable after falling seven points to start the month. August’s results gained some ground while September has been declining.
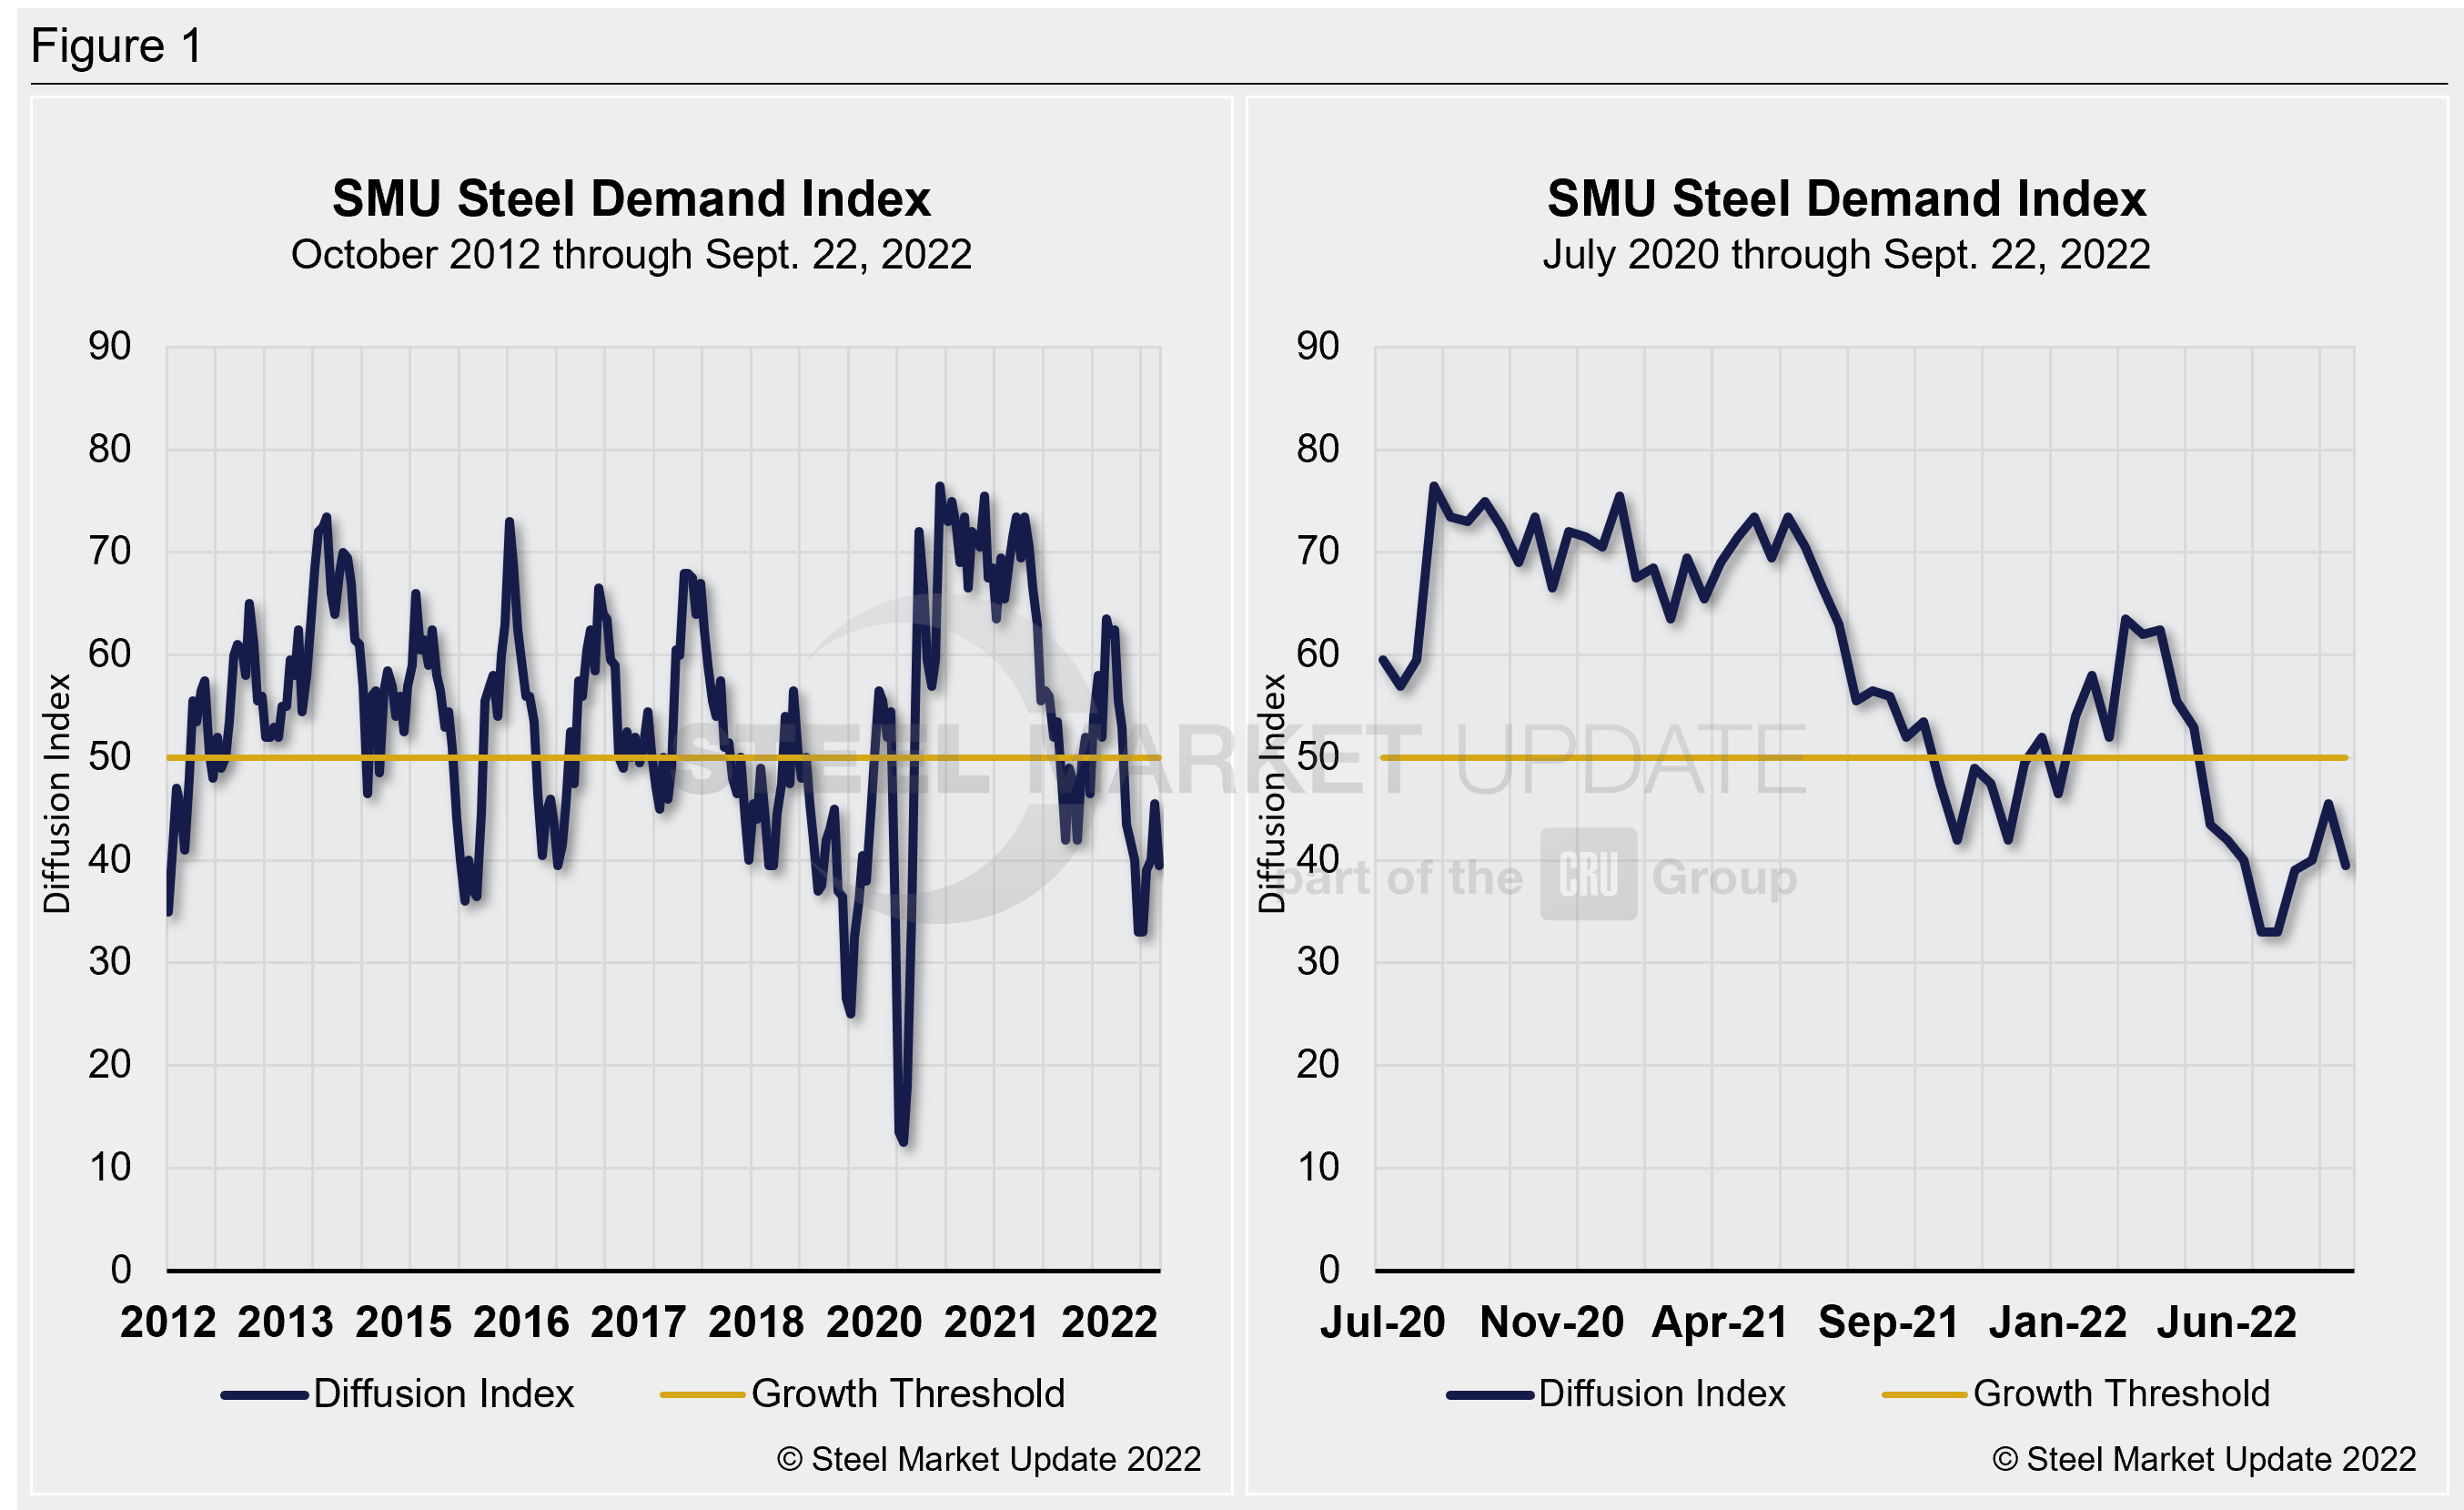
SMU’s Steel Demand Index, which compares lead times and demand, is a diffusion index derived from our market surveys. This index continues to precede lead times, which is notable given that lead times are typically a leading indicator of steel price moves.
An index score above 50 indicates an increase in demand and a score below 50 indicates a decrease.
The latest demand index registered 39.5 through Sept. 22, down 6.5 points versus the previous reading on Aug. 18. (SMU sends out full surveys to the market every two weeks.) The decline has been telling, as prices have since followed, continuing to underscore a weakening market that is still reporting down demand.
The result is just 6.5 points from the low of 33 seen in late July and the lowest reading since 2020. The latest score is down 13.5 points from mid-May — the last time the index was above 50. Detailed side-by-side in Figure 1 are both the historical views and the latest steel demand index.
Steel buyers — mainly OEMs and service centers — are still reporting weakening demand in September, a result that maybe has been compounded by a traditional summer slowdown.
The apparent lack of direction could be around for a bit more. While demand is down and there is little spot buying taking place, mills are scaling back production, working through maintenance outages, and initiating idlings. These dynamics could keep the market in a holding pattern for the time being.
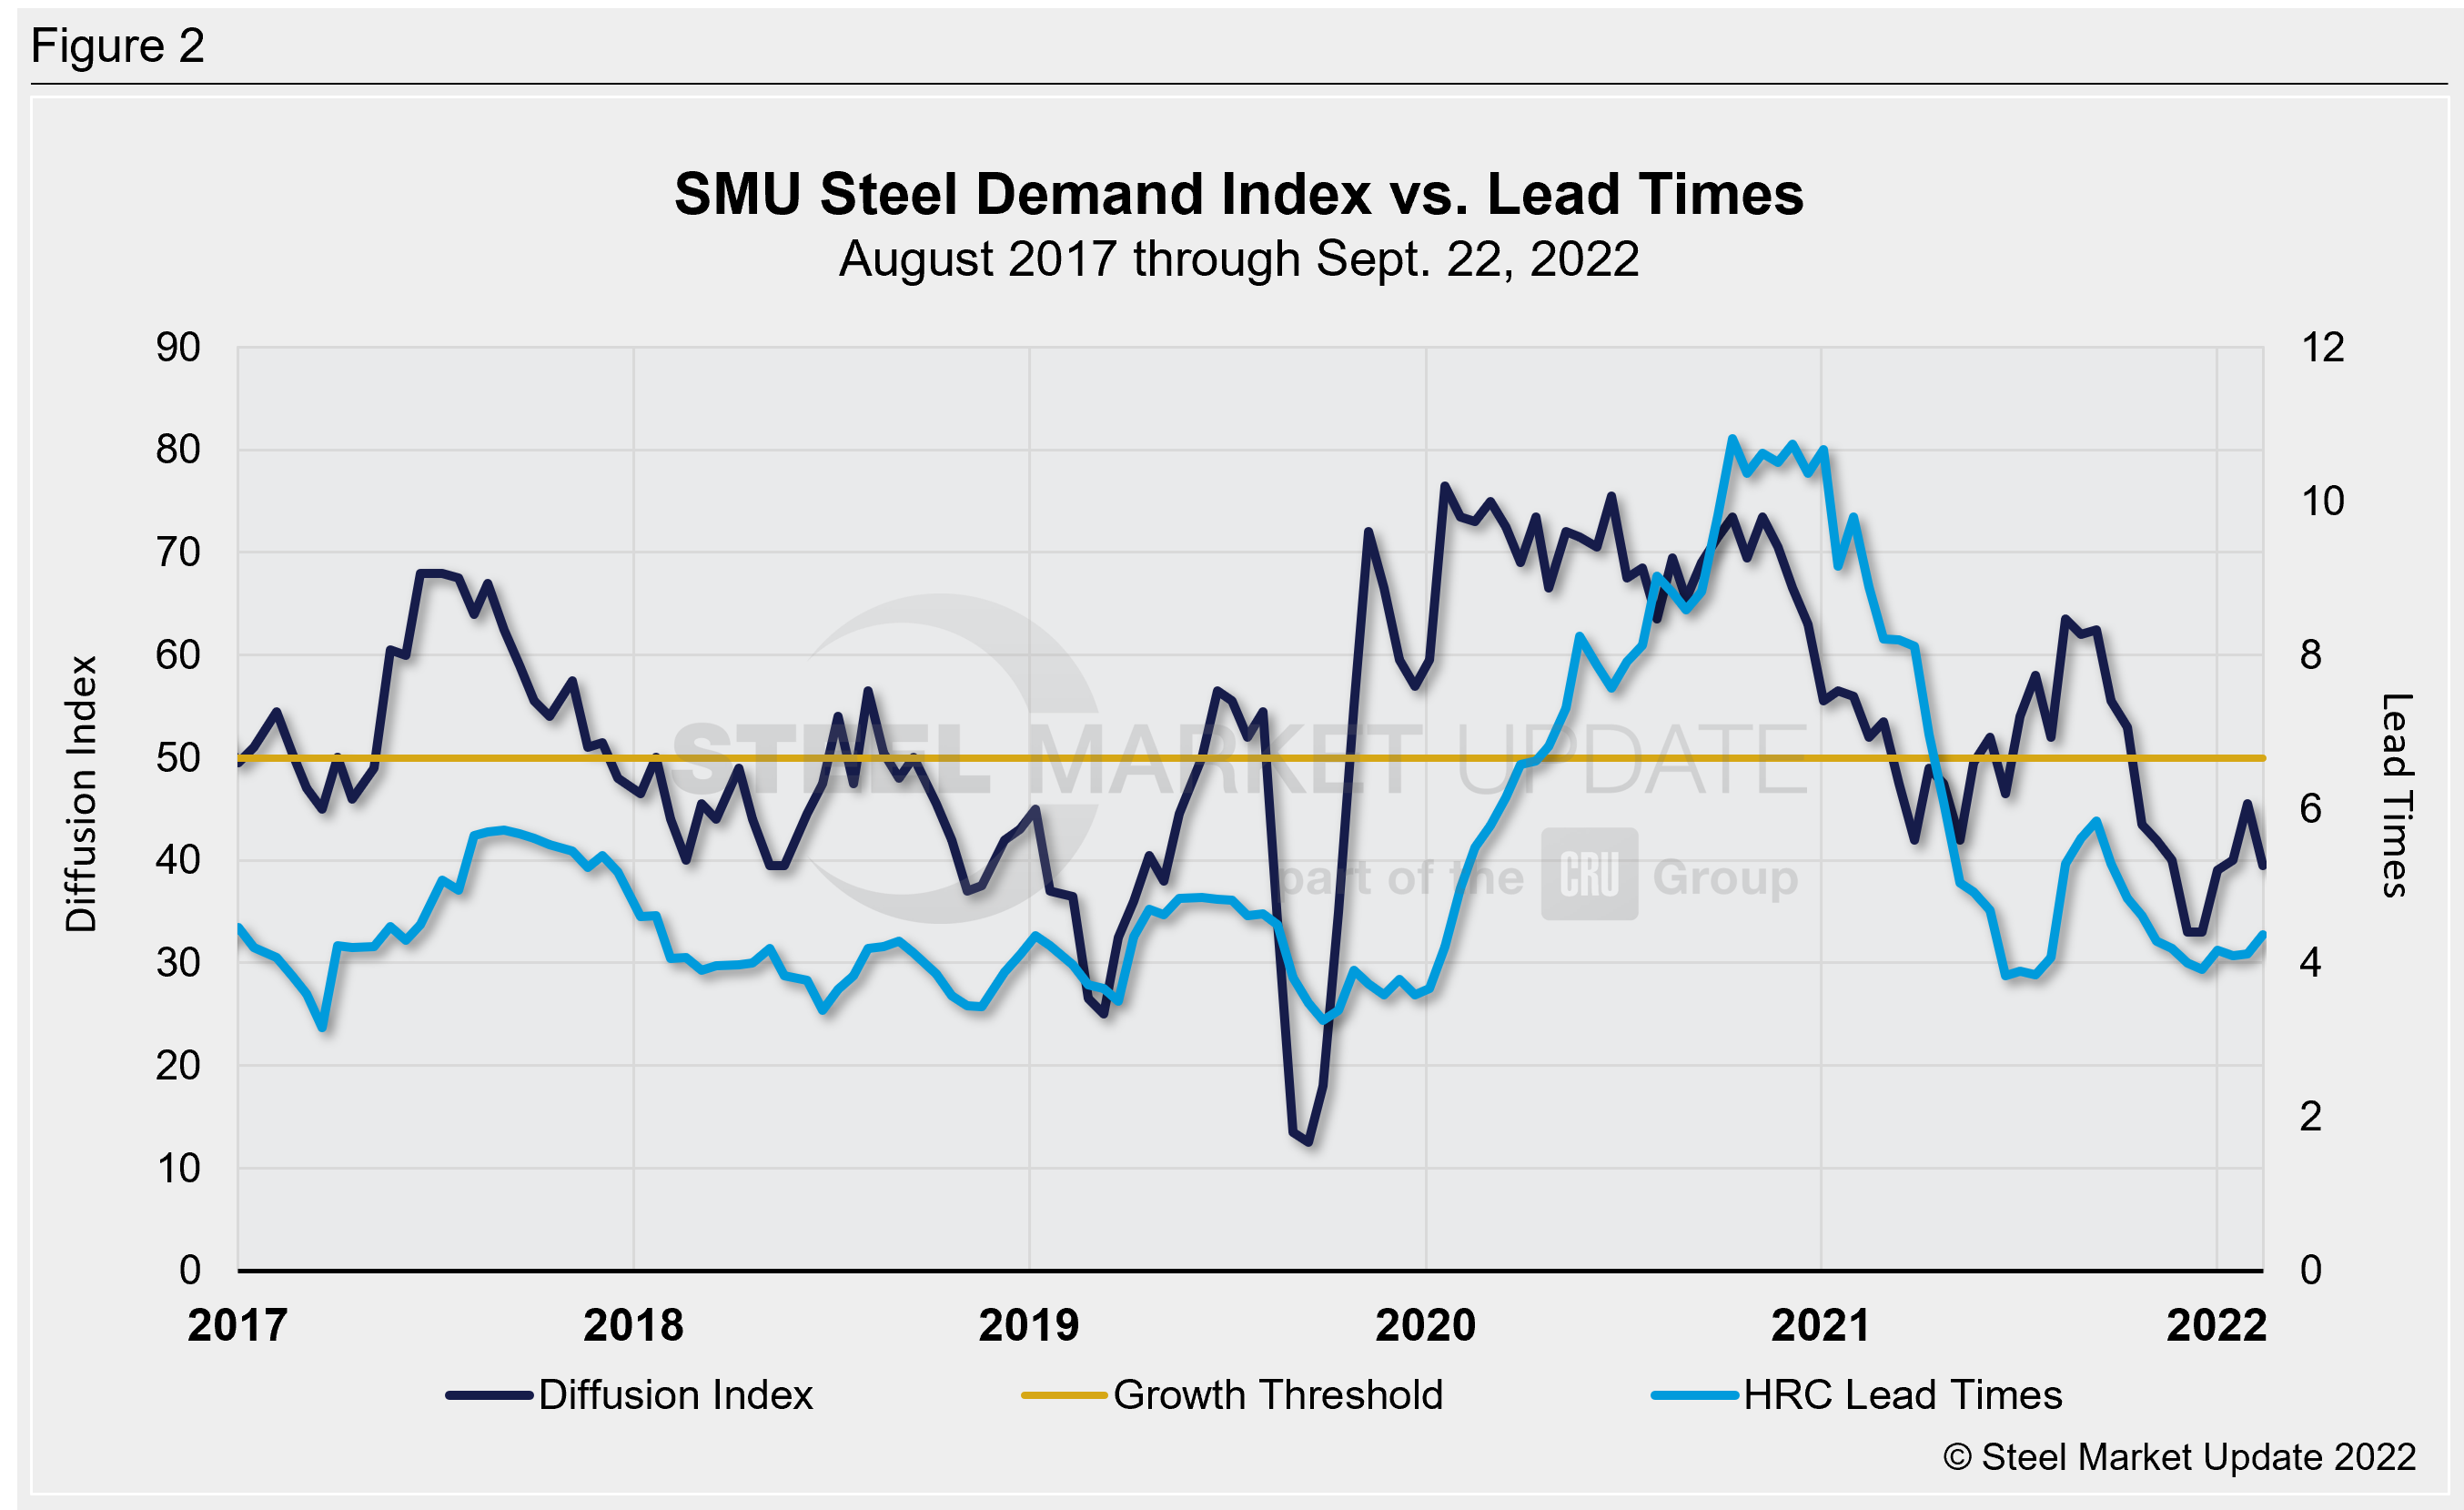
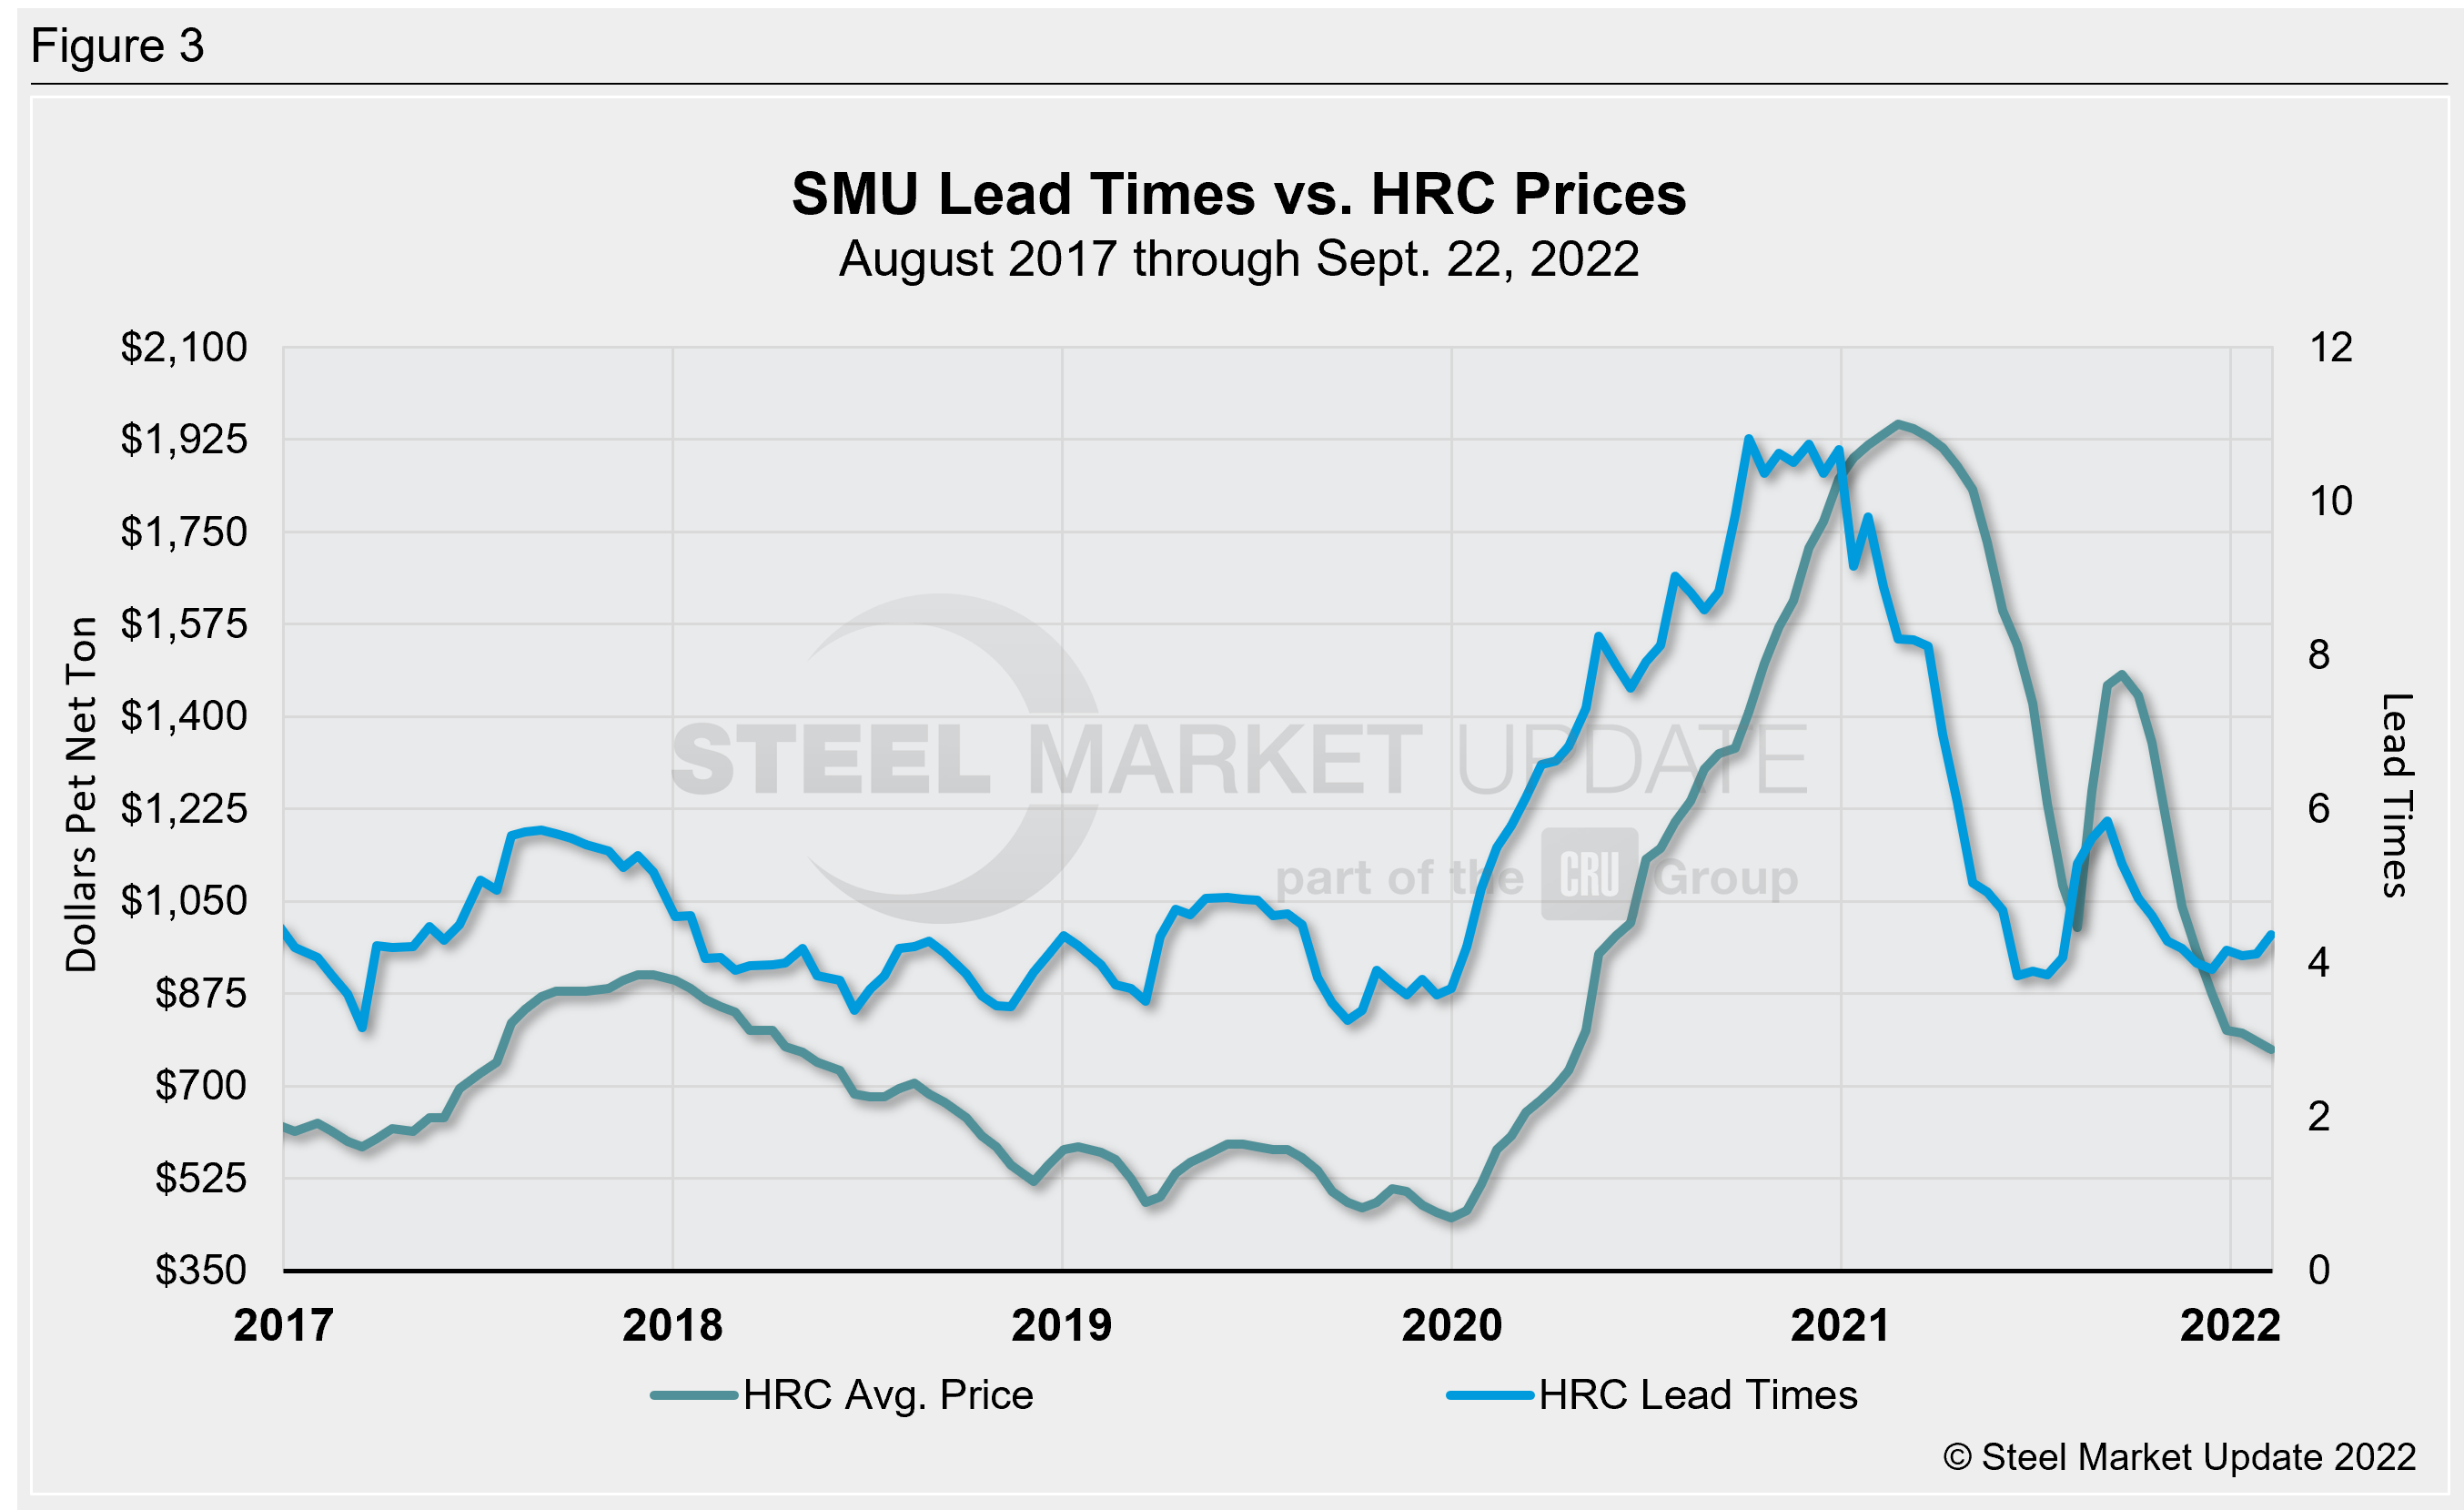
SMU’s demand diffusion index has rarely remained in a holding pattern for long, and for nearly a decade has consistently preceded steel mill lead times (Figure 2 — featuring the past five years). Historically, SMU’s lead times have also been a leading indicator for flat-rolled steel prices, and HRC prices in particular (Figures 3 — featuring the past five years).
SMU’s average HRC price now stands at $770 per ton ($38.50 per cwt), according to our latest check of the market on Sept. 20. Our overall average is down $15 per ton week-on-week.
Our hot rolled lead times average 4.37 weeks, a marginal increase from 4.12 weeks in early September. Overall, lead times are still low and not far from 2022 lows of ~3.8 weeks in late January and February. But they remain significantly higher than the record low in our ~11-year data history, which was 2.8 weeks in October 2016.
These shifting markers certainly underscore what some would note as indecisive or static sentiment. But the underlying downward pressure cannot be ignored. With much uncertainty still ahead, including the possibility of labor turmoil for US Steel and a fraught economy in the near-term, further fluctuations are likely.
The takeaway: Mills have certainly changed their tune, starting to report declining demand, and outages and idlings have followed. Respondents to our surveys, mostly steel consumers, remain cautious, only buying for project-specific needs and to fill gaps. The bulk of respondents, nearly two-thirds, continue to report static sentiment, an indication that overall, the market is still lacking direction
Note: Demand, lead times and prices are based on the average data from manufacturers and steel service centers who participate in SMU market trends analysis surveys. Our demand and lead times do not predict prices but are leading indicators of overall market dynamics and potential pricing dynamics. Look to your mill rep for actual lead times and prices.
By David Schollaert, David@SteelMarketUpdate.com


