

Market Data

September 30, 2022
US Economy Shrank -0.6% in Q2, Final Review Confirms
Written by David Schollaert
The US economy declined at a revised -0.6% in the second quarter of 2022, matching the most recent GDP estimate and confirming the economy shrank in the first six months of the year, according to the second estimate from the US Commerce Department’s Bureau of Economic Analysis (BEA).
Gross domestic production (GDP) in Q2 contracted at a more moderate pace than initially thought, but the economy’s official scorecard shows it was in contraction for the entire first half of the year as businesses readjusted to pandemic-era supply chain disruptions.
The third and final review of Q2 GDP may reignite the debate as to whether the US has been or was in a recession, which has an informal rule of thumb and is commonly defined as two consecutive quarters of negative growth. But the National Bureau of Economic Research (NBER), the official arbiter of when recessions begin and end, is unlikely to make a judgment anytime soon and can revise data well into the months ahead.
The negative growth rate in Q2 follows a declining annualized rate of -1.6% from January to March. It stands in marked contrast to the robust 6.9% annual increase in GDP recorded in the final quarter of 2021 when the economy roared back from Covid shutdowns.
The final review of Q2 GDP is based on more complete data than what was available last month and reflects upwardly revised levels of consumer spending, federal government spending, and business fixed investment. Those were offset by a downward revision to exports and investment in housing, the BEA said.
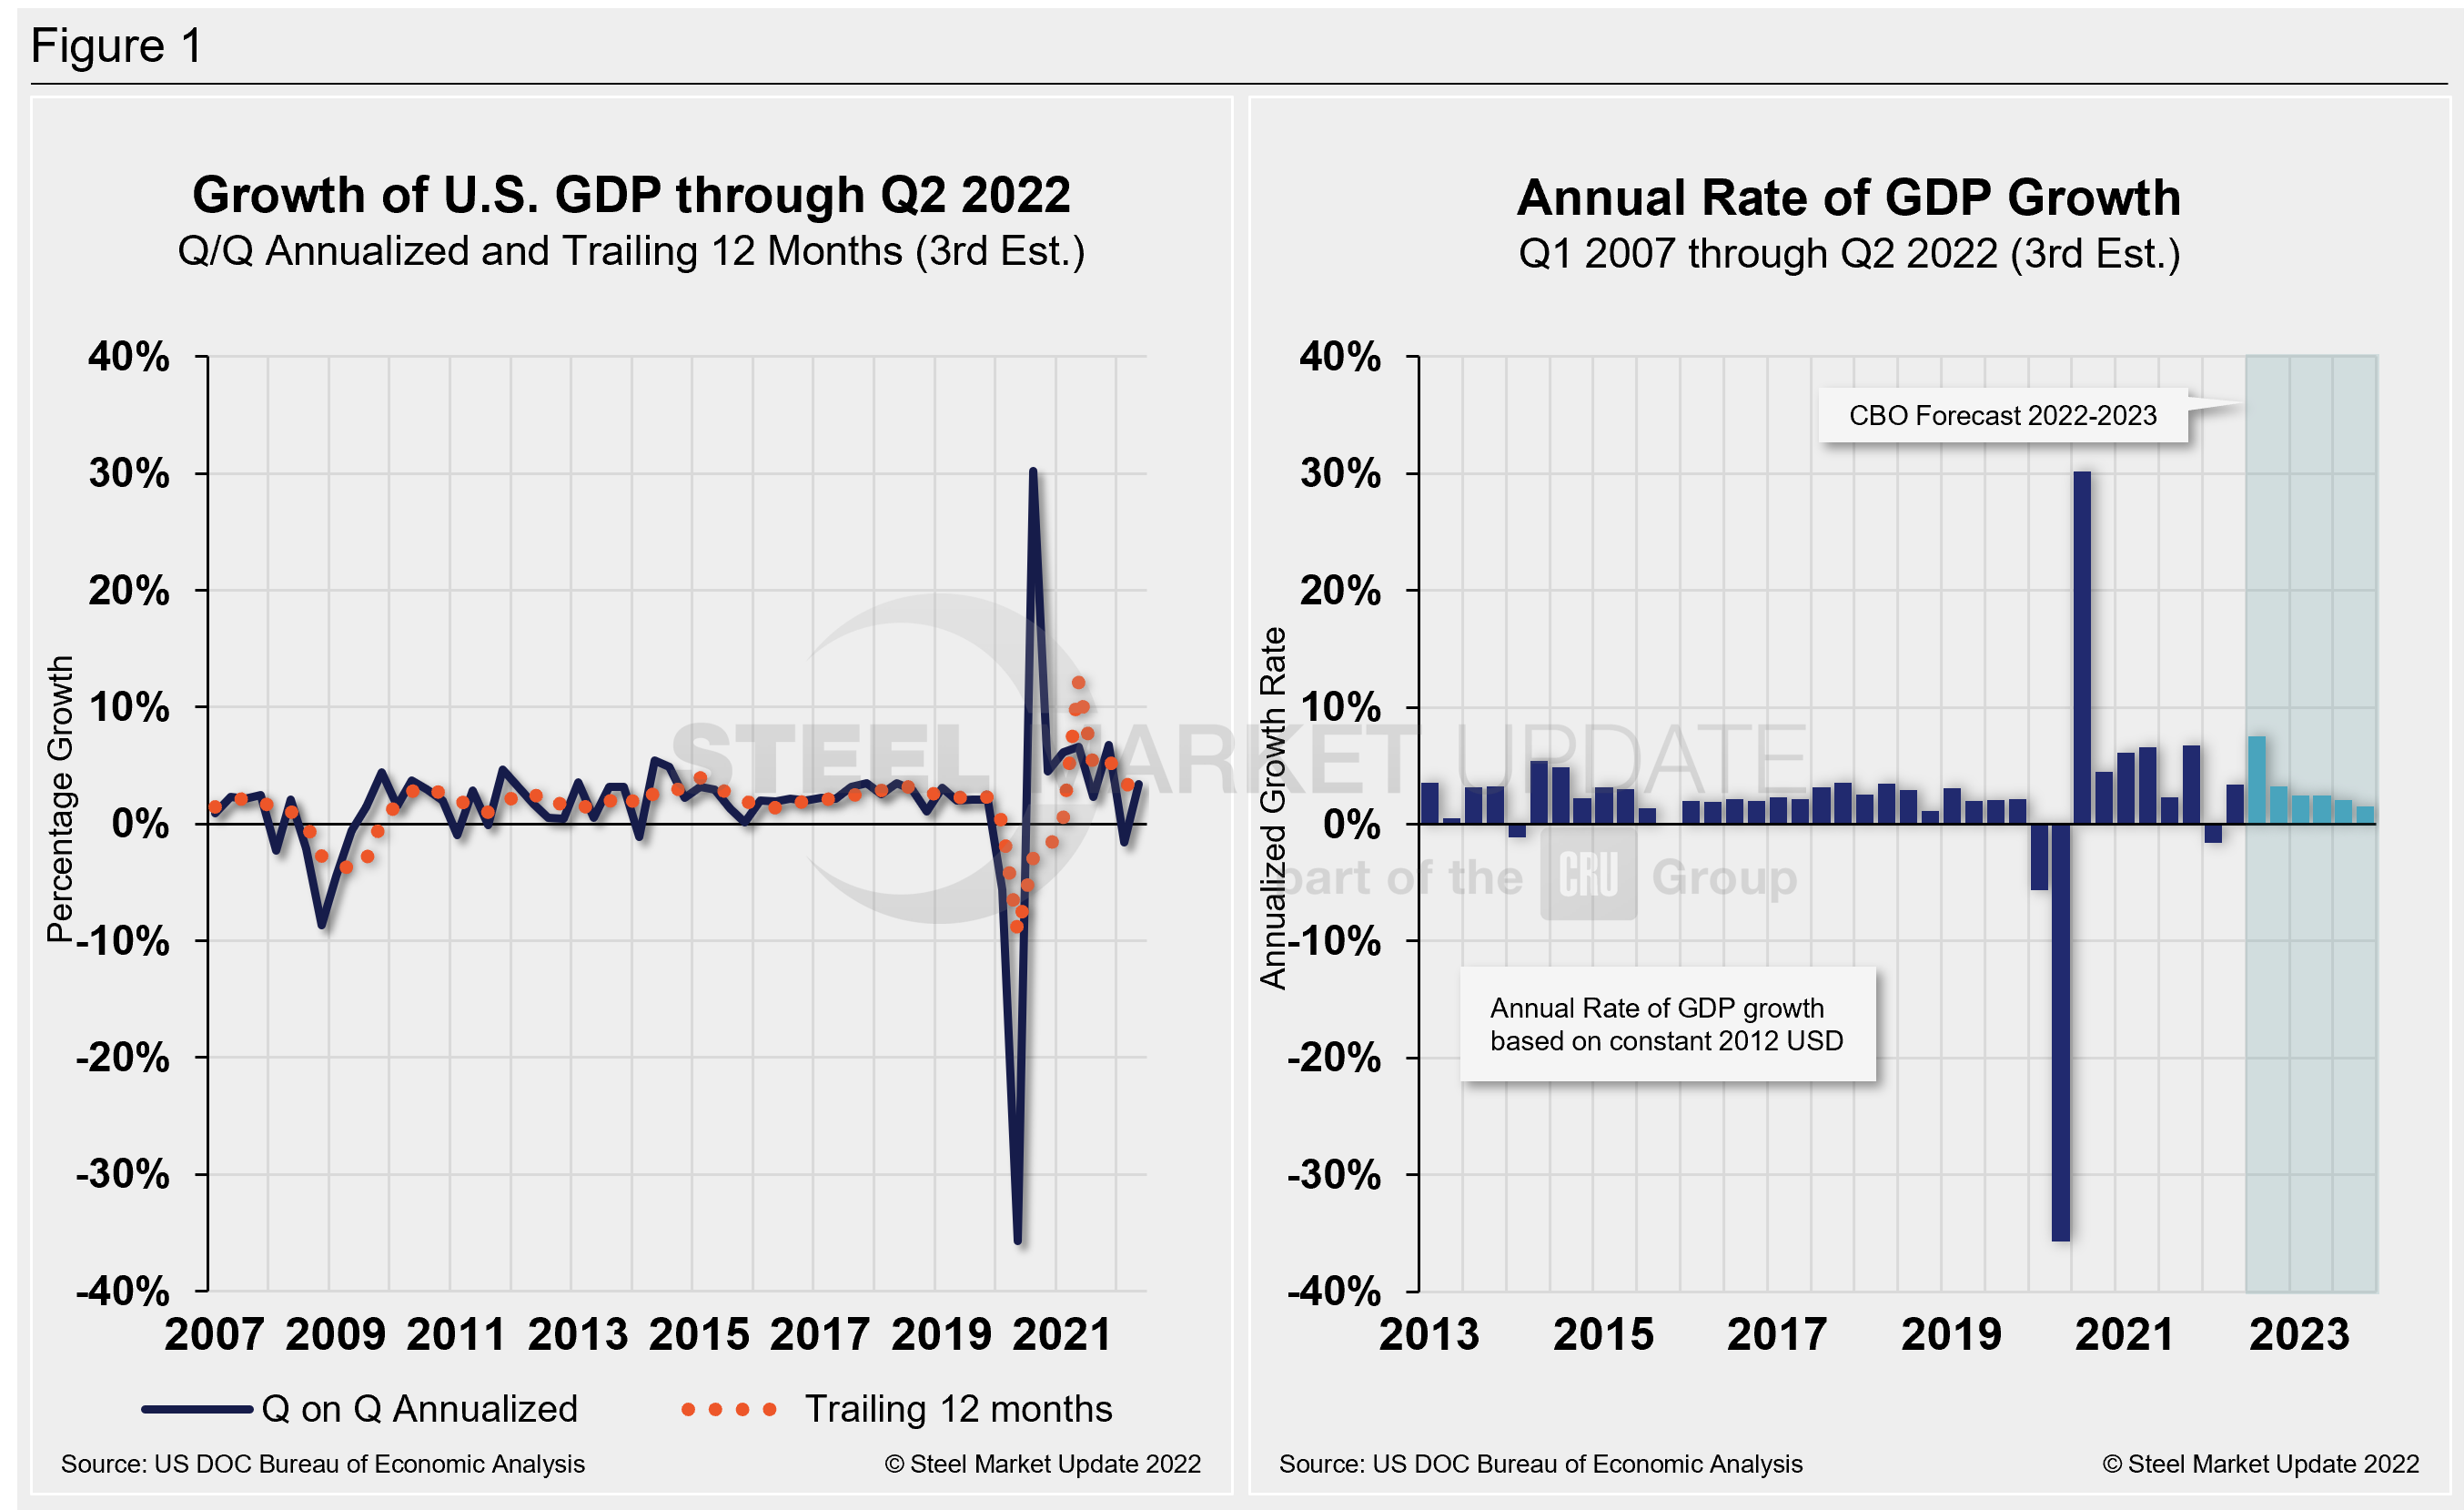
Commerce’s third and final look put total US GDP in Q2 at $25.25 trillion, an 8.5% increase or $508 billion, over the previous quarter. Below in Figure 1 is a side-by-side comparison of US GDP growth and the annual rate of GDP, both through Q2 2022. In the first chart, you’ll see the contrast between the trailing 12-month growth and the headline quarterly result. The chart on the right details the headline quarterly results since Q1 2007, including the Congressional Budget Office’s GDP projection through 2023.
On a trailing 12-month basis, GDP accelerated by just 2.72% in Q2, down from 3.53% in the prior quarter but still well behind 12.23% growth in Q2. Yet, it’s a vast improvement from -9.27% in Q2 2020 at the height of the pandemic. For comparison, the average in 50 quarters since Q1 2010 has been a growth rate of 2.13%.
The latest GDP figures come as a strong and resilient American job market continues to suggest that the world’s biggest economy is not yet in a downturn. But there is worry that it might be headed for one as the Federal Reserve ratchets up interest rates to combat inflation.
Consumer spending grew at a 2% annual rate, but that gain was offset by a drop in business inventories and housing investment.
The US economy continues to send mixed signals this year. Though GDP has gone backward in the first half of the year, the job market has stayed strong. Employers are adding an average 438,000 jobs per month this year, on pace to be the second-best year for hiring (behind 2021) in government records going back to 1940.
Unemployment is at 3.7%, low by historic standards, and there are currently about two jobs for every unemployed American.
Commerce also revised numbers for past years’ GDP on Thursday. The economy performed slightly better in 2020 and 2021 than previously reported. GDP improved from 5.7% last year to 5.9%; and it shrank by 2.8% in 2020, not as bad as the 3.4% previously on record.
GDP remained unchanged for 2018 (2.9%) and 2019 (2.3%). Growth for 2017 was downgraded slightly — to 2.2% from 2.3%.
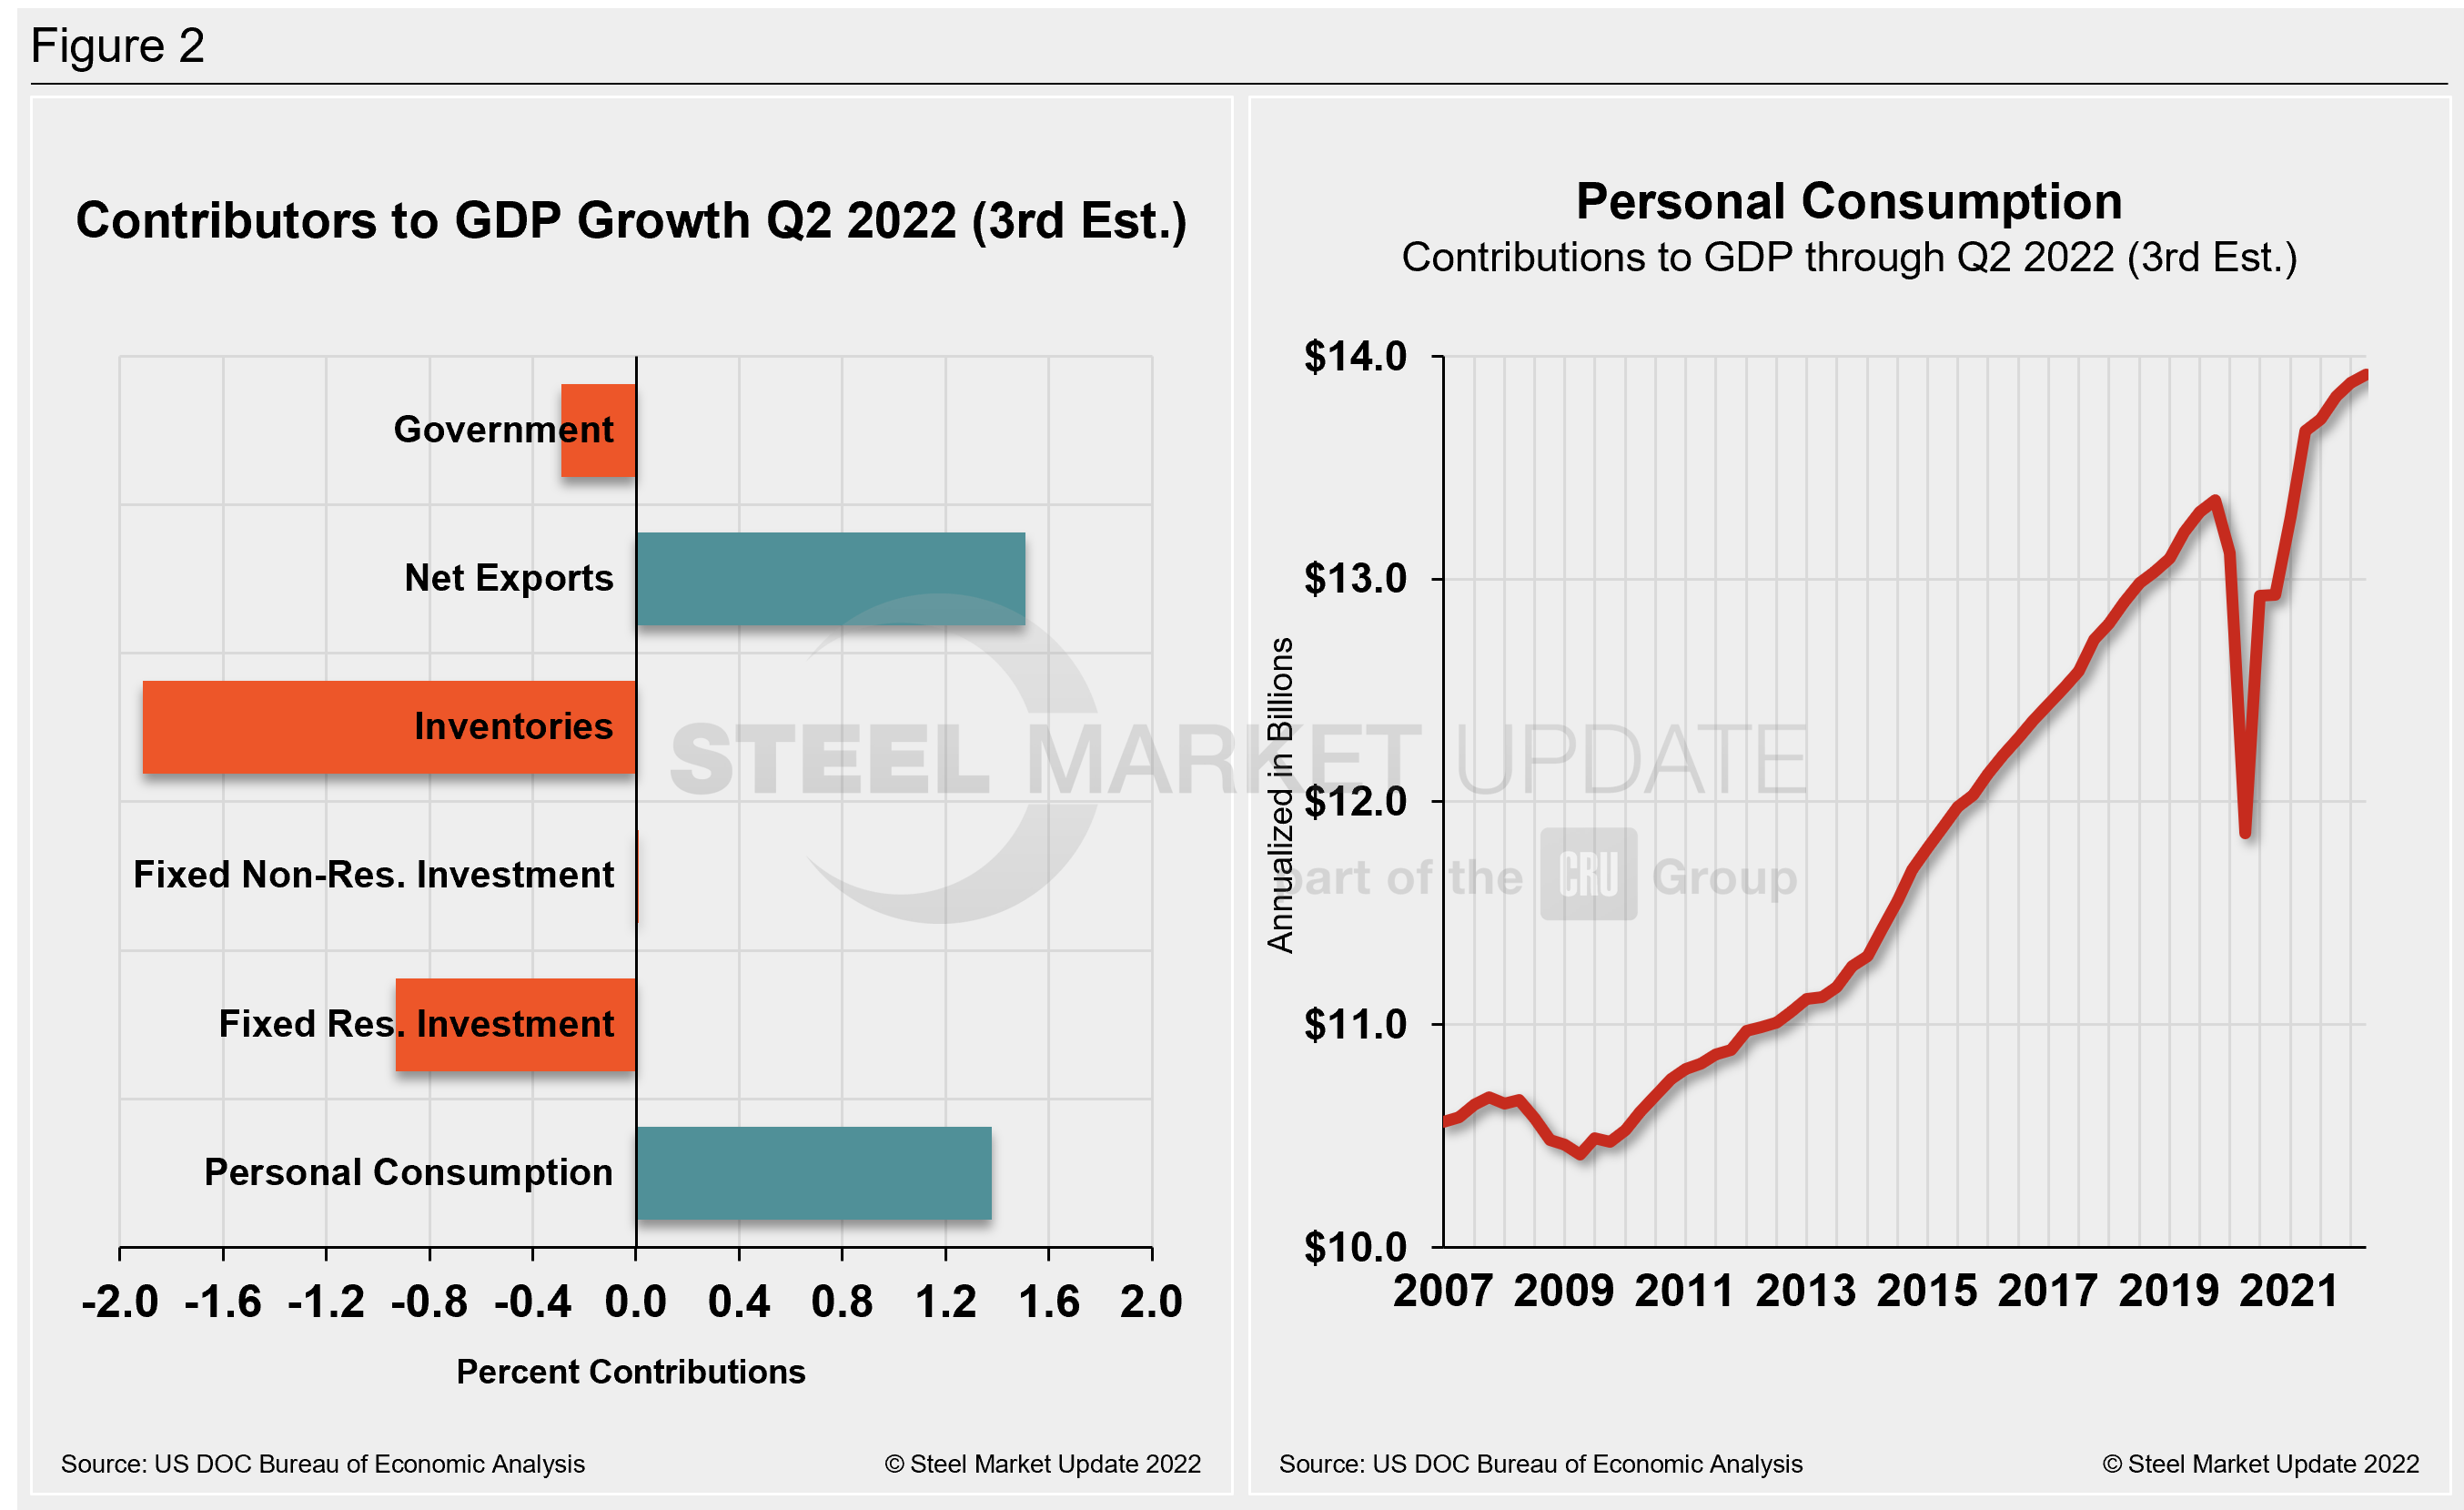
Shown below in Figure 2 is a side-by-side comparison of two charts. The mix of the six major components in the GDP growth calculation is on the left. The chart on the right puts a spotlight on personal consumption, a measure of consumer confidence and spending engagement.
The most notable change and a major source of GDP fluctuation is personal consumption, which has seen extreme swings since the onset of Covid. It has been resilient more recently but is no longer a bright spot despite inching up from 1.24% to 1.38% quarter-on-quarter, slightly improved from the initial estimate. It is still the second-lowest mark in two years.
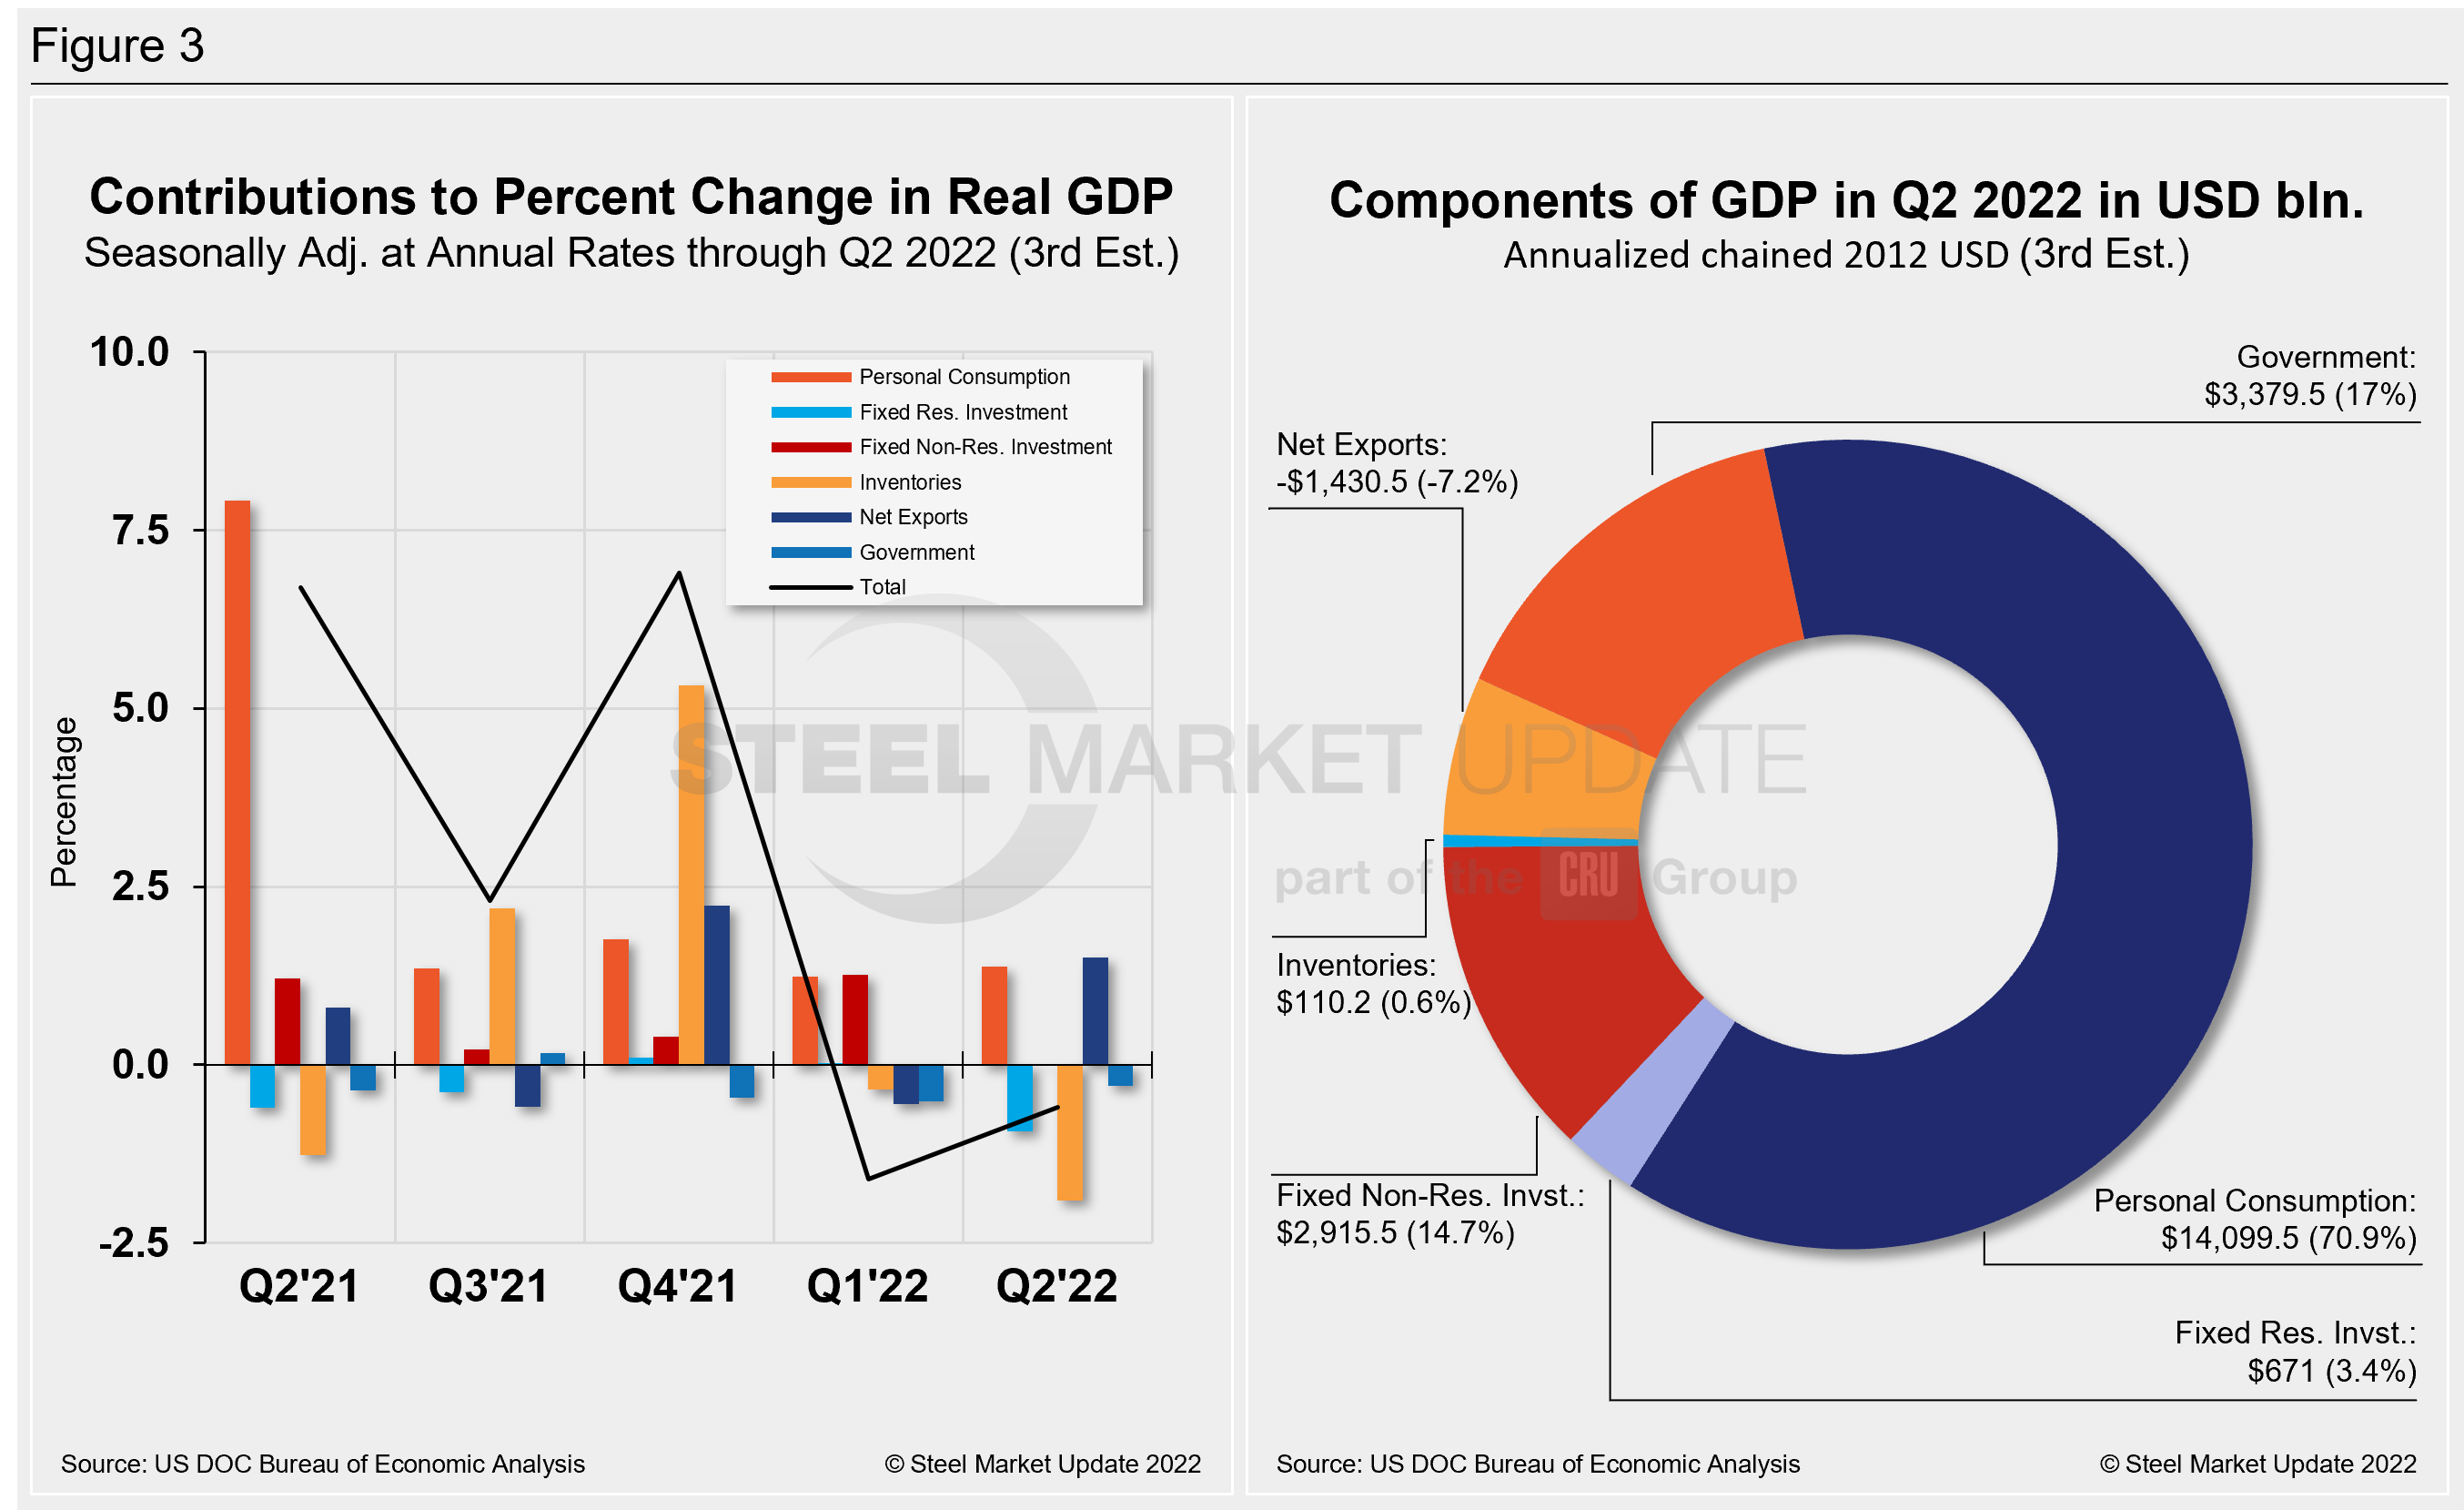
The quarterly contributions of the six major subcomponents of GDP since Q2 2021 and the breakdown of the $25.25 trillion economy in BEA’s third and final review of Q2 GDP are both shown in Figure 3. The chart on the left is for cross-comparison with Figure 1 above. The right chart shows the other components’ size relative to personal consumption.
By David Schollaert, David@SteelMarketUpdate.com


