

Prices

October 6, 2022
HRC Futures Trading at Lowest Since Nov. '20, Bush Looks Cheap
Written by David Feldstein
Editor’s note: SMU Contributor David Feldstein is president of Rock Trading Advisors. Rock provides customers attached to the steel industry with commodity price risk management services and market intelligence. RTA is registered with the National Futures Association as a Commodity Trade Advisor. David has over 20 years of professional trading experience and has been active in the ferrous derivatives space since 2012.
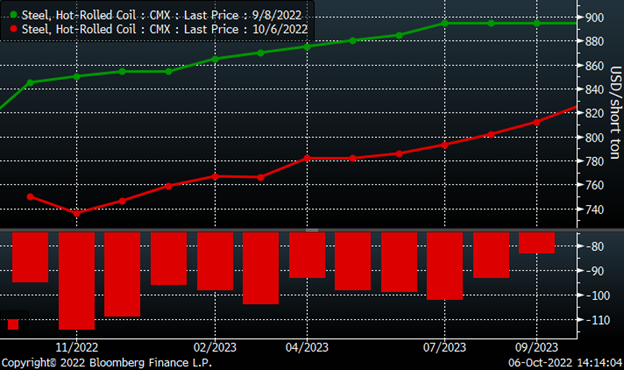
The CME Midwest HRC futures curve has continued to take a beating over the past four weeks with every month from October through September ‘23 falling by at least $80/st. The November future’s $114 decline was the largest of any month followed by December’s $109 drop.
CME Hot Rolled Coil Futures Curve $/st
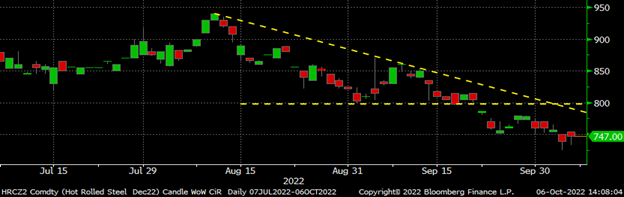
Let’s get technical! Below is a candlestick chart. Each “candle” represents that day’s open, close, high and low. If the candle is green, then the close was above the opening price. If it is red, the close was below the opening price. The skinny line, or wick, represents the day’s trading range. This candlestick chart of the December HR future shows the support level at $800 (yellow-dashed horizontal line) holding for the first three weeks of September. Then on September 22, the $800 support level failed and December fell to $760 in two days. It next found some support at $750 for a few trading sessions until trading on Wednesday broke below the $750 level, falling to a new December low of $725. Futures are now trading at their lowest levels since November 2020.
December CME Hot Rolled Coil Future $/st
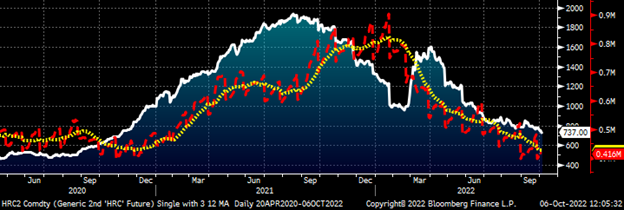
Open interest is the number of outstanding futures contracts, or tons in the case for the CME HRC futures. The chart below of the rolling second month HRC future includes open interest in red with a 22-day moving average in yellow. Open interest’s alligator teeth looking pattern in red occurs because at each month’s expiration, all of the open interest comes off at settlement. As you can see, open interest climbed higher along with last year’s epic rally. Open interest peaked just above 900k tons in January and has steadily fallen since to 416k as of the close on Wednesday. I believe this is due to two major groups, OEM forward buyers and importers, largely absent from the futures market. The decline in open interest results in relatively lower liquidity. This can quickly translate into a burst of volatility if there is a sudden change in expectations pulling a number of participant back in and/or a large imbalance between buyers and sellers. For instance, if US Steel or the USW negotiations resulted in a labor stoppage, we could see a rush of buyers flock to the market compounded by short covering. Open interest in late February was just below 800k tons when Russia escalated their invasion of Ukraine.
Rolling 2nd Month CME Hot Rolled Coil Future $/st & Open Interest
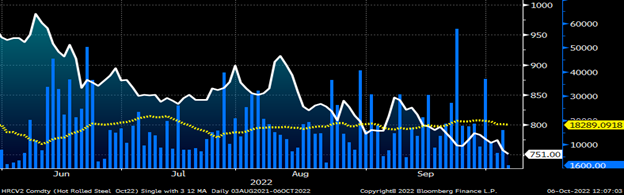
This chart of the October HR future shows the steady downtrend in price since Memorial Day in white, daily volume in blue, and the 22-day moving average of daily volume in yellow. Volume has been at the middle to lower end of the range seen back through Q4 2020.
October CME HRC Future $/st w Aggregate Curve Volume & 22-Day Avg.
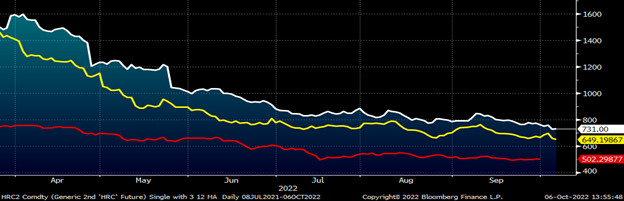
This chart shows the rolling second month Midwest HRC future in white, North European future in yellow, and Chinese future in red all in USD per short ton. China is closed for their Golden Week holiday, thus why their future stops on Sept. 29. All three have come down sharply since March 31. The Midwest and North European futures have come down 54.4% and 53.9%, respectively, while the Chinese future has declined by 26.6%. The Midwest future is $82 above the North European future and $229 above the Chinese future.
Rolling 2nd Month Midwest (wh), North European (yel) & Chinese (red) HRC Future $/st
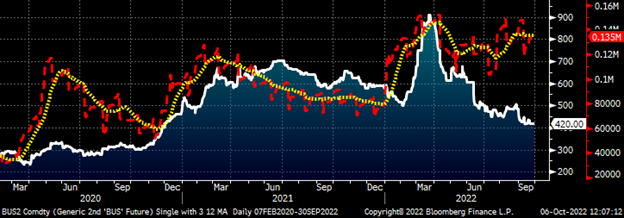
Open interest remains strong in CME busheling futures remaining near its new all-time highs of 150k tons. Open interest in busheling was just below 135k tons at the close on Wednesday. Increasing open interest accompanying a trend makes it a technically strong trend. October’s scrap settlements are expected to decline again, which would make it the 6th straight month of decline – falling a total $354 (not counting October) since peaking at $778.65 in April.
Rolling 2nd Month CME Busheling Future $/lt & Open Interest (red)
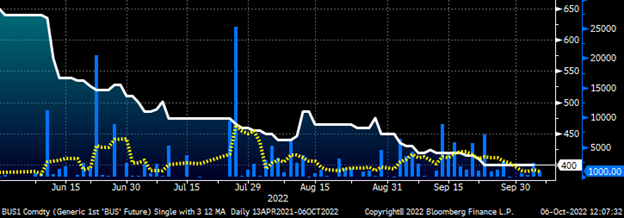
While open interest has remained strong, daily trading volume has been relatively anemic in busheling of late.
October CME Busheling Future $/st w Aggregate Curve Volume & 22-Day Avg.
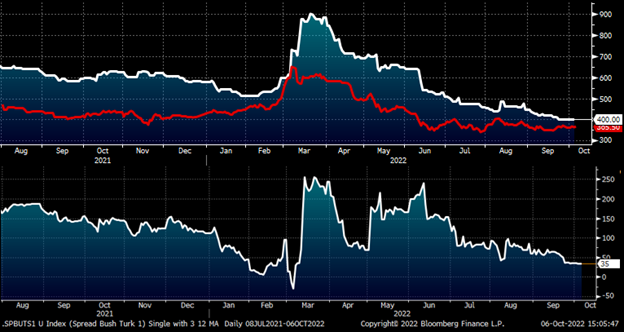
Busheling has been so beaten up, the October future is now only $35 above the October Turkish scrap future. This chart shows the front month contract of both products back to August ’21. The white line is busheling, the red Turkish scrap, and the spread between the two products is shown in the lower panel. Obviously, busheling is more valuable than Turkish scrap and has been $85 higher on average since 2020 and $120 higher on average since 2021. The last time the spread between these two products was this low was in early February, when the spread fell to single digits. Of course, what followed was a sharp spike in both products, with the spread exploding to $250. NOLA pig iron is trading at $535/t, providing another data point indicating this once precious metal might be relatively undervalued.
Front Month Busheling ($/lt) and Turkish Scrap ($/mt) Futures
If you are a fan of this article and interested in learning more about ferrous futures and trading, please tune in to next week’s Community Chat, where I will be Michael Cowden’s guest. We will discuss a number of different topics related to the ferrous derivatives markets as well as some trading stories and lessons learned over the past three years.
Disclaimer: The content of this article is for informational purposes only. The views in this article do not represent financial services or advice. Any opinion expressed by Feldstein should not be treated as a specific inducement to make a particular investment or follow a particular strategy, but only as an expression of his opinion. Views and forecasts expressed are as of date indicated, are subject to change without notice, may not come to be and do not represent a recommendation or offer of any particular security, strategy or investment. Strategies mentioned may not be suitable for you. You must make an independent decision regarding investments or strategies mentioned in this article. It is recommended you consider your own particular circumstances and seek the advice from a financial professional before taking action in financial markets.
By David Feldstein, Rock Trading Advisors


