Product

October 13, 2022
Hot Rolled Futures: HRC Loses Battle With Upper $700s
Written by Michael D'Angelo
Editor’s note: SMU Contributor Michael D’Angelo is a researcher and trader at Marex who has been active in the metals markets for two years. In his role, Mike performs fundamental and quantitative analysis which directly leads to actionable trading/risk management strategies across the base, precious and ferrous metals derivative spaces. Prior to joining Marex, Mike received a BA in economics with a minor in finance from Princeton University. Mike can be reached at mdangelo@marex.com for comments/questions.
The CME futures curve continues to take a beating after spot assessments fell well below $800 per ton — a floor that mills were battling to hold for a while. CRU’s weekly HRC index came in at $760 on Oct. 12, down $9 (-1.17%) from the previous week and now sitting at the lowest level since October 2020, which caused Q4 ’22 and Q1 ’23 to sell off even more (see Dec. at $700 now). The Nov ’22 contract traded as low as $680, down $90 (~12%) from last Monday’s high!
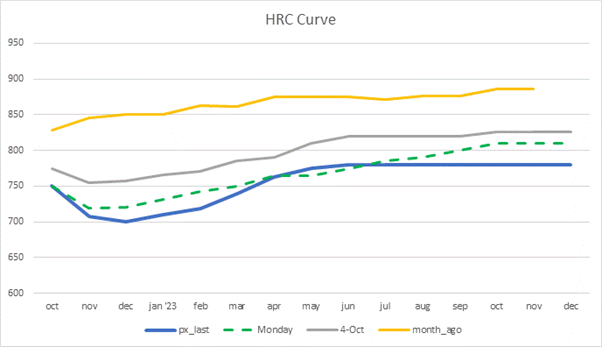
The October contract has been trading around $750, which implies a $736 average over the next two Wednesdays ($769, $760, $736, $736).
The curve remains in a slight contango with Q3 ’23 trading at about an $80 premium to Dec ’22, however, there is no real way to capitalize on this as there is very little liquidity in the back end of the curve. Additionally, there is nothing but uncertainty in store for the next year. I couldn’t tell you where HRC prices will be next month, let alone in late 2023.
Consensus seems to have shifted from neutral to bearish going into year end. Sentiment is gloomy; I can’t recall hearing a single bullish forecast from an unbiased source over the past few weeks. Inventories remain plentiful and buyers are only purchasing what they need for immediate consumption as they anticipate getting better prices in the future. We are also approaching holiday season where trading activity tends to be muted.
On the economic data front, CPI surprised to the upside on Wednesday coming in at 0.4% MoM (expected 0.2%), which once again silenced the “inflation has peaked” narrative. Any hope of an imminent Fed pivot has now been decimated, and 75 basis points is essentially locked in for the November meeting. Construction spending also missed expectations last week, while Wards total vehicle sales, factory orders and durable goods orders came in in line with expectations. The unemployment rate beat expectations (3.5% vs. 3.7% expected).
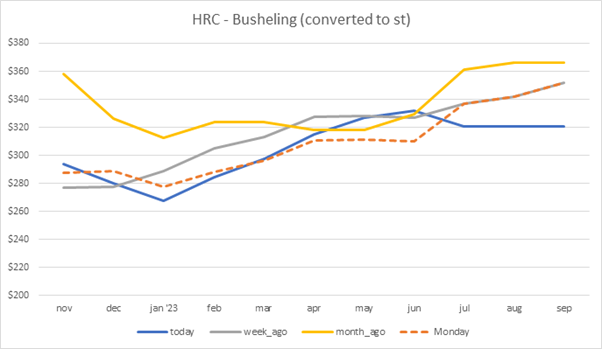
The busheling curve has also come under pressure with Nov ’22 falling from $420 per gross ton to $370 over the past two weeks. Maintenance outages are common in September and October, which has made it even more difficult for scrap dealers to find buyers.
Above is the HRC minus busheling spread, loosely representing mill profit margins, which have cratered throughout this bear market. In the wake of falling HRC prices, mills are trying to negotiate scrap prices lower to preserve their profit margins. Some market participants are speculating that busheling could fall to $300/gt. The curves suggest that margins will recover, but take this with a grain of salt as liquidity is low in the far month contracts and uncertainty is high.
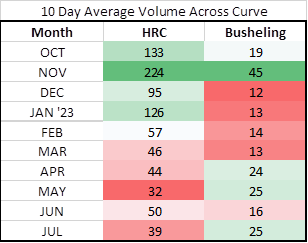
These are the average trading volumes across the curve over the past 10 trading days. The November HRC contract has gotten some action, while busheling remains borderline untradable (along with HRC beyond Jan ’23).
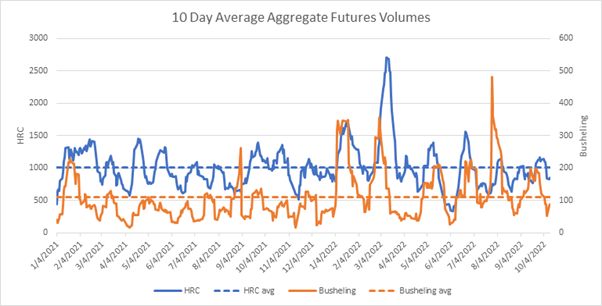
Aggregate futures volumes for HRC have been trending up over the past month but are back below the historical average dating back to January 2021. Busheling trading activity has been muted over the past week.
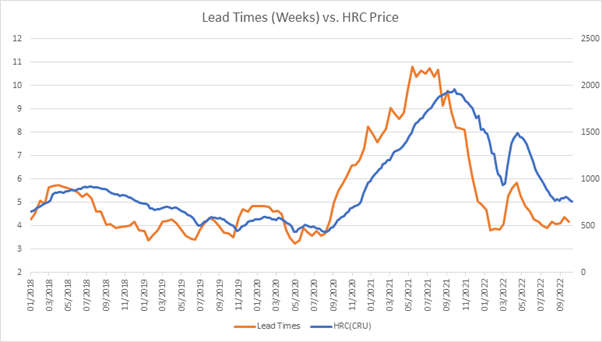
An overlay of SMU’s lead times with the HRC price suggests that there is more room to fall. Historically, the HRC price has been closer to $500–600 per ton when lead times were around four weeks, although often it takes time for the HRC price to catch up. The counter argument is that input costs have significantly risen from 2020.
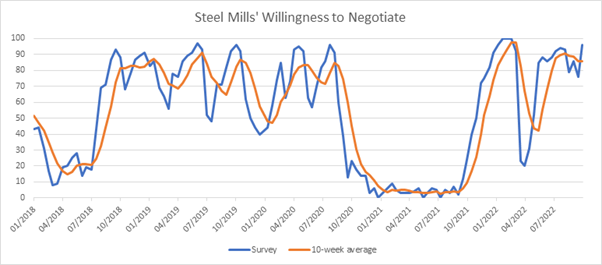
Buyers remain in control of this market as mills’ willingness to negotiate steel prices (SMU survey data) is close to 100%, which sometimes suggests a rally is nearby (see Feb ’22, July ’20, Oct. ’19).
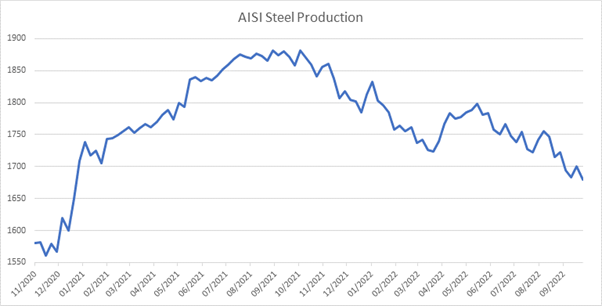
US steel production (AISI) fell by 20,000 tons to 1.68 million tons on the week ending Oct. 8 — the lowest level since January 2021. The US steel capacity utilization rate fell to 75.3% from 77.1%.
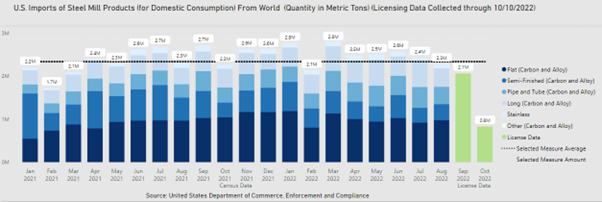
Based on licensing data, steel imports for September were 2.1 million metric tons, tied for the lowest since February 2021 and trending down for the third straight month. Imports for the first 10 days of October were projected to be 800,000 metric tons, implying 2.4 milliion metric tons for the month.
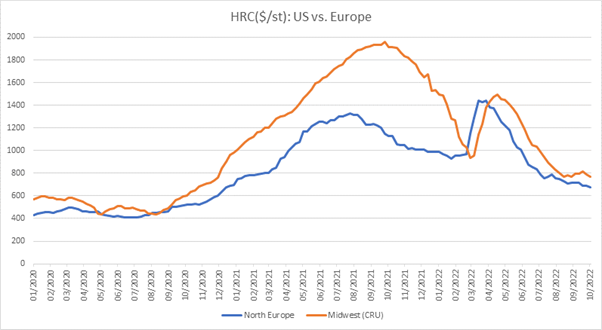
Midwest HRC is now trading at about a $90 premium to Northern Europe HRC, which isn’t a very large premium if we look back to 2021.
Buying activity in Europe continues to be even more sluggish than in the US as buyers remain sidelined and reluctant to “catch a falling knife” until the market shows some signs of stabilization. Demand has fallen off a cliff as key consumers in the automotive and construction sectors have reduced output; makes one wonder how close European prices are to the marginal cost of production with energy prices still elevated.
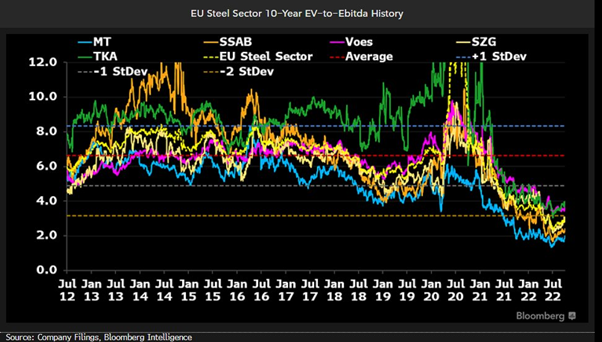
To put EU steel market sentiment into perspective, EU steel equity valuations have plummeted to around 3x EV-to-EBITDA — over two standard deviations below the historical average of 6.6x EV-to-EBITDA, according to Bloomberg Intelligence. Very few people want anything to do with this sector, barring those involved in the physical markets.
Economic Data:
- Oct 3 – Construction Spending MoM: -0.7% (Exp. -0.3%)
- Oct 3 – ISM Manufacturing: 50.9 (Exp. 52.0)
- Oct 3 – Wards Total Vehicle Sales: 13.49m (Est. 13.50m)
- Oct 4 – Factory Orders MoM: 0.0% (Est. 0.0%)
- Oct 4 – Durable Goods Orders: -0.2% (Est. -0.2%)
- Oct 6 – Initial Jobless Claims: 219k (Est. 204k)
- Oct 7 – Unemployment Rate: 3.5% (Est. 3.7%)
- Oct 12 – PPI Final Demand MoM: 0.4% (Est. 0.2%)
- Oct 13 – CPI MoM: -0.4% (Est. 0.2%)
{loadposition reserved_message}
By Michael D’Angelo, Marex, mdangelo@marex.com