

Market Data

November 10, 2022
Steel Mill Lead Times: How Low Can They Go?
Written by Brett Linton
Steel mill lead times were steady to down this week compared to our previous market check. Production times shrunk for four products tracked by SMU and slightly extended for one.
Lead times retracted by an average of 0.2 weeks compared to two weeks ago and are half a week shorter than levels one month ago. Following their peak in April, sheet lead times have been relatively stable since July/August. Plate lead times have gradually moved lower over the past six months.
SMU expects lead times to remain short throughout the remainder of the year, due to seasonal slowdowns as well as flat to declining demand. We expect lead times to marginally extend once we approach 2023 delivery dates.
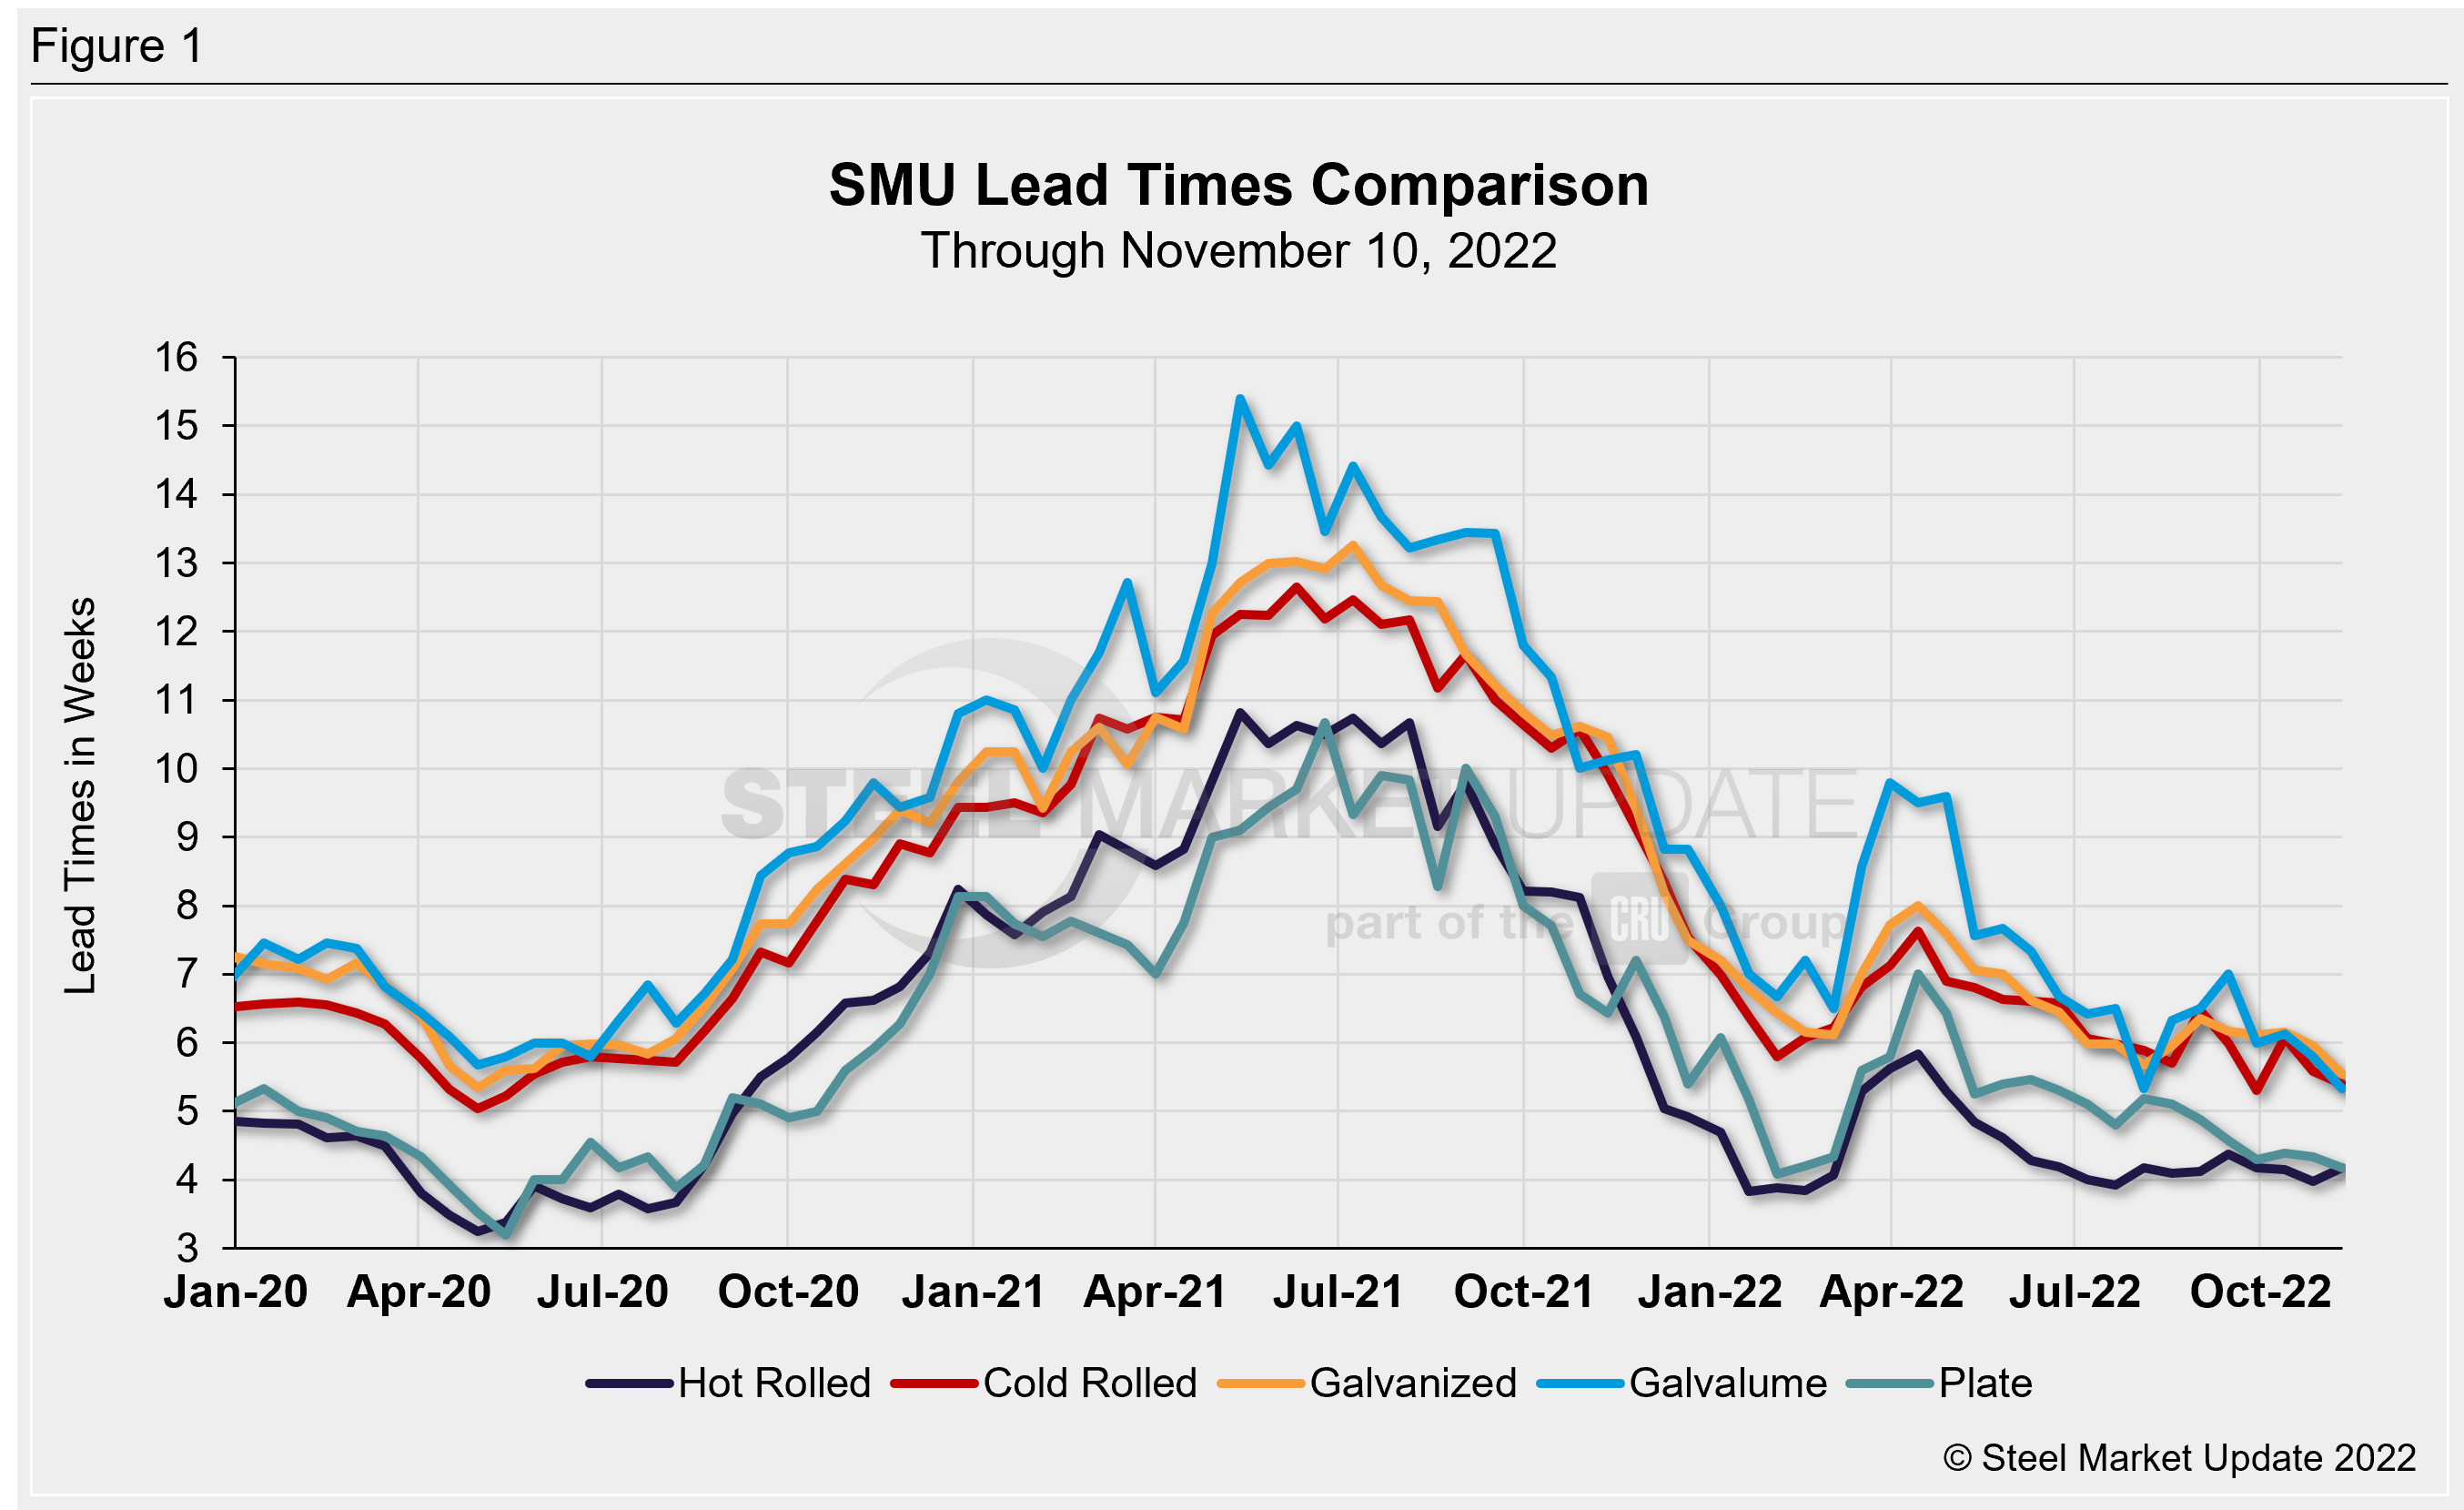
Surveyed buyers reported mill lead times ranging from 3–6 weeks for hot rolled, 4–7 weeks for cold rolled and galvanized, 4–6 weeks for Galvalume, and 3–6 weeks for plate.
SMU’s hot rolled lead time extended by 0.2 weeks from late October to 4.2 weeks. One month ago HR lead times were also at 4.2 weeks. Hot rolled lead times have averaged between 3.9–4.4 weeks over the last five months. The lowest level this year was 3.8 weeks in January/February. The record low in our ~11-year data history was 2.8 weeks in October 2016.
Cold rolled lead times fell by 0.2 weeks to 5.4 weeks, the second lowest reading of the year. One month ago, cold rolled lead times were at 6.1 weeks.
Galvanized and Galvalume lead times both declined, falling 0.4 and 0.5 weeks, respectively. Galvanized lead times, at 5.6 weeks, are now the shortest since May 2020. Galvalume lead times eased to 5.3 weeks, tied with early August for a 7.5-year low. Our record low for both products was in February 2015, when galvanized was 4.8 weeks and Galvalume was 5.1 weeks. Note that Galvalume figures can be volatile due to the limited size of that market and our smaller sample size.
Plate lead times declined 0.1 weeks to 4.2 weeks. This is now the lowest lead time recorded since February (4.1 weeks). Prior to February, the last time plate lead times were this low was in July 2020. In our four-year history, the shortest plate lead time we have on record was 3.2 weeks in May 2020.
Regarding the future direction of lead times, 56% of the executives responding to this week’s questionnaire think that lead times will be relatively flat two months from now. This is down from a rate of 65% when polled two weeks ago. 38% of buyers reported lead times would be extending, up from 30% in our previous survey. Just 6% said lead times would be contracting, similar to levels two weeks prior. Here is what a few of our respondents had to say:
“Distributors and some end users refuse to buy. Inventories are being depleted, anticipating a price drop. Project work is strong.”
“Overcorrection and will extend a lot.”
“[Lead times] can’t be reduced, mills have already cut back on production to keep the lead times they have.”
“Q1 will have us replenishing our stock.”
“Extending — a mechanism that will allow mills to increase prices.”
“Flat, which is still awful. Things are too darn short.”
“Extending in January.”
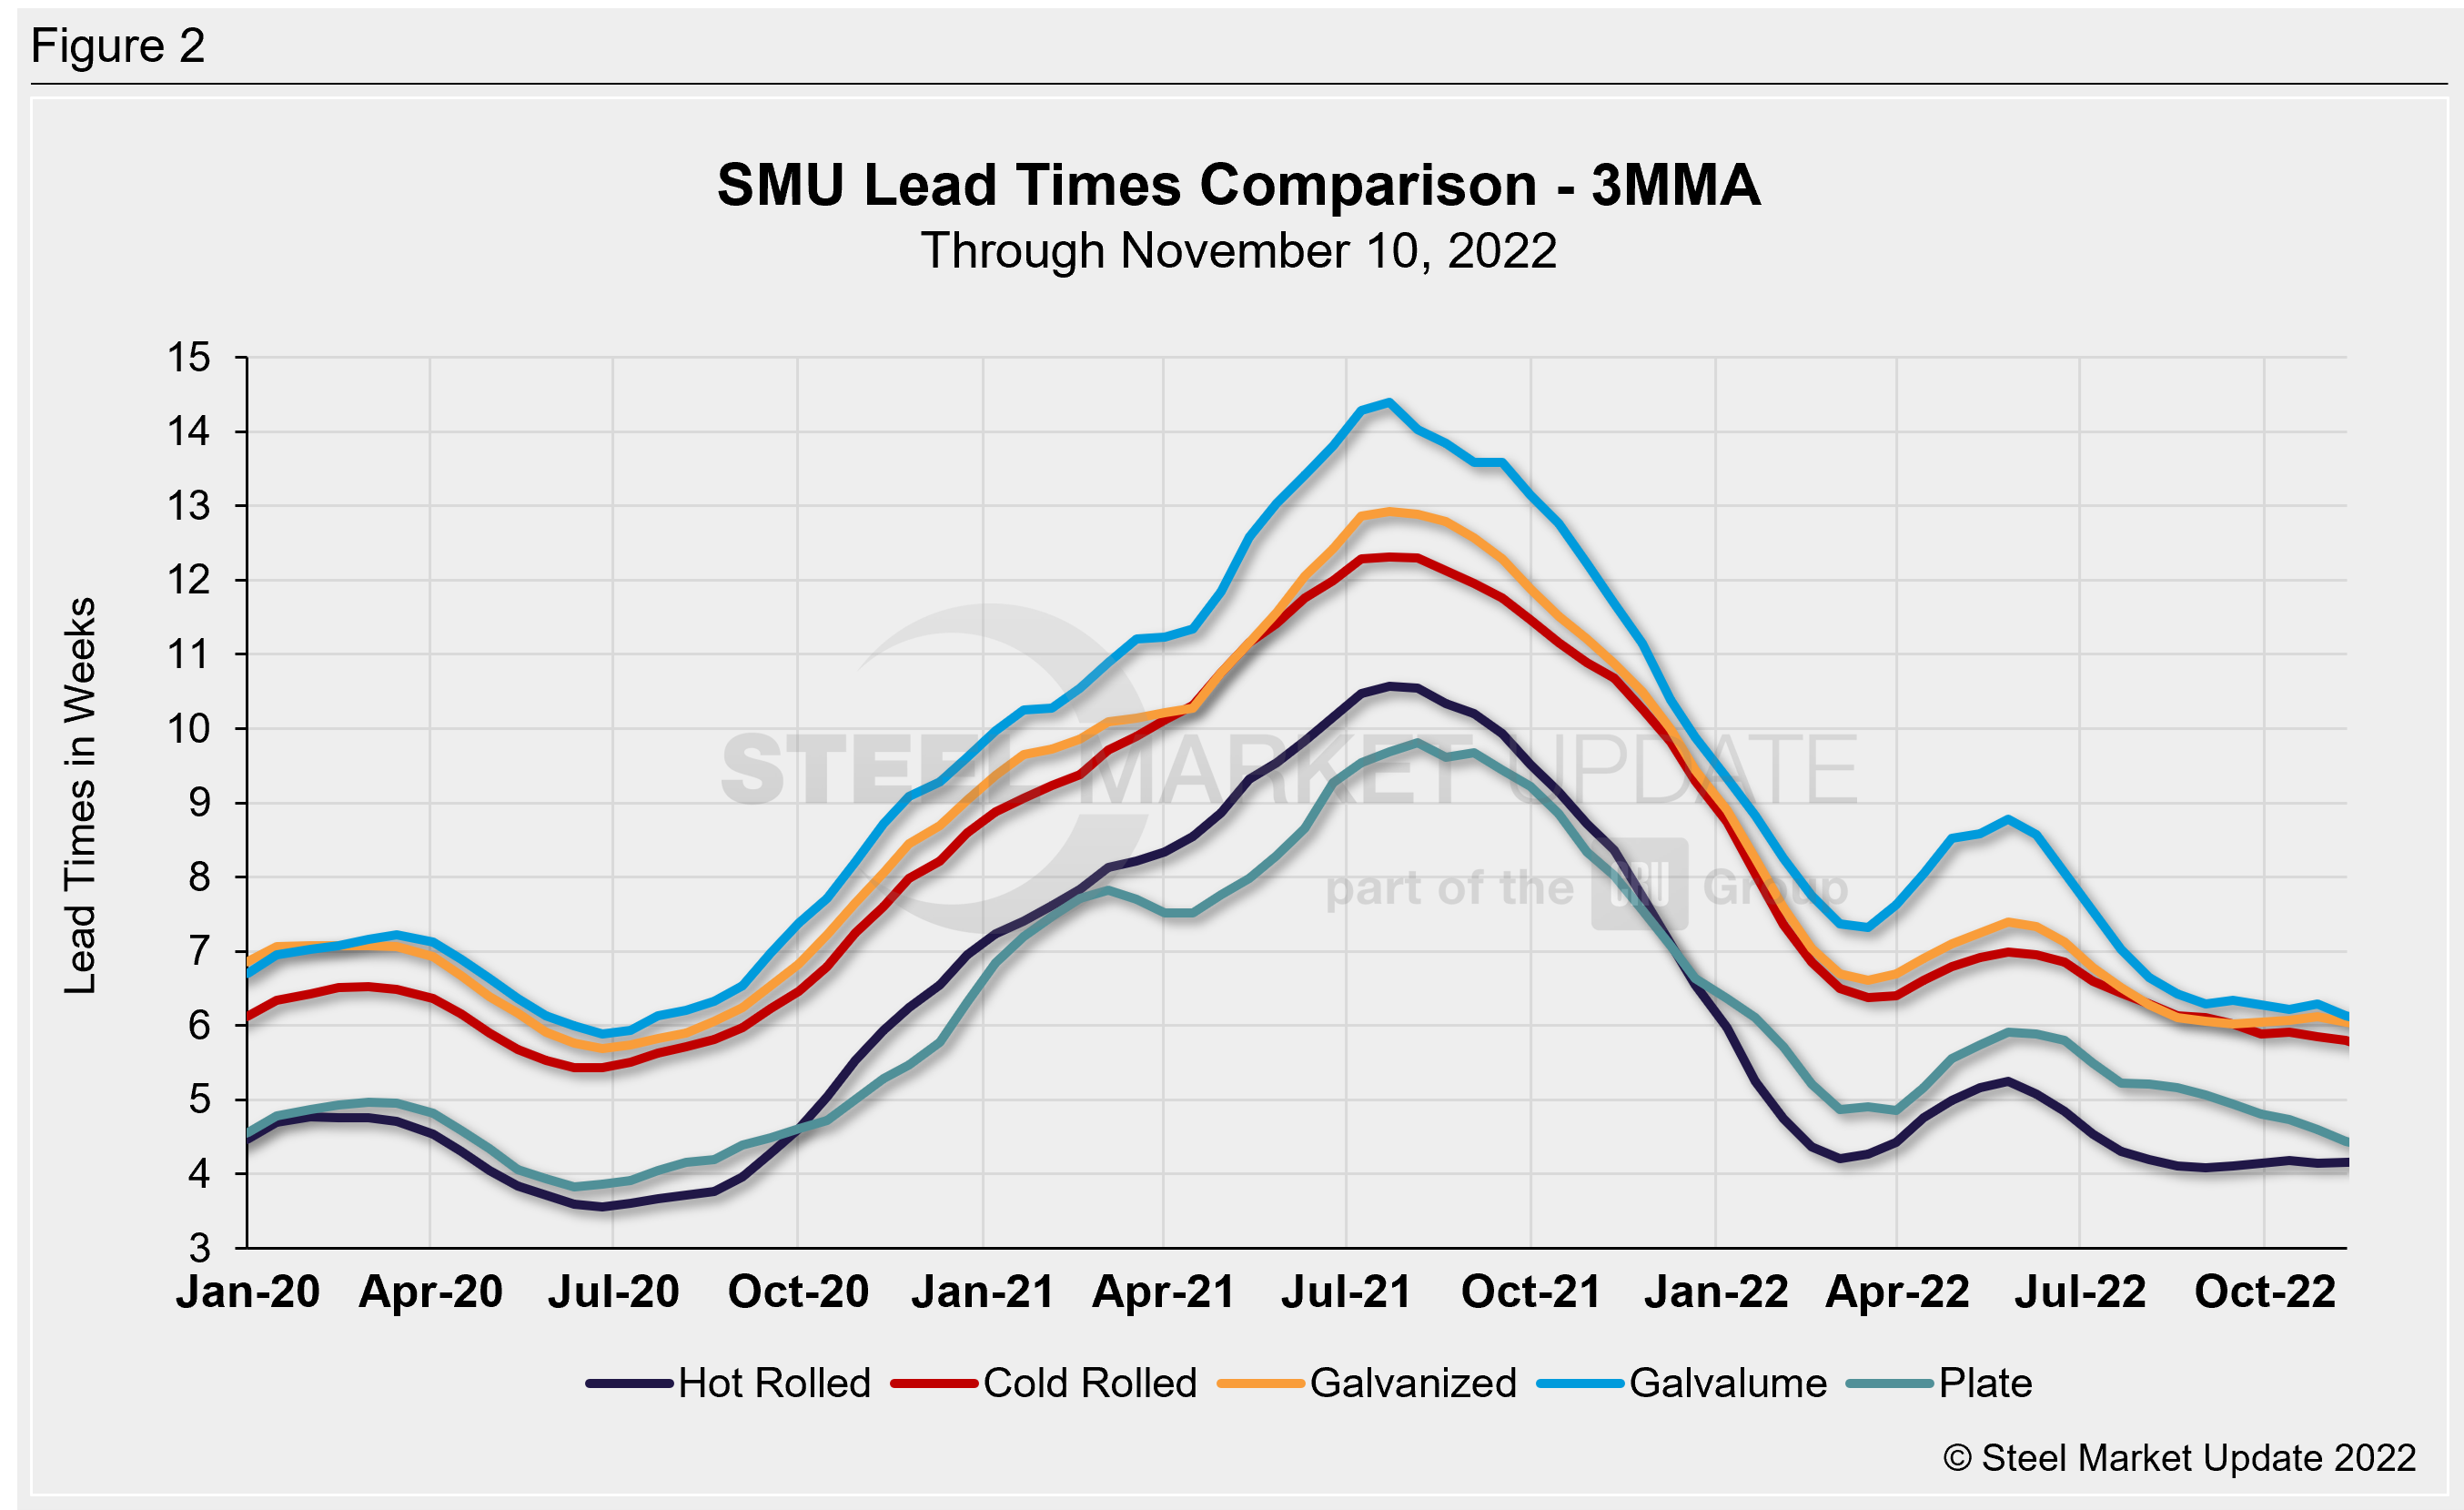
Analyzing lead times on a three-month moving average (3MMA) basis can smooth out the variability in the biweekly readings. As a 3MMA, lead times for all sheet products have been steady for the past two months, while plate lead times have trended downward since July. The latest 3MMA lead time for hot rolled rose 0.1 weeks to 4.2 weeks, and has been stable since August. Cold rolled eased 0.1 weeks to 5.8 weeks, now the shortest seen since August 2020. Galvanized lead times remained at 6.1 weeks (the mid-September 3MMA of 6.0 was the lowest level seen since August 2020). Galvalume lead times fell 0.2 weeks to 6.1 weeks, now the shortest seen since July 2020. Plate lead times shrunk by 0.2 weeks, now at 4.4 weeks, the lowest 3MMA measure recorded since September 2020.
Note: These lead times are based on the average from manufacturers and steel service centers who participated in this week’s SMU market trends analysis. SMU measures lead times as the time it takes from when an order is placed with the mill to when the order is processed and ready for shipping, not including delivery time to the buyer. Our lead times do not predict what any individual may get from any specific mill supplier. Look to your mill rep for actual lead times. To see an interactive history of our Steel Mill Lead Times data, visit our website here.
By Brett Linton, Brett@SteelMarketUpdate.com


