

Market Segment

August 10, 2023
HRC Futures: Following the Charts
Written by Dave Feldstein
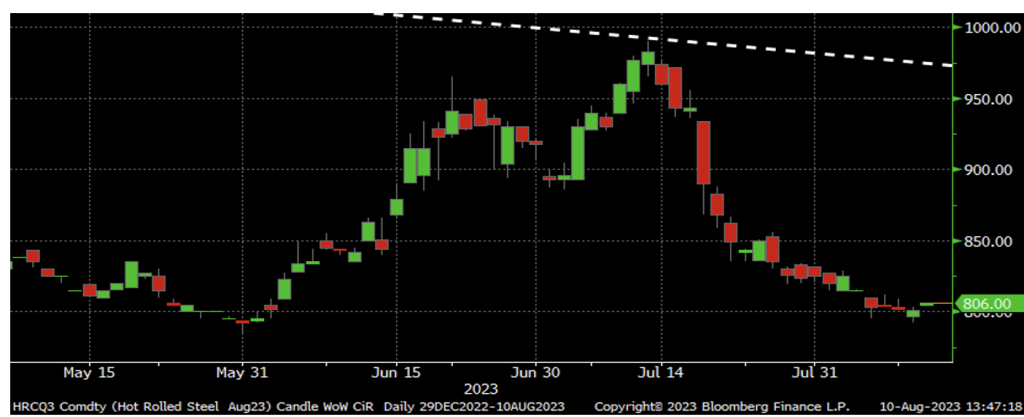
The last article I wrote on Thursday, July 13, pointed to the surprising rallies in the August and September futures, while noting the August future trading to just below its multi-year down trendline. It just so happened that July 13 was also the top for the August future, which has since plummeted $177. Basically, it did a roundtrip from $800 to $995 and back again. Indeed, it is far better to be lucky than good. There was nothing mystical about it. I was simply following the charts. So let’s get technical once again and see what the charts are telling us today.
August CME HRC Future $/st
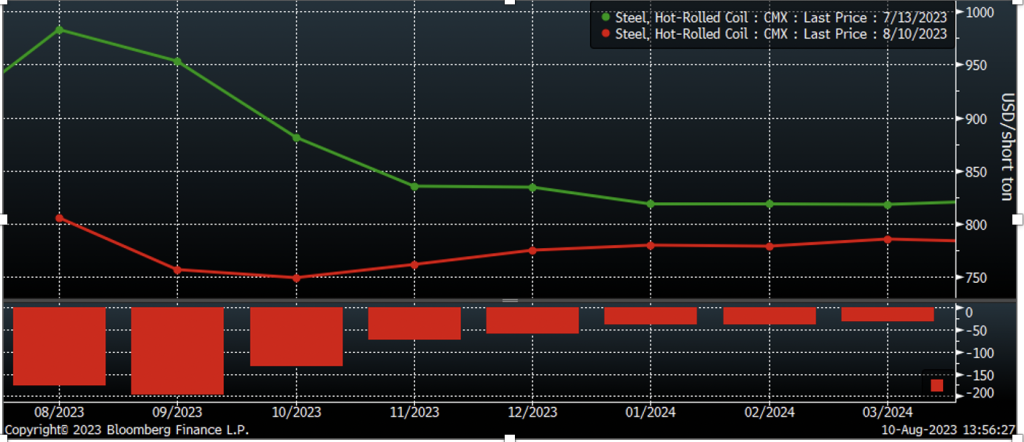
Over the past four weeks, the CME HRC futures curve has shifted from backwardation, or downward sloping, to flat and now into contango, or upward sloping. These moves were the result of aggressive selling in the front months, with September falling $196 and October $132 over the four-week period.
CME Hot Rolled Coil Futures Curve $/st
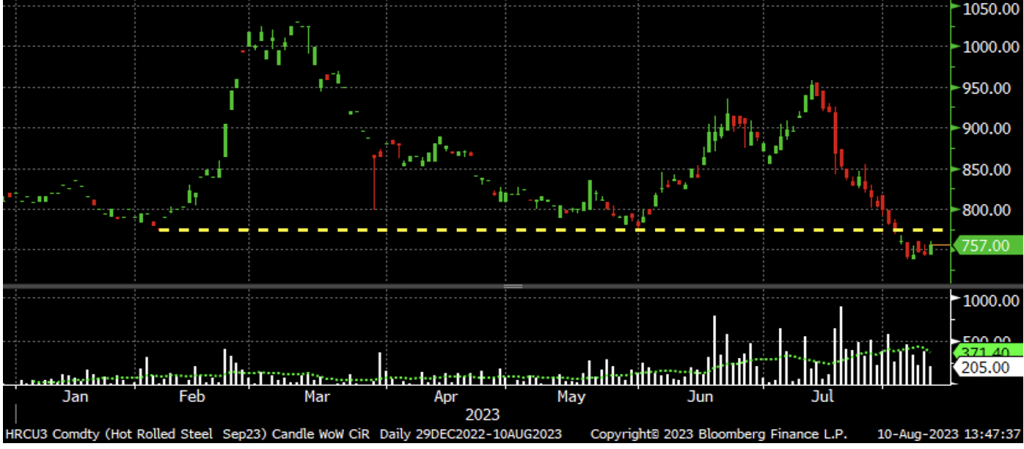
The sell-off took an important technical step further last Thursday when the September future settled below the $775 mark, a level where it had found support in May as well as February. Moreover, the September future has been trading below the $775 support level since, trading to as low as $738 last Friday. One man’s ceiling is another man’s floor, with the technical analysis books teaching that today’s broken support level become tomorrow’s resistance.
September CME HRC Future $/st
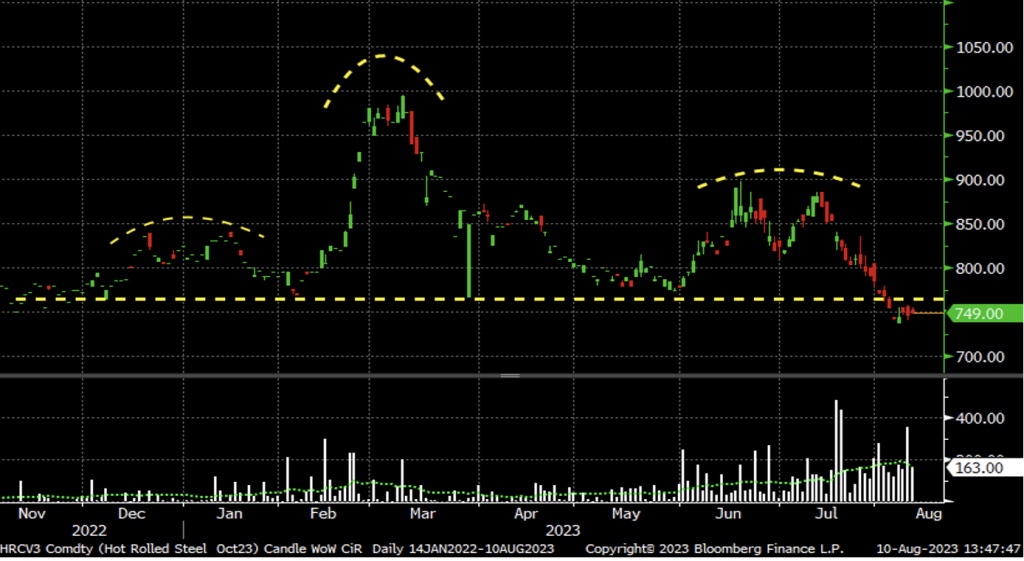
October’s chart has developed into a “head and shoulders” pattern. This pattern consists of three peaks with the 1st and 3rd below the 2nd and a “neckline” that acts as a support level. Once the security trades below the neckline, the head and shoulders pattern is triggered, predicting a trend reversal from bull to bear market. An increase in trading volume bolsters the reliability of this pattern. The October HRC future checks all of these boxes.
October CME HRC Future $/st
Open interest is the number of outstanding futures contracts, or tons in this case, across a product’s curve. This chart shows the rolling 2nd month Midwest HRC futures contract in white, with open interest in red, and a 22-day moving average of open interest in yellow. The shark-like teeth look to open-interest is due to the expiration of the front month future, which usually holds the most open interest of any individual month. Open interest has been falling since peaking in March. This means the current bear trend is a “technically weak” bear market due to the contraction in open interest.
Rolling 2nd Month CME HRC Future $/st & Open Interest (red) (22-day M.A. ylw)
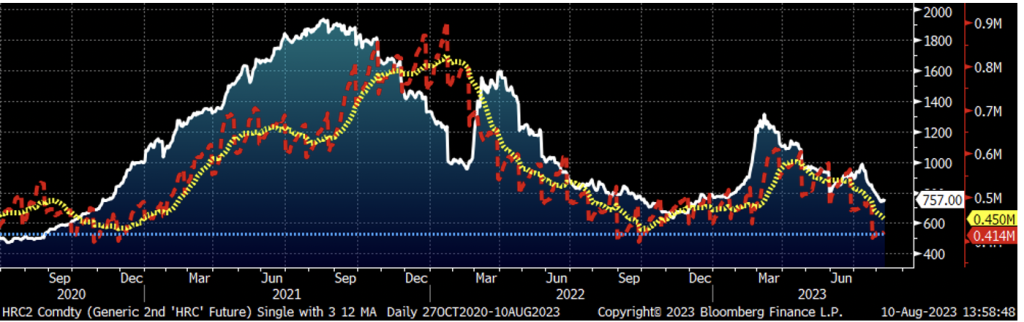
However, the fact that open interest has fallen to 414k tons near the lows not seen since last September and Q4’20, coupled with data from the “Commitment of Traders” (COT) report, reveals important information. This is something that could predict the next leg of the futures market. If you dig into the COT report, you will see it breaks market participants into four categories: commercial, swap dealers, managed money, and other, and shows their aggregated long and short positions. The commercial category, specifically producer/merchant/processor/user, shows this group to be short 306,300 tons. Open interest near recent lows with commercials shorts of only 306k tons tells us that this group is relatively underhedged. This leads to a line of questions. If the chart patterns discussed above prove to be accurate, will there be a mad rush by service centers and importers to sell futures? If so, will we see the same frenzied short-squeeze type trading of March 2022 and 2023, but to the downside? If so, will we see our managed money friends, especially our buddy the one-lot bandit, attempt to get ahead of this group by selling first and pressuring the futures lower?
As noted in previous articles, the futures are simply the tail wagging the (physical) dog. The physical market will ultimately drive futures prices and settlements. Technical analysis is another form of quantitative analysis dependent on data from the past to predict what happens next. As seen a number of times over the last few years, an unpredictable event of enormous magnitude can occur, shocking the market’s fundamentals and technicals. By definition, those events are unpredictable. Thus, we must work with what we can see.
I like to say “keep an open mind” about prices. Will HRC test last year’s low of $621? Could it fall to a new low? I have had these discussions and a common response has to do with domestic mill’s costs, specifically scrap. Scrap will move with iron ore and iron ore is directly affected by China’s steel market. There was a brief and fleeting moment of optimism in mid-July that China’s government was going to save the day with one of their good old-fashioned shock-and-awe economic stimulus packages. That has not manifested, while China’s economic data continues to rapidly deteriorate.
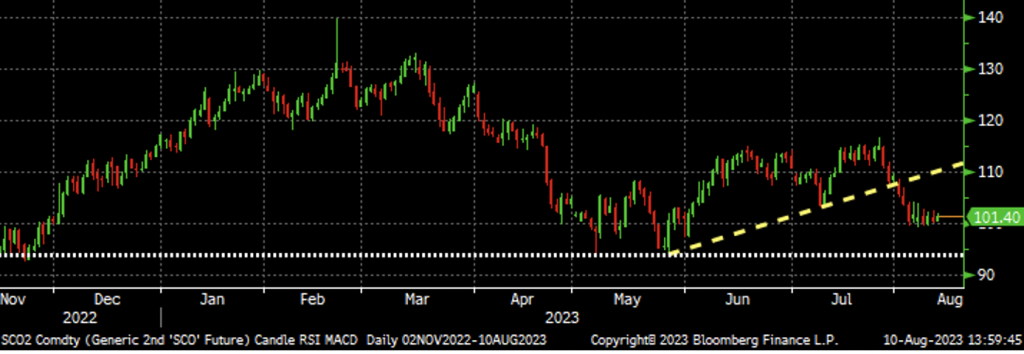
Iron ore rebounded from May’s lows around $95 back to $115 by mid-June. The rally lost momentum, falling back to around $103 on July 10 before being lifted back to $115 fueled by said optimism. However, it has since fallen back to the $100 area this week while breaking below its nascent up trendline. Keep an eye on the $90-95 support level, for if ore breaks below it, just like in examples above, it will likely have to fall sharply to a level that entices buyers to step back in. Why do we care? If ore falls, Turkish scrap and busheling will likely go down with it. Once again, keep an open mind about prices.
Rolling 2nd Month SGX Iron Ore Future $ /mt
Disclaimer: The content of this article is for informational purposes only. The views in this article do not represent financial services or advice. Any opinion expressed by Mr. Feldstein should not be treated as a specific inducement to make a particular investment or follow a particular strategy, but only as an expression of his opinion. Views and forecasts expressed are as of date indicated, are subject to change without notice, may not come to be and do not represent a recommendation or offer of any particular security, strategy or investment. Strategies mentioned may not be suitable for you. You must make an independent decision regarding investments or strategies mentioned in this article. It is recommended you consider your own particular circumstances and seek the advice from a financial professional before taking action in financial markets.


