Market Data
August 31, 2023
Steel Buyers Sentiment Indices Fall
Written by Ethan Bernard
SMU’s Current and Future Steel Buyers Sentiment Indices both edged down this week, based on our most recent survey data.
Every other week we poll steel buyers about sentiment. The Steel Buyers Sentiment Indices measure how steel buyers feel about their company’s chances of success in the current market, as well as three to six months down the road. We have historical data going back to 2008. Check our interactive graphing tool here.
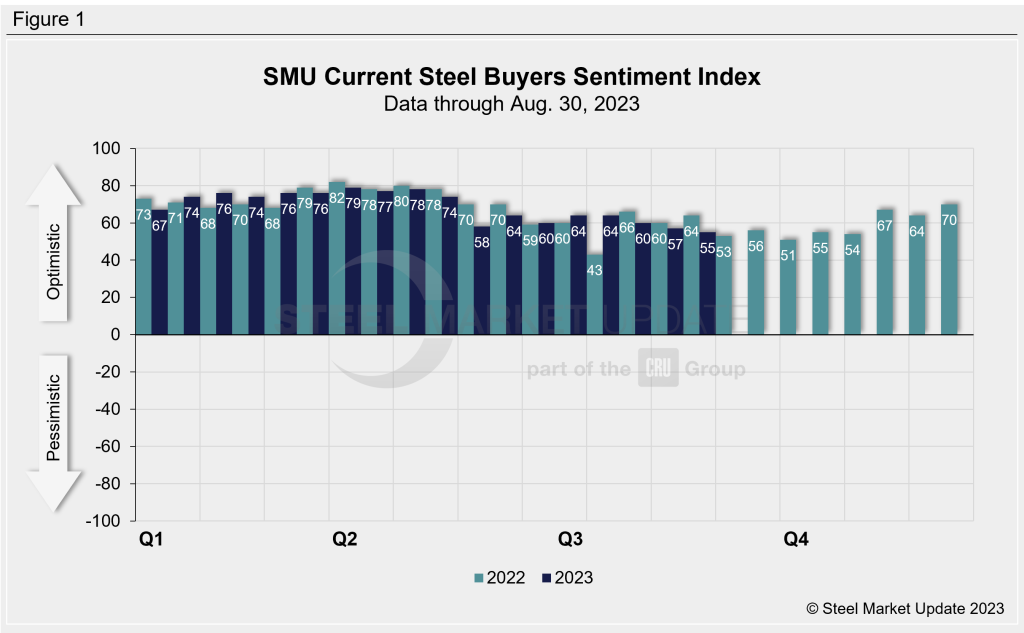
SMU’s Current Buyers Sentiment Index stood at +55 this week, down from +57 two weeks prior (Fig. 1). This marks the third consecutive decline and the lowest reading this year.
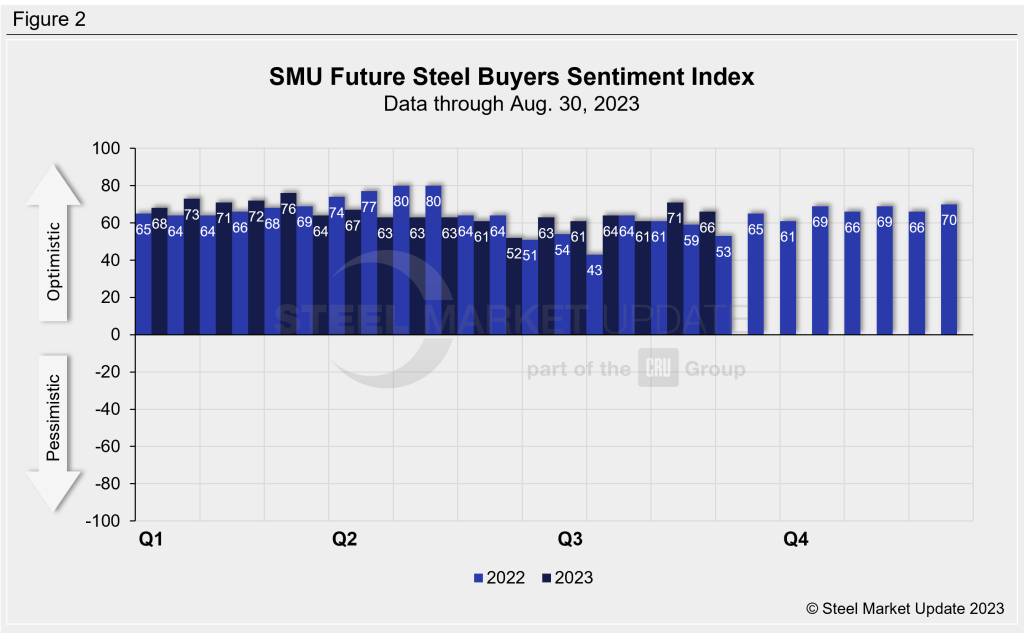
SMU’s Future Buyers Sentiment Index measures buyers’ feelings about business conditions three to six months in the future. This week, the index dropped to +66 from +71 two weeks earlier (Fig. 2). After briefly rising above +70 at the previous check, we’ll see if this current reading is just a blip, or more of a downward trend.
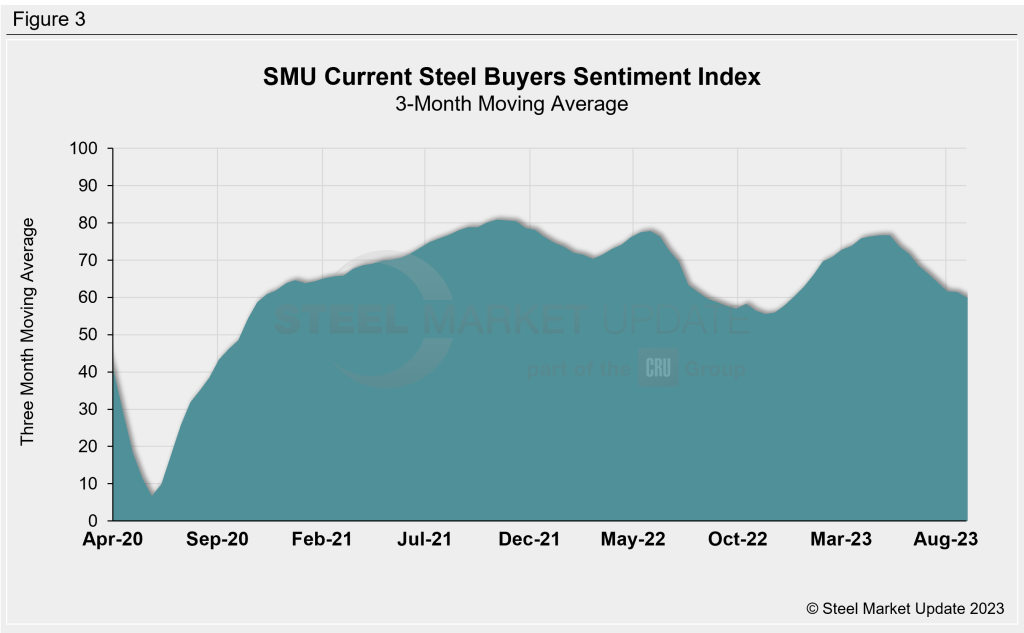
Measured as a three-month moving average, the Current Sentiment 3MMA slipped to +60.00 vs. +61.50 at the last market check. (Fig. 3).
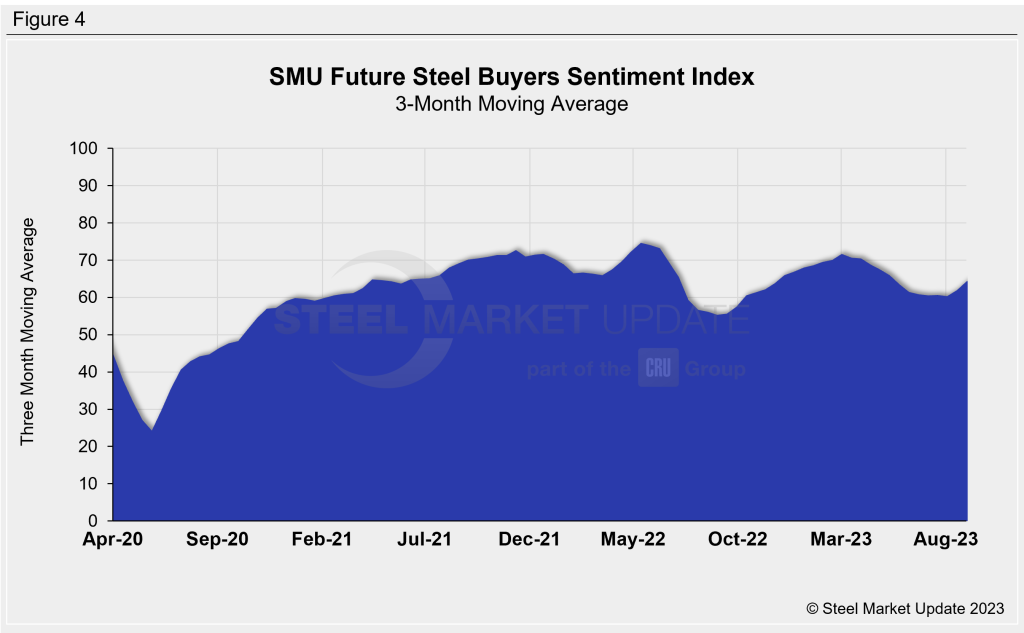
This week’s Future Sentiment 3MMA rose to +64.33 from +62.00 two weeks earlier (Fig. 4).
What SMU Survey Respondents Had to Say:
-“Despite the turbulence, we have adapted to the market.”
-“We will be challenged still.”
-“We believe that we can exceed the established sales goals of the company.”
-“The future is cloudy and unclear as of now.”
-“We aren’t expecting pricing to go up anytime soon, so our outlook is positive.”
-“Buyers are now actively reducing their inventory.”
About the SMU Steel Buyers Sentiment Index
The SMU Steel Buyers Sentiment Index measures the attitude of buyers and sellers of flat-rolled steel products in North America. It is a proprietary product developed by Steel Market Update for the North American steel industry. Tracking steel buyers’ sentiment is helpful in predicting their future behavior.
Positive readings run from +10 to +100. A positive reading means the meter on the right-hand side of our home page will fall in the green area indicating optimistic sentiment. Negative readings run from -10 to -100. They result in the meter on our homepage trending into the red, indicating pessimistic sentiment. A reading of “0” (+/- 10) indicates a neutral sentiment (or slightly optimistic or pessimistic), which is most likely an indicator of a shift occurring in the marketplace. Sentiment is measured via SMU surveys twice per month.