SMU Data and Models
Imports decline for a second consecutive year in 2023
Written by Laura Miller
February 8, 2024
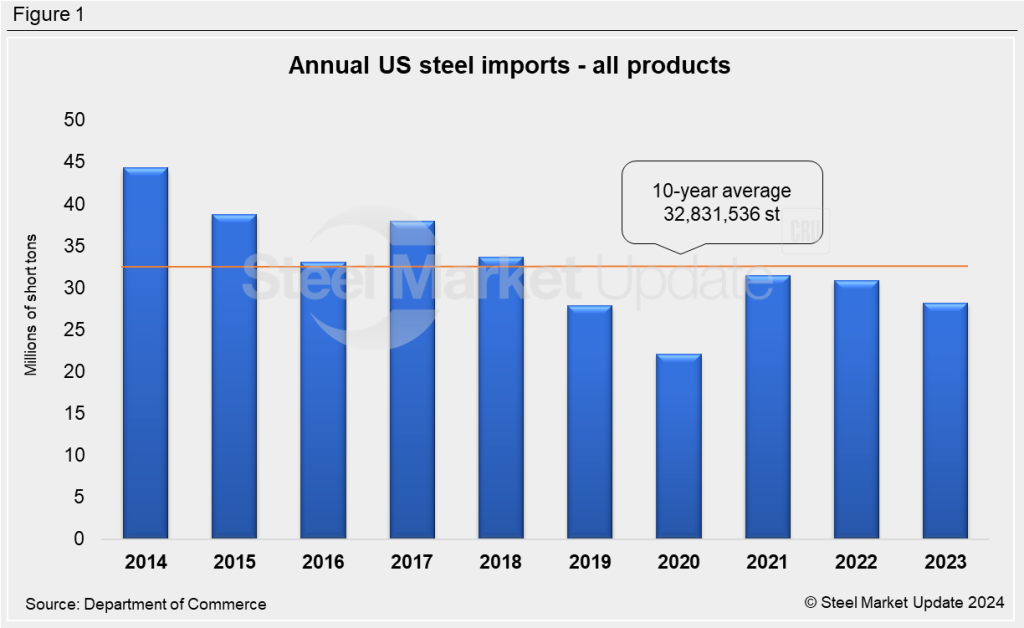
2023 was the third-lowest year for steel imports in the last decade, according to an SMU analysis of data from the US Department of Commerce.
Steel imports into the US declined for the second year in a row, falling 9% from 2022 and 32% from 2021 to 28,187,800 short tons (st) in 2023. This includes semi-finished and finished carbon, alloy, and stainless steel products.
Over the past 10 years, only 2020 and 2019 saw fewer imports, with 22,081,660 st and 27,868,850 st, respectively.
2023’s imports were 14% below the last decade’s annual average of 32,831,536 st.
Figure 1 below shows import levels were lower in the latter half of the decade.
![](https://www.steelmarketupdate.com/wp-content/uploads/sites/2/2024/02/02.07.24_Imports_1-1024x628.png)
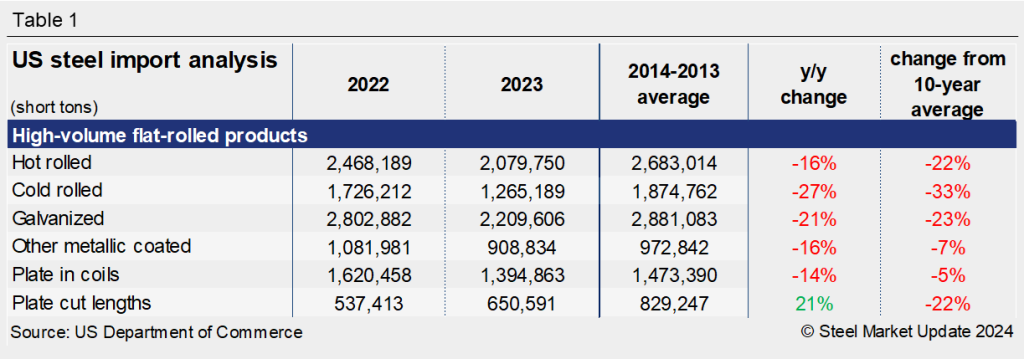
When looking at flat-rolled steel imports, 2023 was not a special year. Of the six major flat-rolled steel categories, all were lower year over year (y/y), except for cut-to-length (CTL) plate.
![](https://www.steelmarketupdate.com/wp-content/uploads/sites/2/2024/02/02.07.24_Imports_2____-1024x627.png)
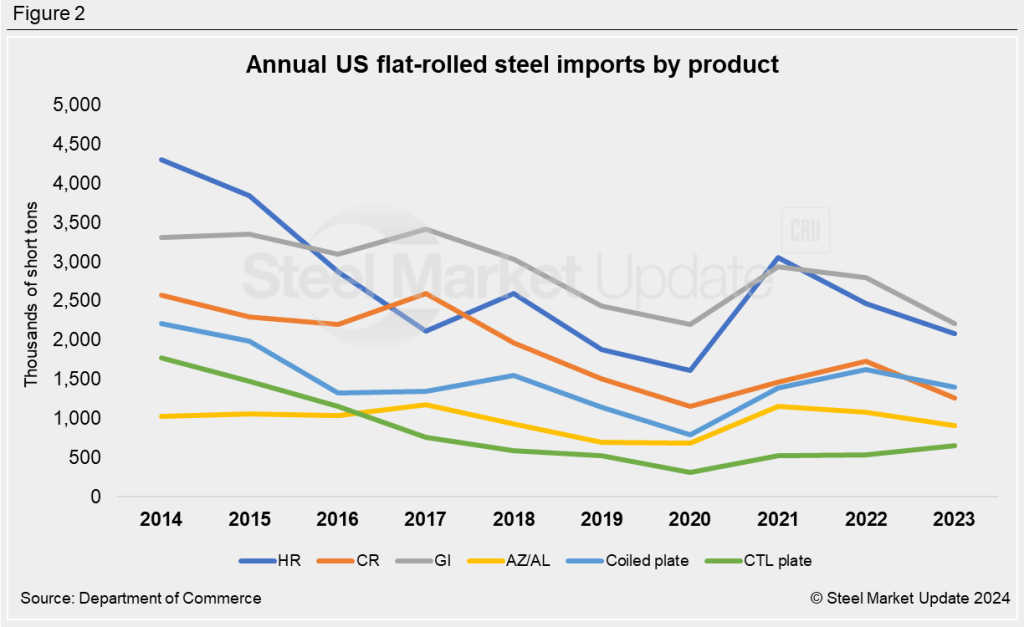
While the other categories saw double-digit y/y declines, cut plate imports rose 21% to a five-year high of almost 650,600 st. Canada and South Korea were the top suppliers, supplying 37% and 34%, respectively, of total CTL plate imports in 2023. Malaysia was the next at 5%, followed by Sweden and Australia, both at 4%.
Compared to their 10-year averages, imports of all the major flat rolled categories were lower (Table 1).
![](https://www.steelmarketupdate.com/wp-content/uploads/sites/2/2024/02/02.07.24_Imports_3____3-1024x359.png)
![](https://www.steelmarketupdate.com/wp-content/uploads/sites/2/2024/02/SMU_LM_headshot.png.jpg-150x150.png)
Laura Miller
Read more from Laura MillerLatest in SMU Data and Models
![](https://www.steelmarketupdate.com/wp-content/uploads/sites/2/images/Featured_News_Icons/Premium1.png)
Steelmaking raw material prices ease in July
The majority of steelmaking raw material prices declined in June, following the same trend seen in May, according to SMU’s latest analysis.
![](https://www.steelmarketupdate.com/wp-content/uploads/sites/2/2024/01/cropped-SMU_Mobile_final.png)
SMU price ranges: HR declines moderate. Are we near a bottom?
SMU’s sheet price ranges slid again this week. But the declines were more pronounced on tandem products whereas prices for hot-rolled coil held roughly steady.
![](https://www.steelmarketupdate.com/wp-content/uploads/sites/2/images/Featured_News_Icons/Premium1.png)
Some SMU Key Market Indicators improve, others remain near historic lows
SMU’s Key Market Indicators include data on the economy, raw materials, manufacturing, construction, and steel sheet and long products. They offer a snapshot of current sentiment and the near-term expected trajectory of the economy. All told, nine key indicators point lower, 16 are neutral, and 13 point higher. One thing worth noting: The nine indicators pointing lower are all lagging indicators. Many of those pointing upward are leading indicators.
![](https://www.steelmarketupdate.com/wp-content/uploads/sites/2/2024/01/cropped-SMU_Mobile_final.png)
SMU survey: Steel Buyers’ Sentiment Indices rebound
SMU’s Steel Buyers’ Sentiment Indices both saw improvement this week. Current sentiment ticked higher but remains near the four-year low seen earlier this month. Future Sentiment continues to indicate that buyers are optimistic for future business conditions.
![](https://www.steelmarketupdate.com/wp-content/uploads/sites/2/images/Featured_News_Icons/Premium1.png)
SMU market survey results now available
The latest SMU market survey results are now available on our website to all premium members. After logging in at steelmarketupdate.com, visit the pricing and analysis tab and look under the “survey results” section for “latest survey results.” Historical survey results are also available under that selection. If you need help accessing the survey results, or if your […]