

Market Data

May 18, 2026
Apparent steel supply jumped to an 8-month high in March
Written by Brett Linton
The amount of finished steel that entered the US market surged 11% from February to March, according to SMU’s analysis of recent Department of Commerce and American Iron and Steel Institute (AISI) data. This marks the largest month-to-month gain recorded in a year.
Dubbed apparent steel supply, this metric is calculated by combining domestic mill shipments and finished US steel imports, then subtracting total US exports.
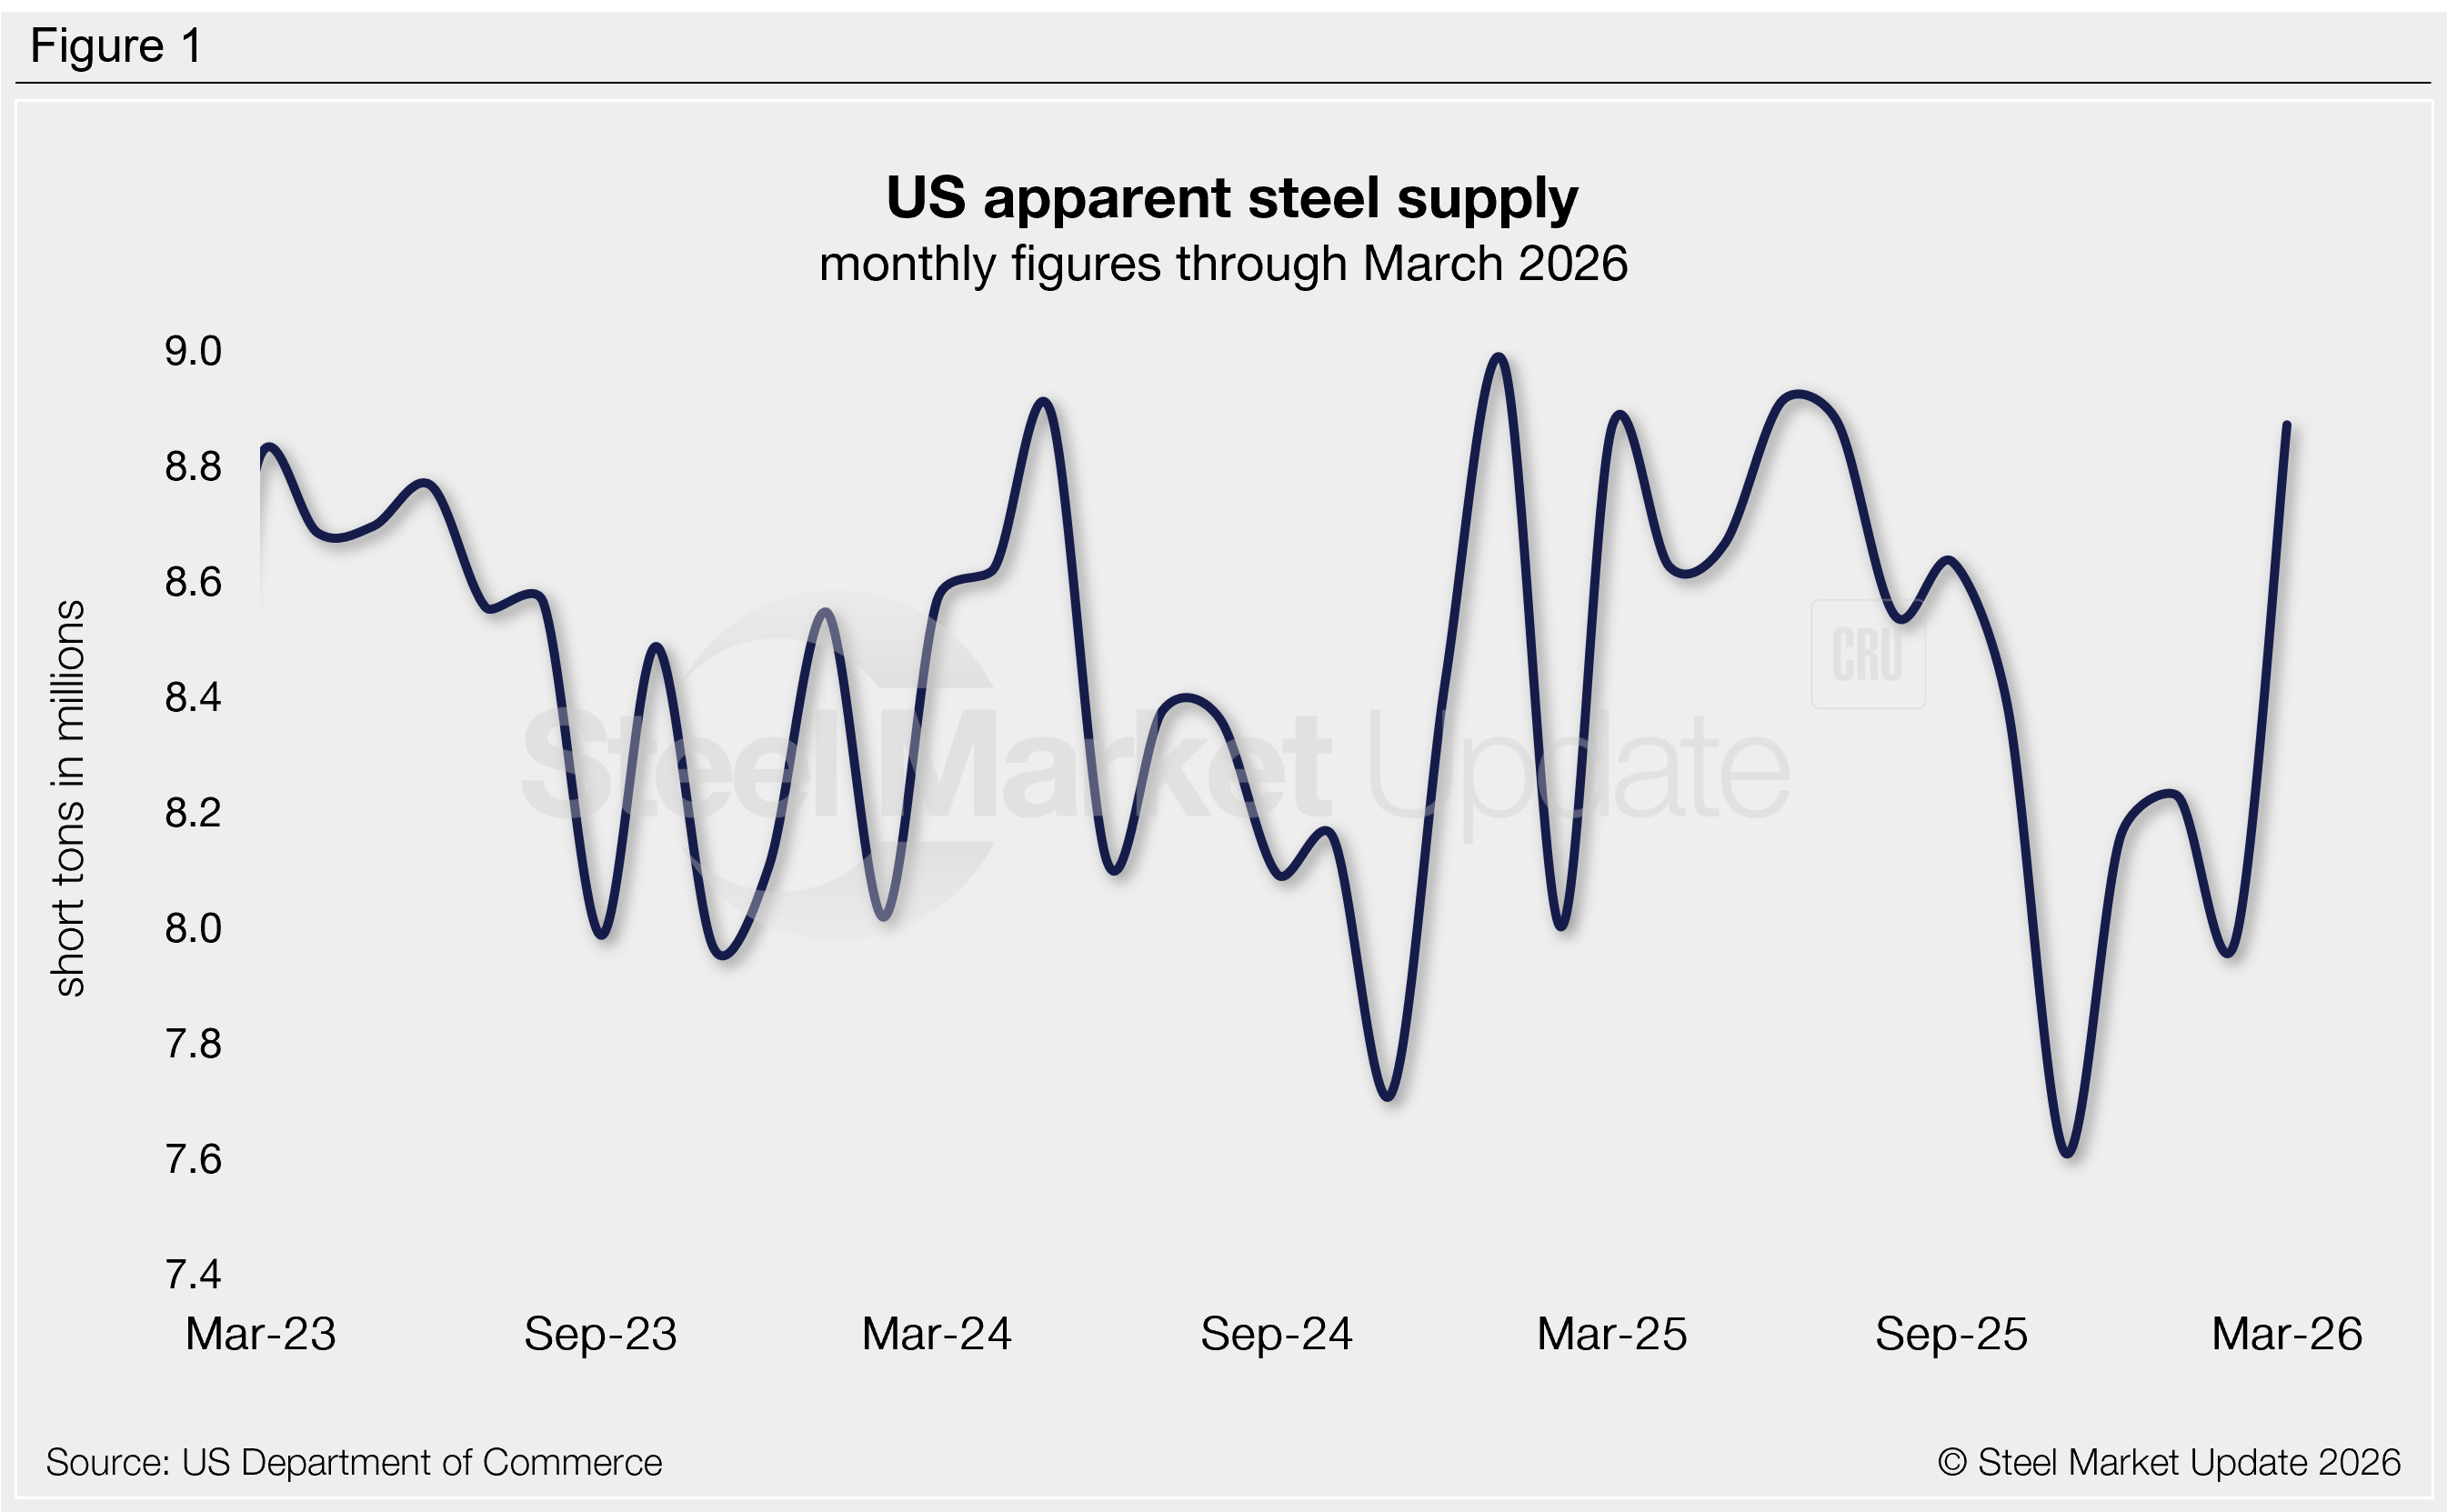
March supply increased 895,000 short tons (st) from February to 8.87 million st, the highest rate recorded since July 2025 (Figure 1). Supply shifted from one of the lower rates recorded in recent years to one of the higher ones. The March rebound was primarily attributed to a jump in domestic shipments, followed by an increase in finished imports.
Across the prior three years, we have seen supply rise as high as 8.98 million st (January 2025) and shrink as low as 7.61 million st (December 2025). For comparison, the highest measure recorded in our 15-year data history was 10.90 million st in 2014 and the lowest was 6.52 million st in 2020.
Trends
To better highlight trends, supply can be calculated on a three-month moving average (3MMA) basis to smooth out monthly fluctuations. Following the 14-month low rate of 8.00 million st reached in January, the 3MMA has increased each of the last two months, rising to 8.36 million st through March (Figure 2).
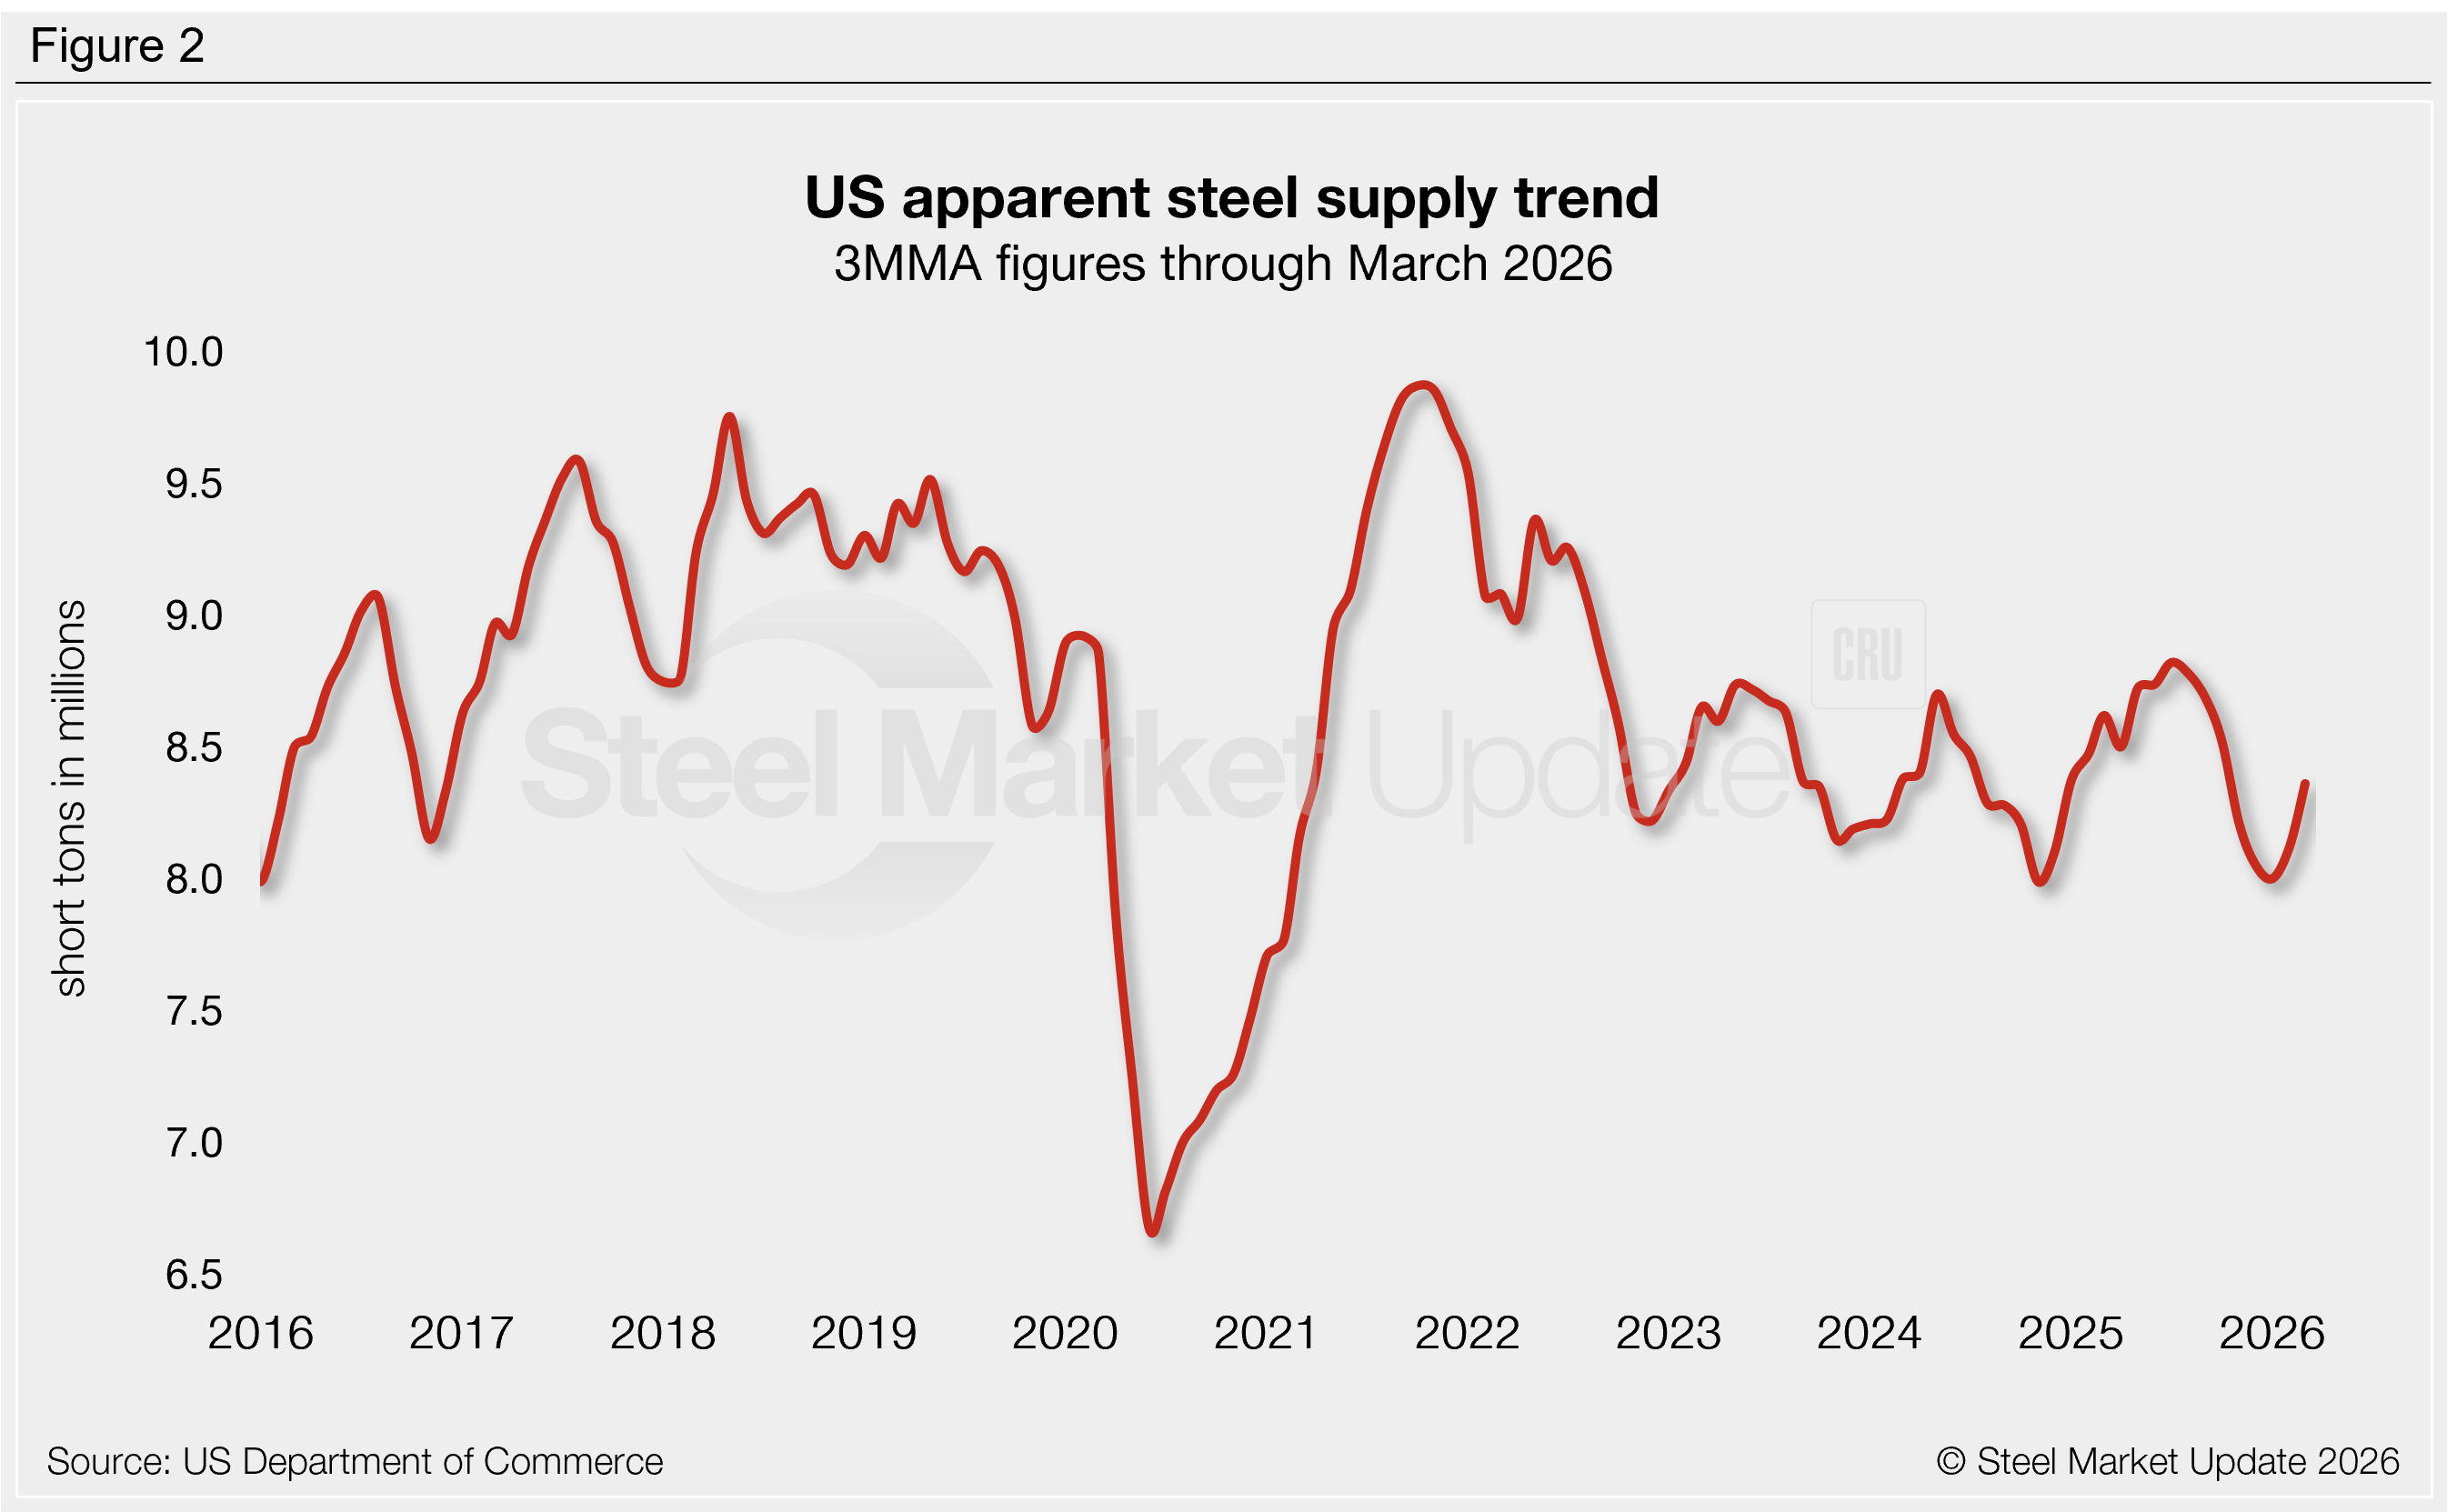
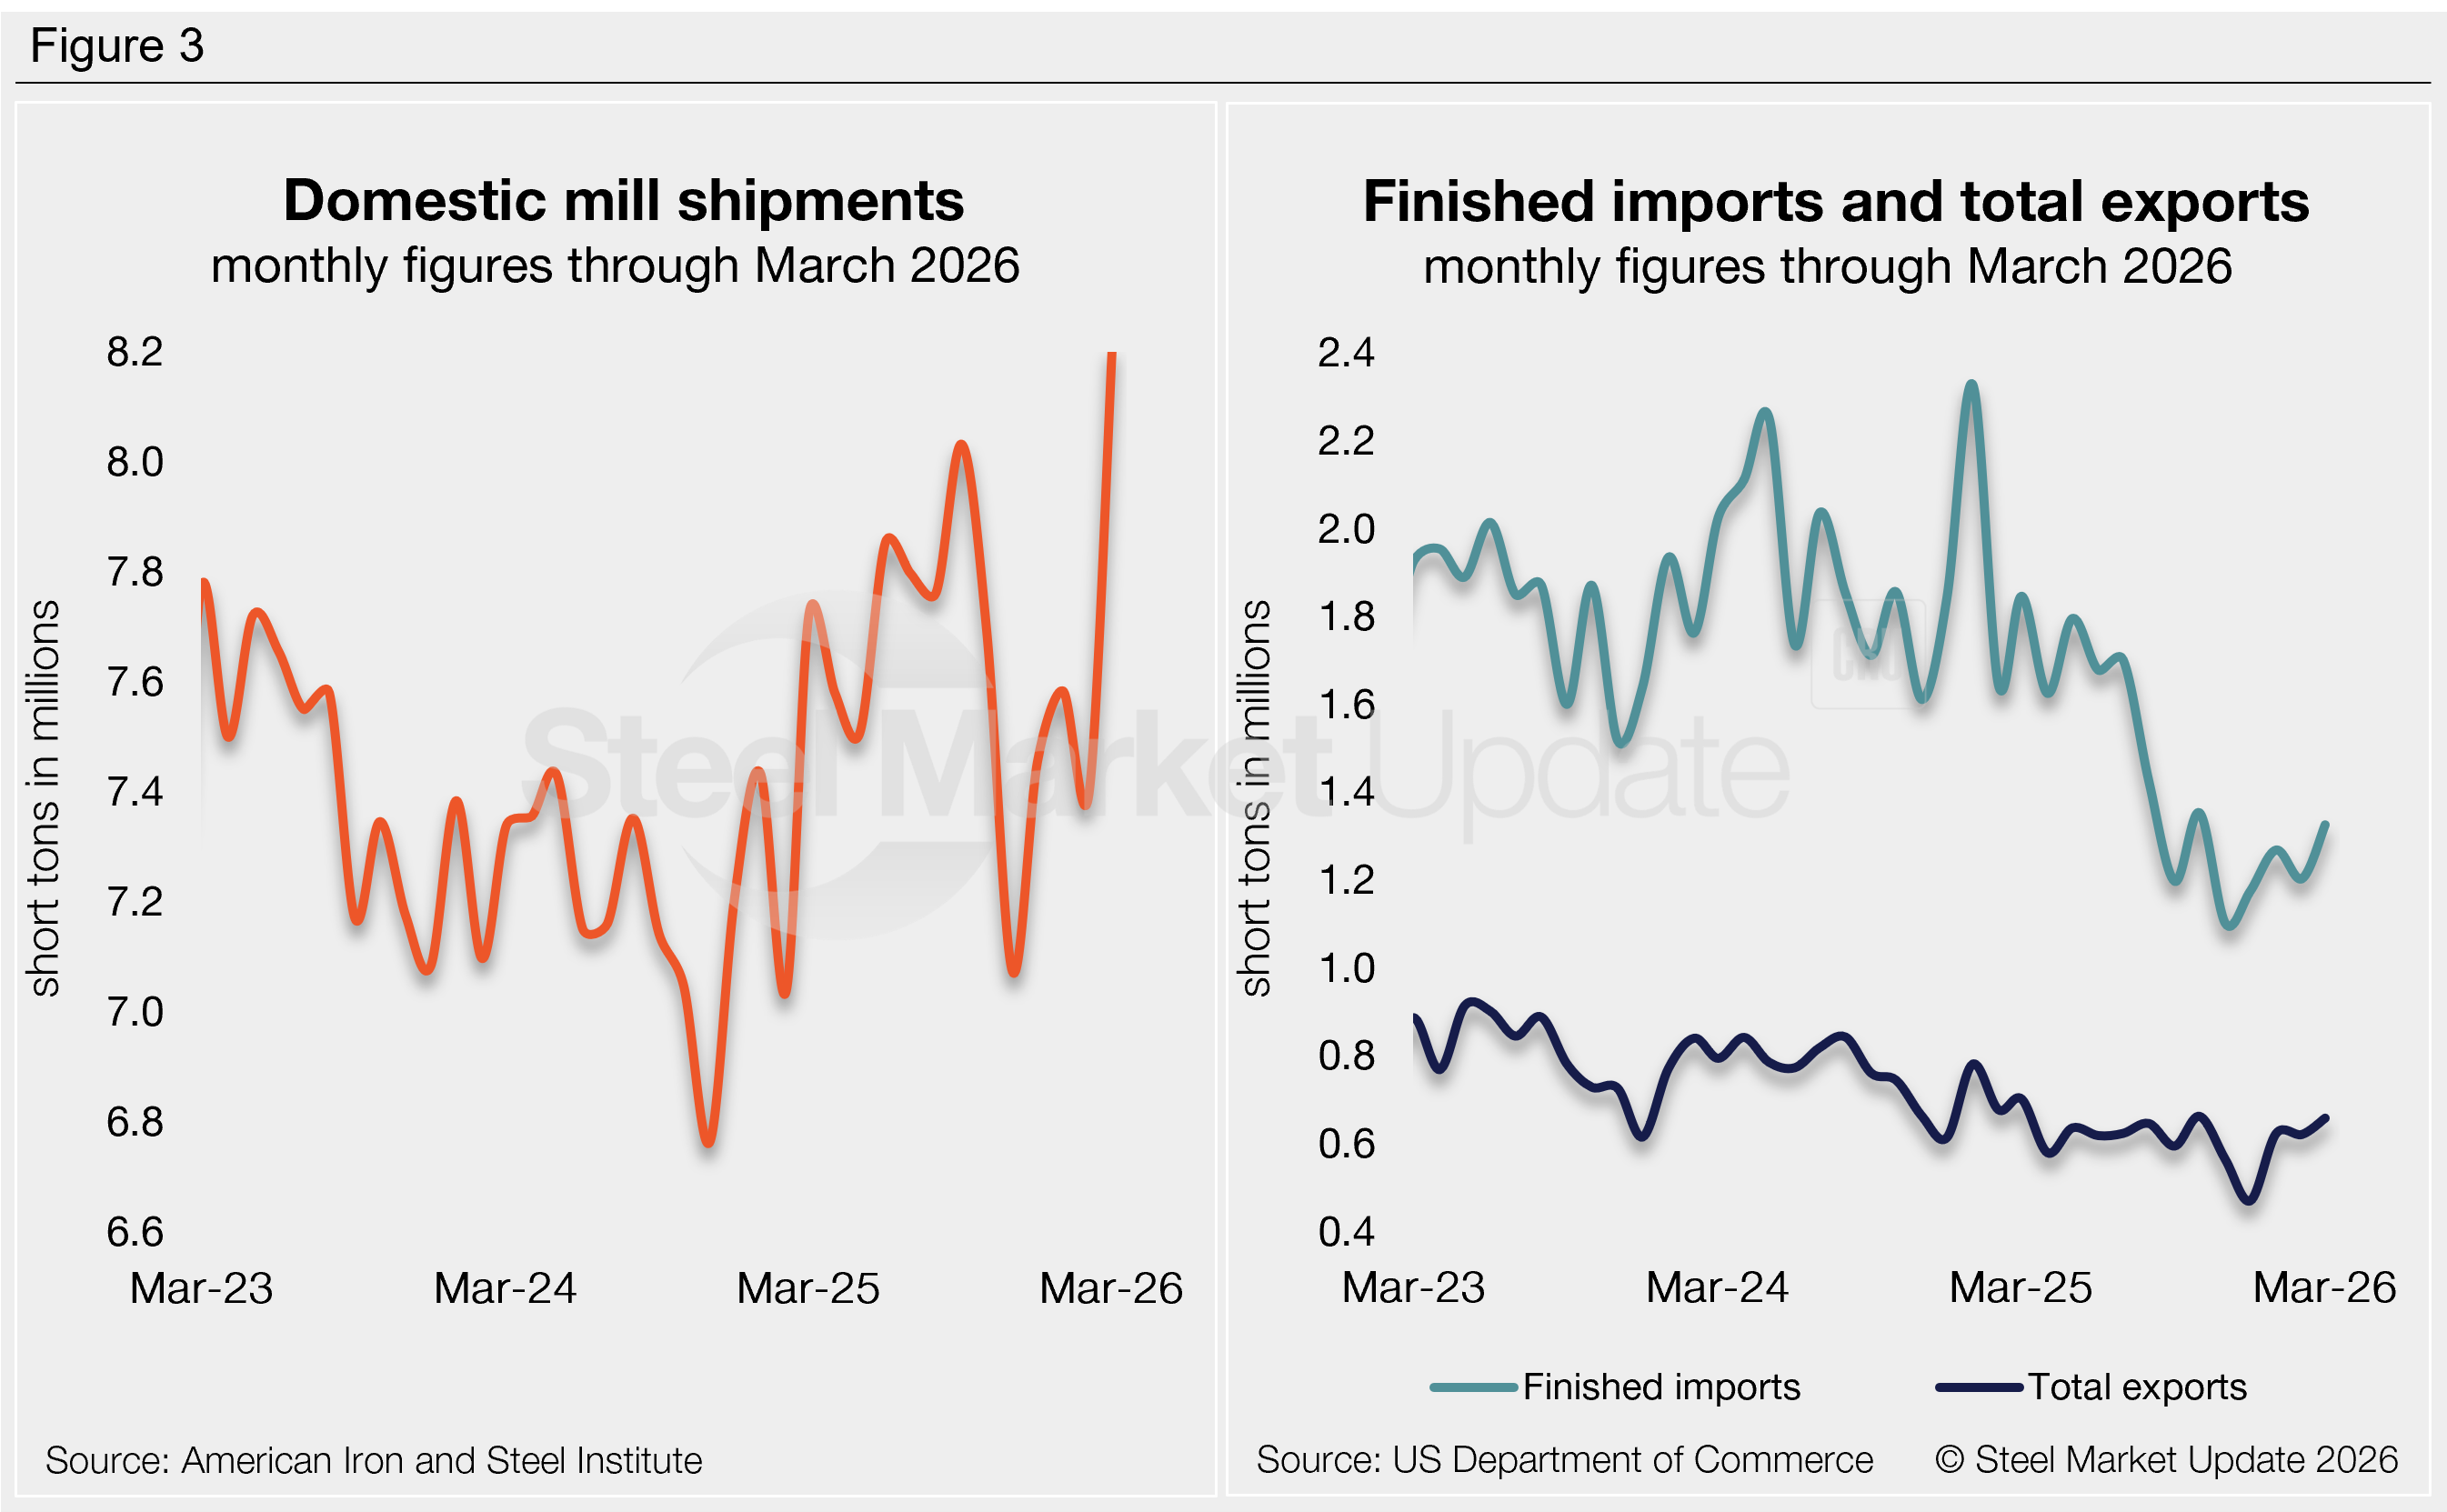
Figure 3 shows the individual components of apparent supply and their changes from February to March:
– Domestic shipments jumped 809,000 st month over month (m/m) (11%) to a four-year high of 8.20 million st, accounting for 92% of total supply.
– Finished steel imports increased 123,000 st (10%) to 1.33 million st. This marked a five-month high but remains low compared to recent years. The latest license data shows a further 7% increase in April.
– Steel exports increased 37,000 st (6%) to a five-month high of 658,000 st, recovering from near historical lows.
– Net imports (finished imports minus exports) made up 8% of March’s supply. This rate has been historically low for the last eight months (it had averaged 13% in the prior two years).
To see an interactive graphic of our apparent steel supply history, click here. If you need any assistance logging into or navigating the website, contact us at smu@crugroup.com.


