Long Products

June 16, 2026
Apparent steel supply edges lower in April on reduced mill shipments
Written by Brett Linton
The volume of finished steel that entered the US market slipped 5% from March to April, according to SMU’s analysis of recent Department of Commerce and American Iron and Steel Institute (AISI) data.
Referred to as “apparent steel supply,” this proxy for US steel demand is calculated by combining domestic mill shipments and finished US steel imports, then subtracting total US exports.
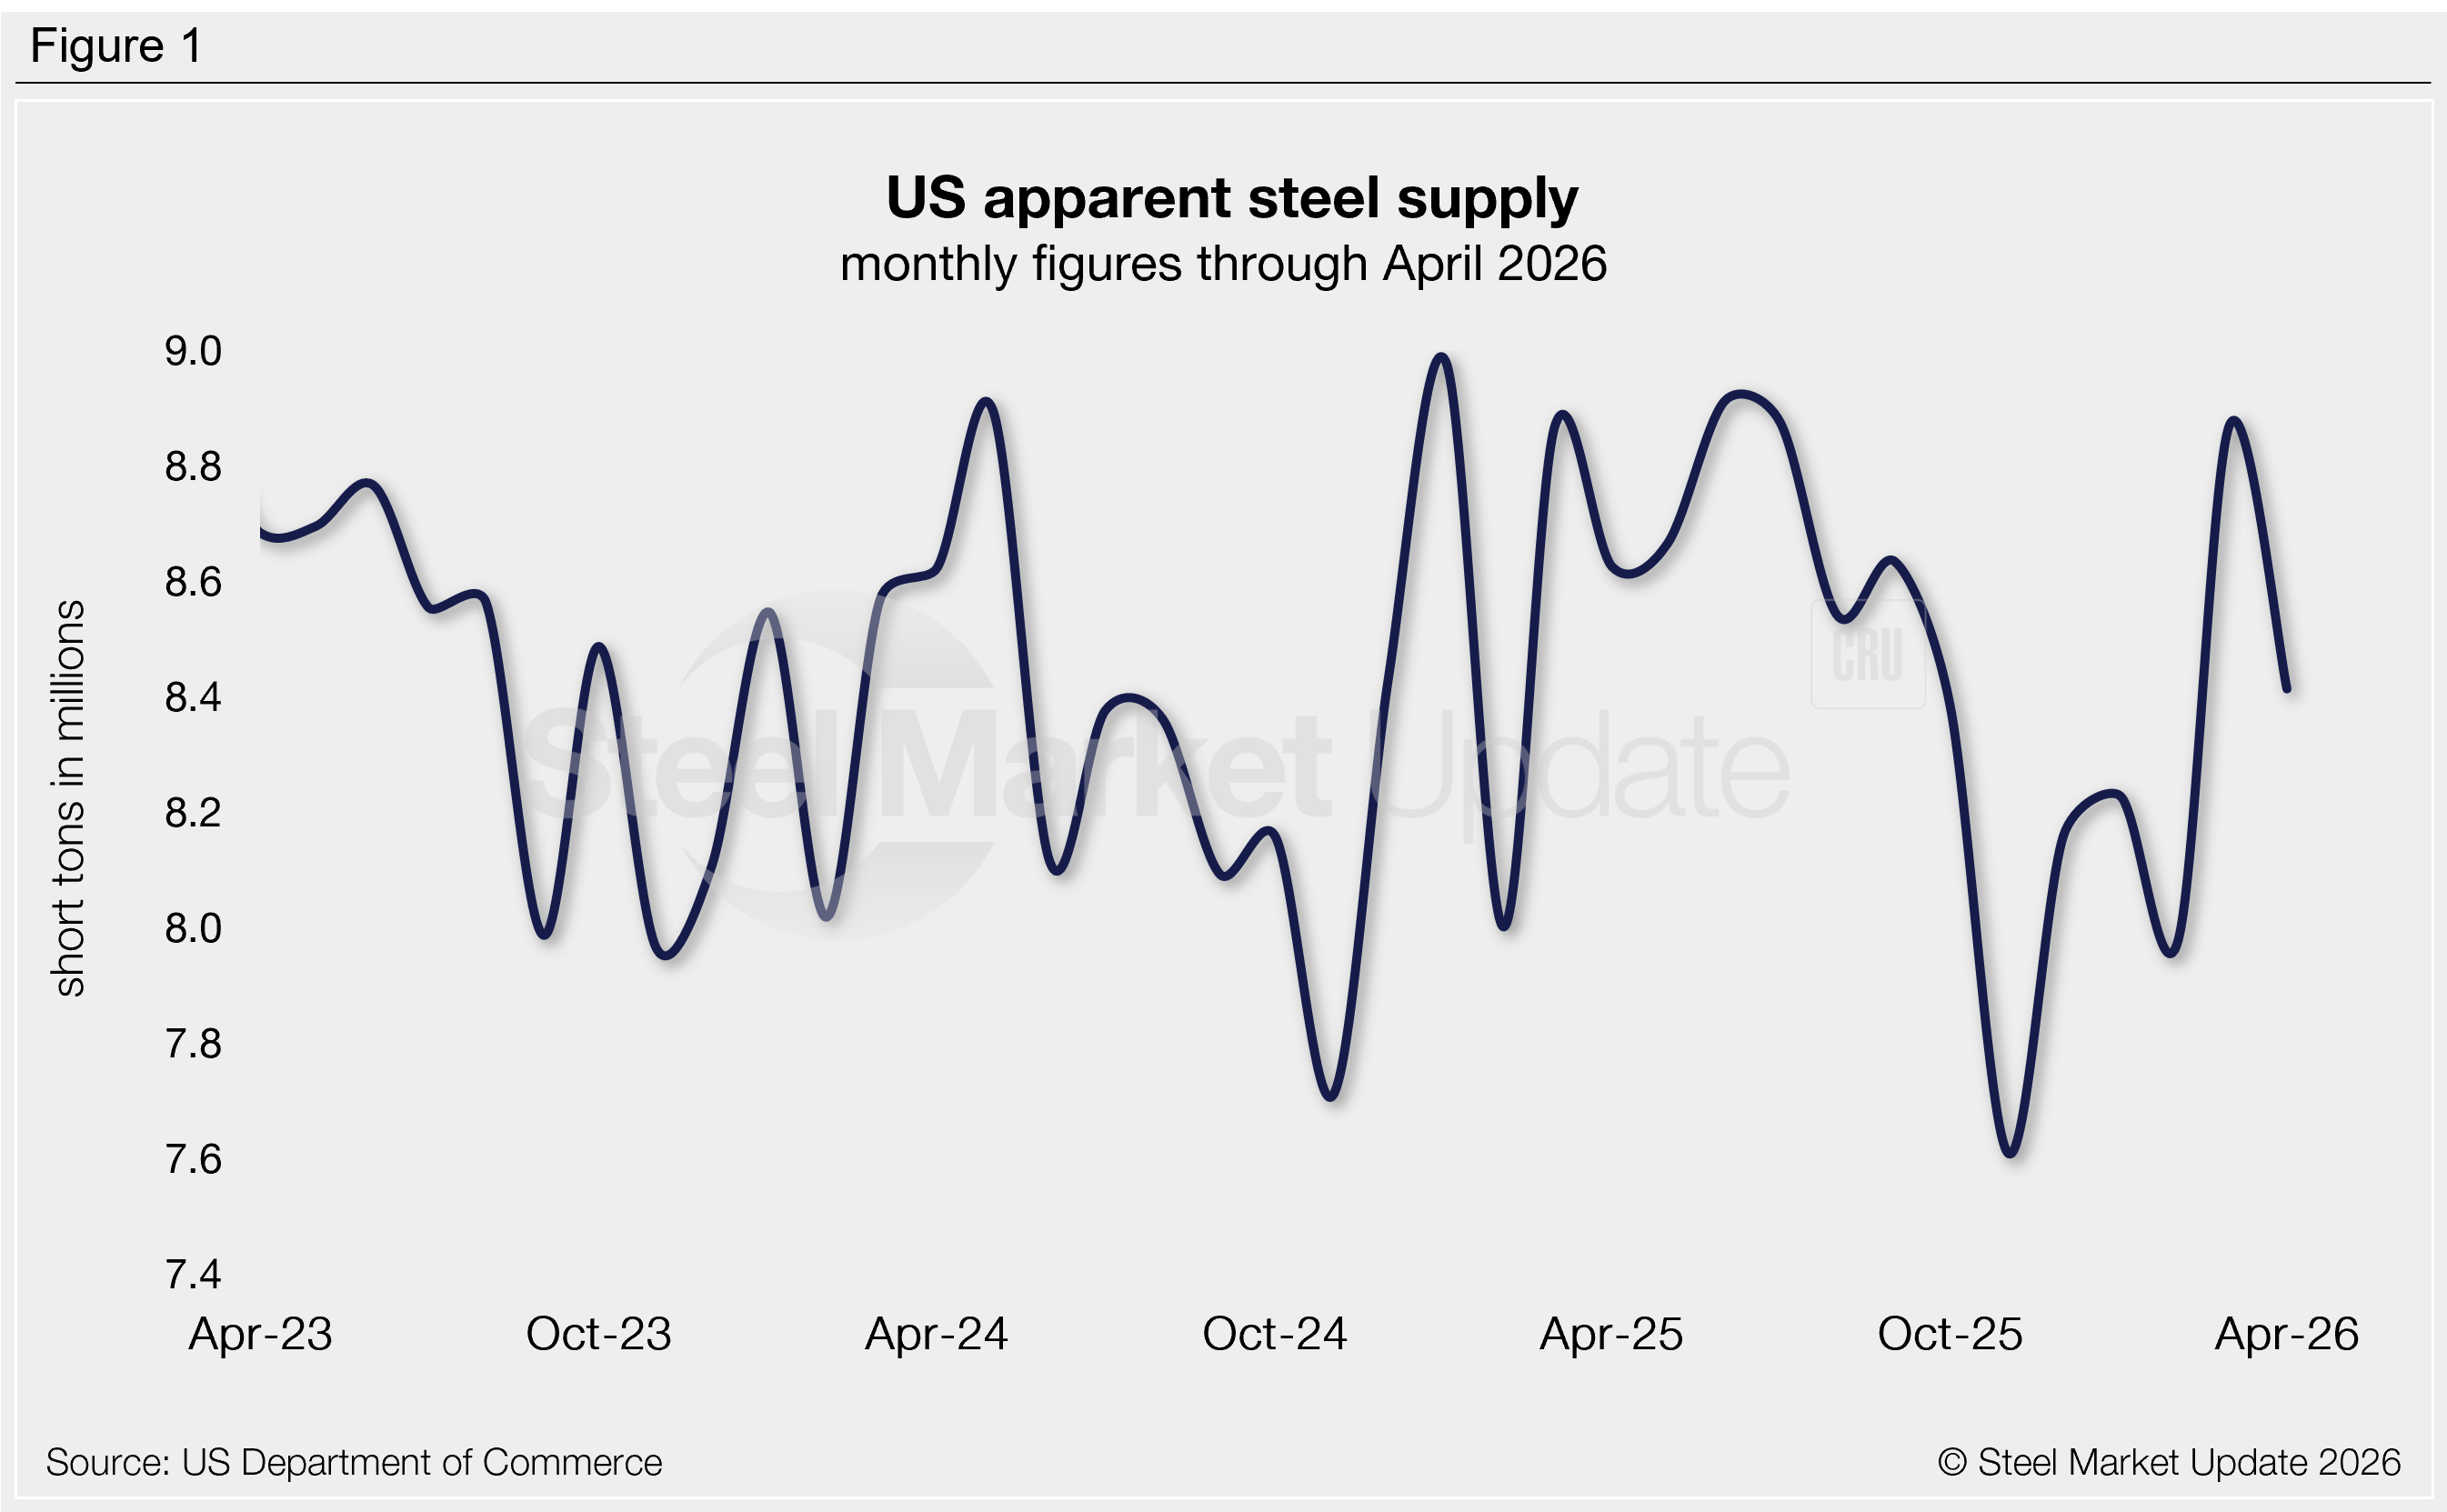
April supply shrank by 457,000 short tons (st) from March to 8.42 million st (Figure 1), in line with the average supply rate of the past year. This decline was primarily attributed to a reduction in domestic shipments, marginally offset by a rise in finished imports.
Across the past two years, we have seen supply rise as high as 8.98 million st (January 2025) and shrink as low as 7.61 million st (November 2025). For comparison, the highest monthly measure recorded in our 15-year data history was 10.90 million st in 2014 and the lowest was 6.52 million st in 2020.
Trends
Supply can be calculated on a three-month moving average (3MMA) basis to smooth out monthly fluctuations and better highlight trends. Following the 14-month low rate of 8.00 million st reached in January, the 3MMA has increased each of the last three months, rising to a six-month high of 8.42 million st through April (Figure 2).
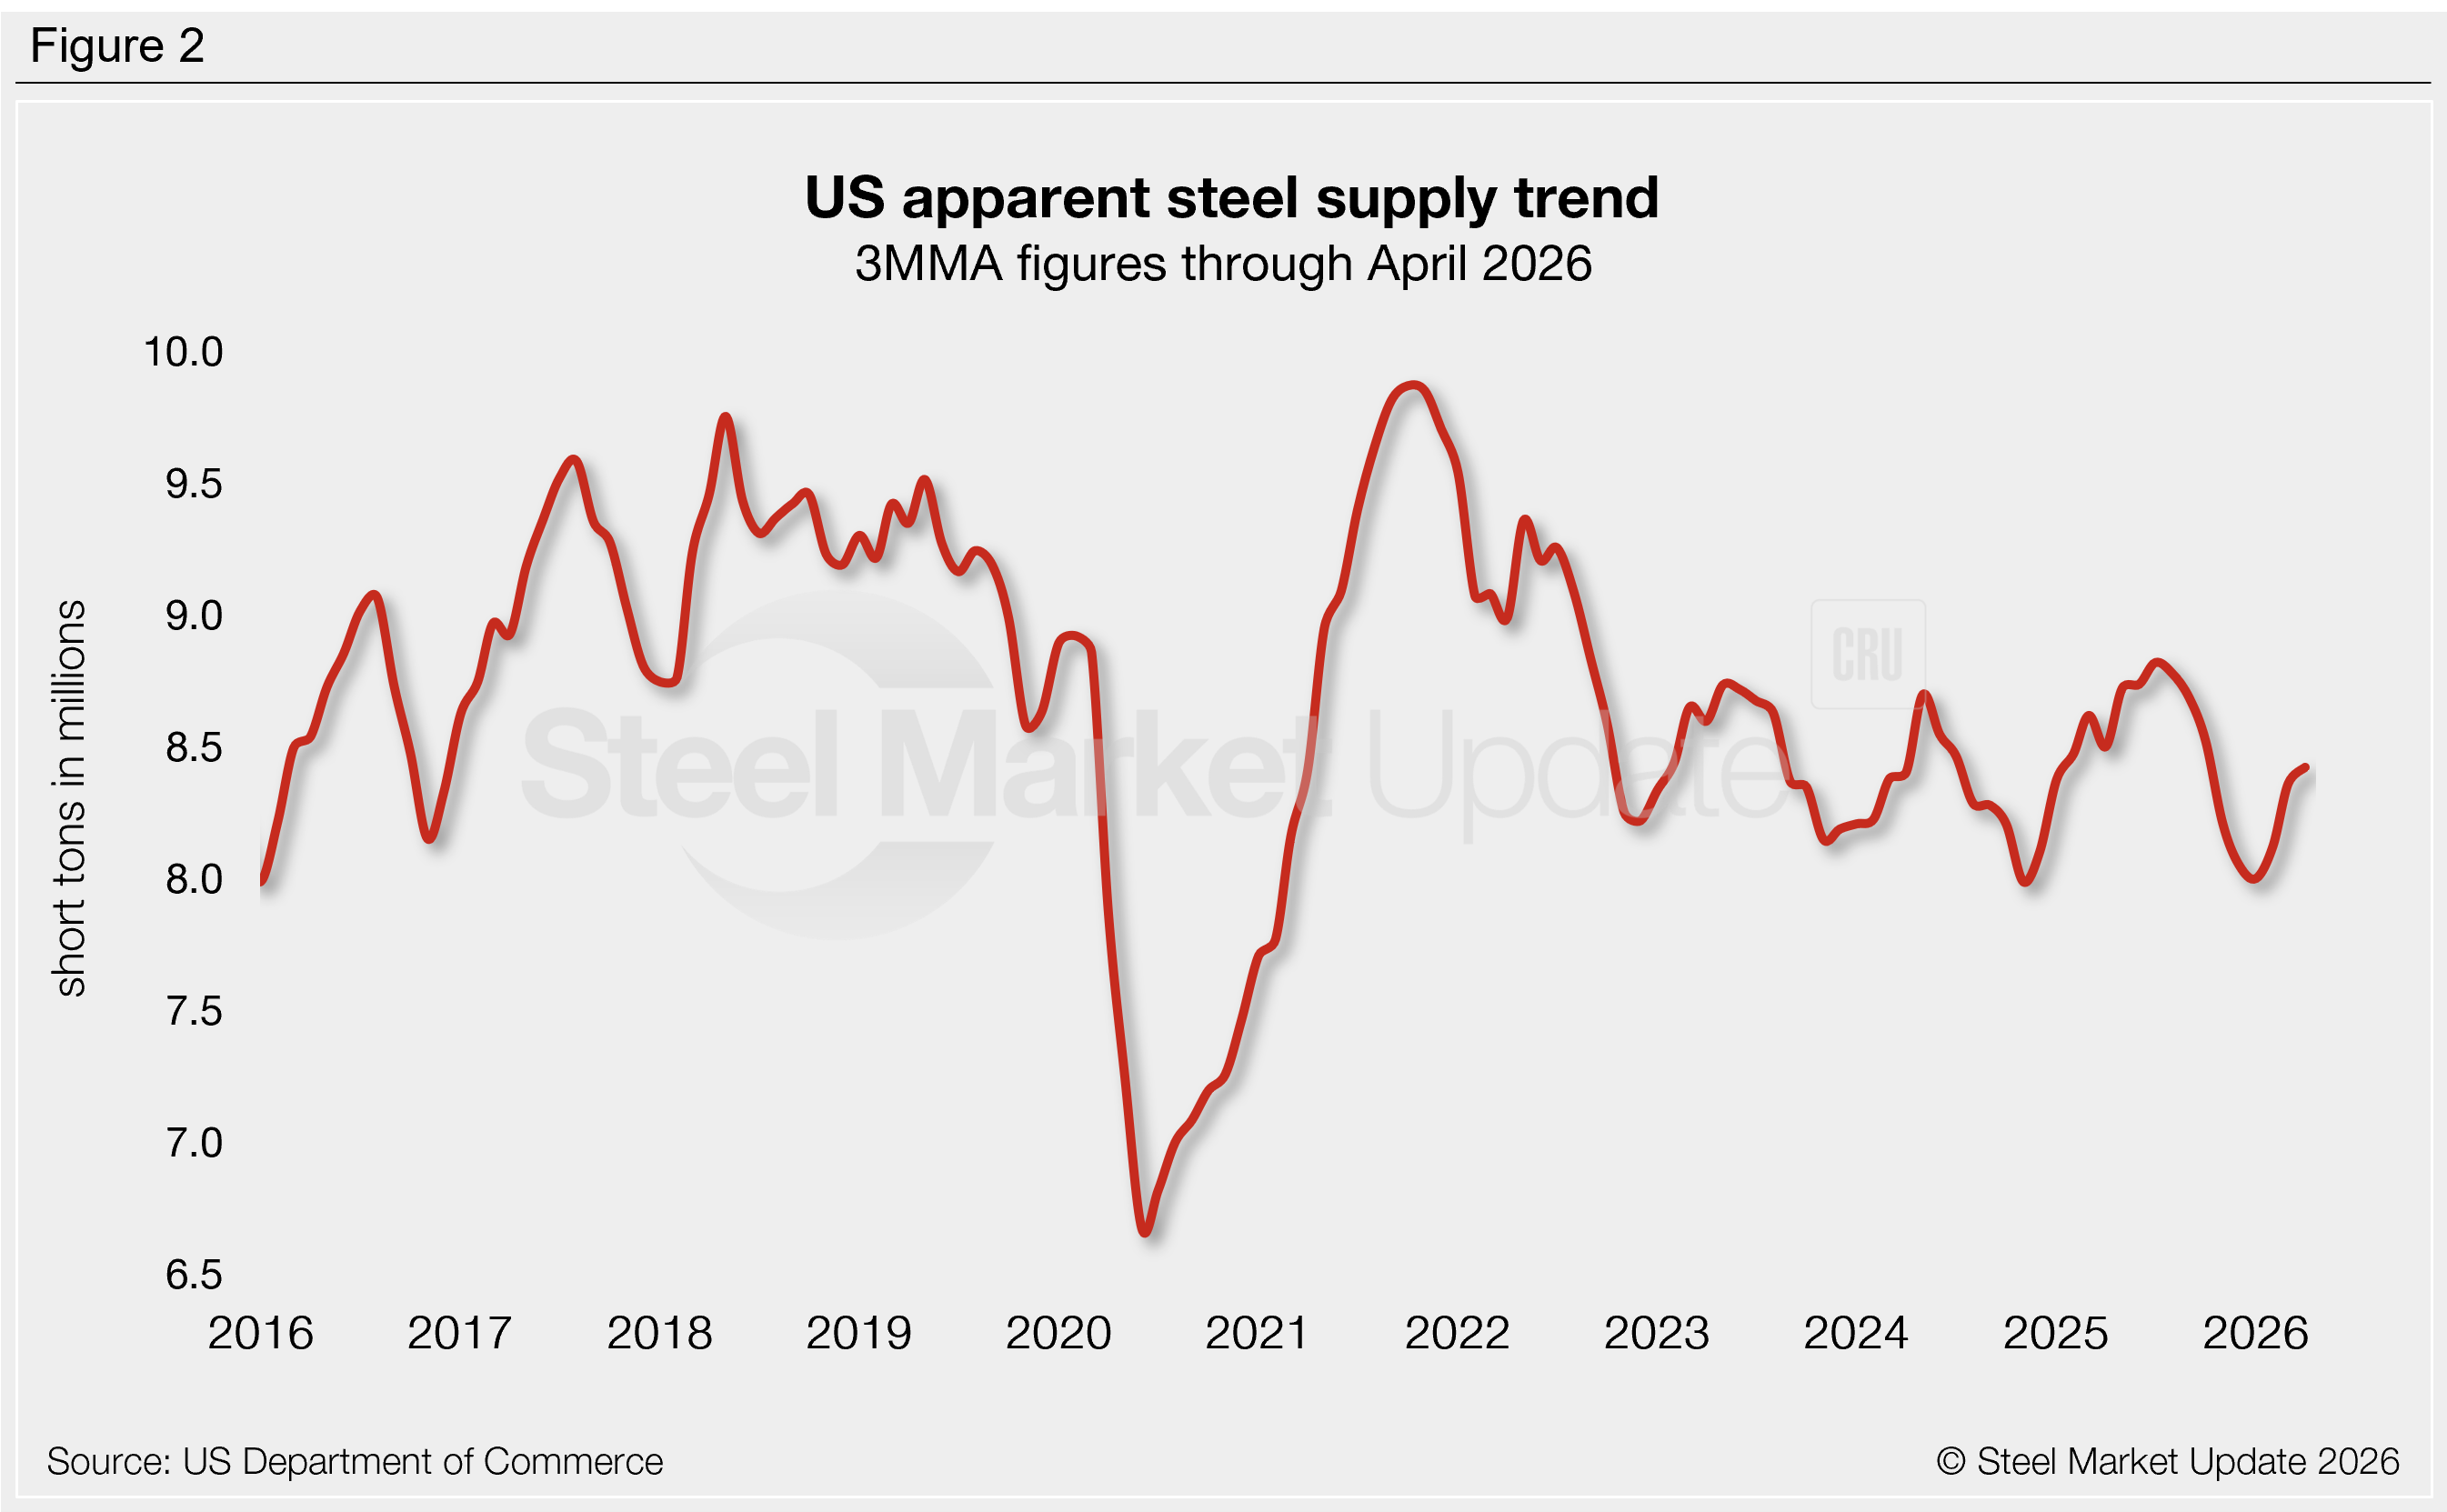
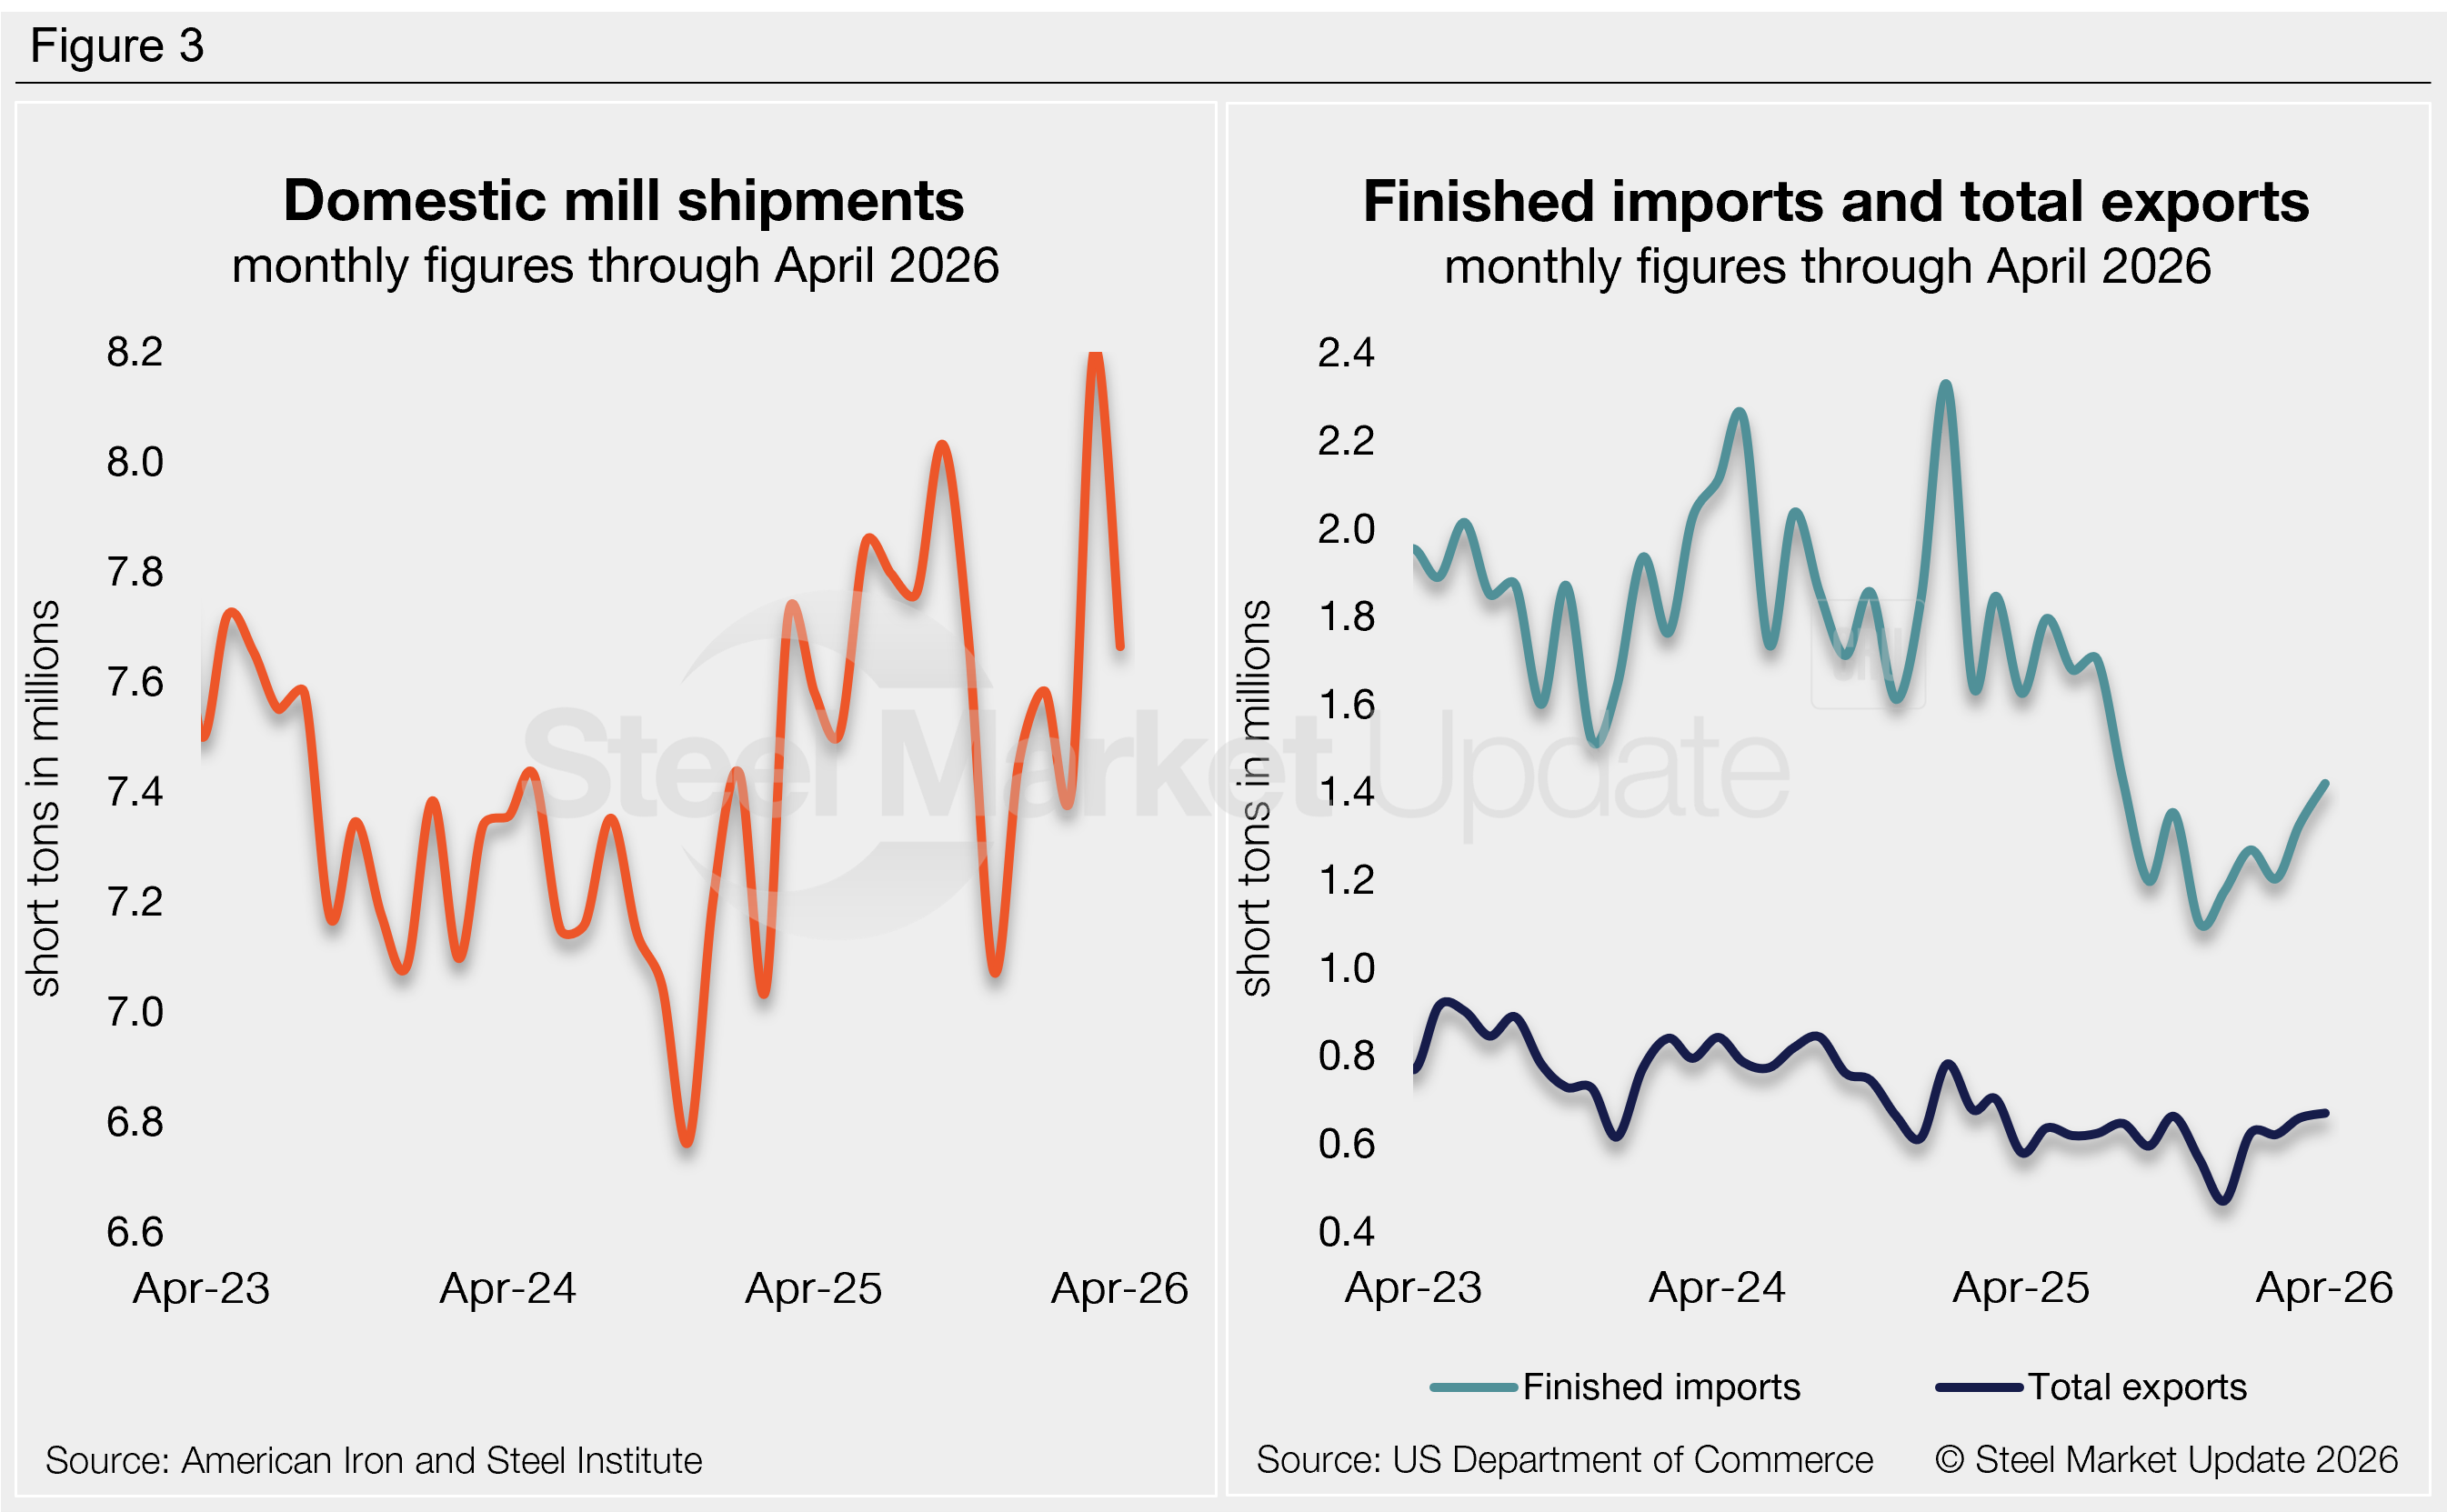
Figure 3 shows the individual components of apparent supply and their changes from March to April:
Domestic shipments fell 540,000 st month over month (m/m) (7%) to 7.66 million st, accounting for 91% of total supply. This comes one month after shipments reached a four-year high of 8.20 million st.
Finished steel imports increased 94,000 st (7%) to an eight-month high of 1.42 million st. The latest May license data shows a further 8% increase.
Steel exports increased 11,000 st (2%) to a 13-month high of 669,000 st, further recovering from the historic lows seen in late 2025.
Net imports (finished imports minus exports) made up 9% of April’s supply. This rate has been historically low for the last nine months (it averaged 14% from 2021-24).
To see an interactive graphic of our apparent steel supply history, click here. If you need any assistance logging into or navigating the website, contact us at smu@crugroup.com.