
Will Steel Prices Keep Trending Up Into 2020?
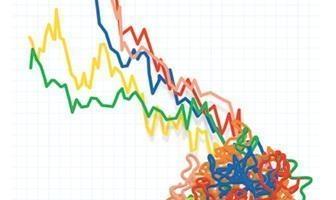
After declining for much of 2019, steel prices have moved up substantially in the last two months. Will the trend continue into 2020? Flat rolled steel producers raised prices three times during October and November for a total of $110 per ton. (Editor’s note: ArcelorMittal USA announced an additional $40 flat rolled increase on Friday. […]