Product
March 15, 2013
SMU Flat Rolled Import Analysis
Written by Peter Wright
Written by: Peter Wright
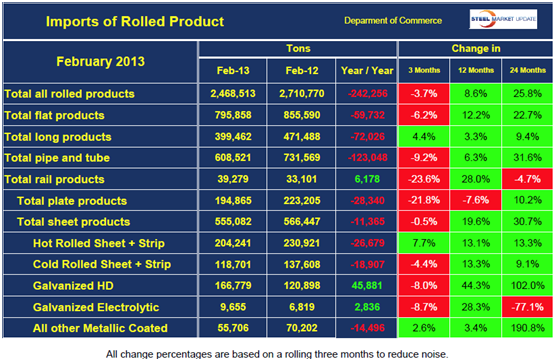
Rolled steel imports through February 2013. The Steel Import Licensing system is so predictive of the final numbers that it’s quite valid to incorporate licensed tonnage into a current report. This means that by mid month a detailed import report can run for the previous month. License data does not include district of entry so those details are delayed by an additional month. Imports of all steel products, (not including semis) were down by 242,000 in February 2013 compared to February 2012. The exceptions were tubulars and electro galvanized which both increased.
In order to reduce noise in the data it’s useful to compare rolling three month periods which gives a better feel of trade flows. In the three months through February, imports of all steel products were down by 3.7 percent compared to the September through November period. On a year over year basis, total imports in December through February were up by 8.6 percent and compared to the same period two years ago were up by 25.8 percent. This suggests that total imports are past the peak that occurred in June last year. The table below summarizes imports by product on the same basis as described above. Comparing three months through February with three months through November, rail and plate products were down quite dramatically while long products, hot band and other metallic coated sheet bucked the trend and increased. Comparing products over 12 month and 24 month periods shows that the differential between products is increasing suggesting that trends by product are accelerating.
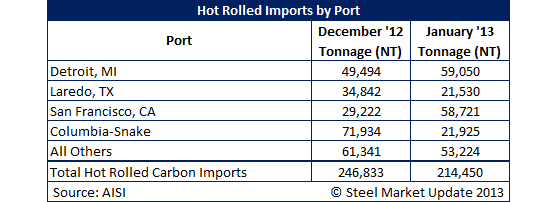
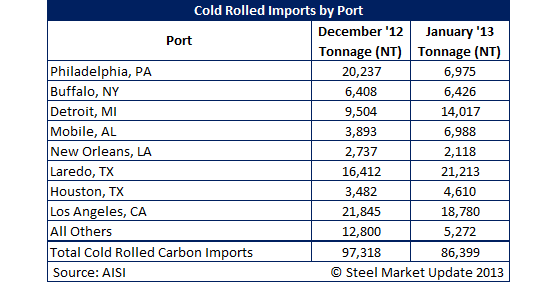
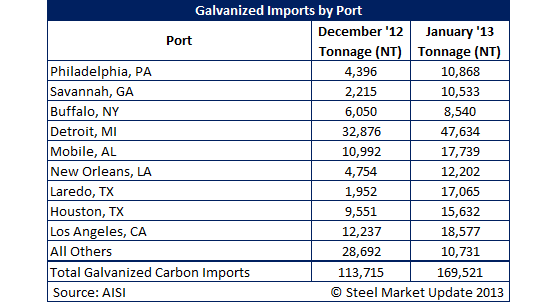
From a buyer’s point of view, the volume of individual products entering each district is more valuable than the national picture and SMU is planning to expand this analysis in the future (part of our “premium” upgrade). The following three tables break hot band, cold rolled and galvanized into the district which they entered the country. Hot band: almost 110,000 tons entered Detroit in December through January closely followed by the Columbia / Snake, (Pacific North West) with 92,000 tons. Cold rolled: over 40,000 tons entered Los Angeles in the same two months and over 37,000 tons came over the Texas border at Laredo. Galvanized sheet; Detroit received by far the largest volume almost with 80,000 tons in December and January.