

Market Data

October 19, 2015
Industrial Production and Manufacturing Capacity Utilization
Written by Peter Wright
Both these data points are reported in the Federal Reserve G17 data base. The index had an all-time high of 107.9108 in November last year but on a month over month basis has declined for eight of the first nine months of 2015. On a year over year basis using a three month moving average (3MMA) growth is still positive but has declined from 4.5 percent in January to 0.93 percent in September (Figure 1).
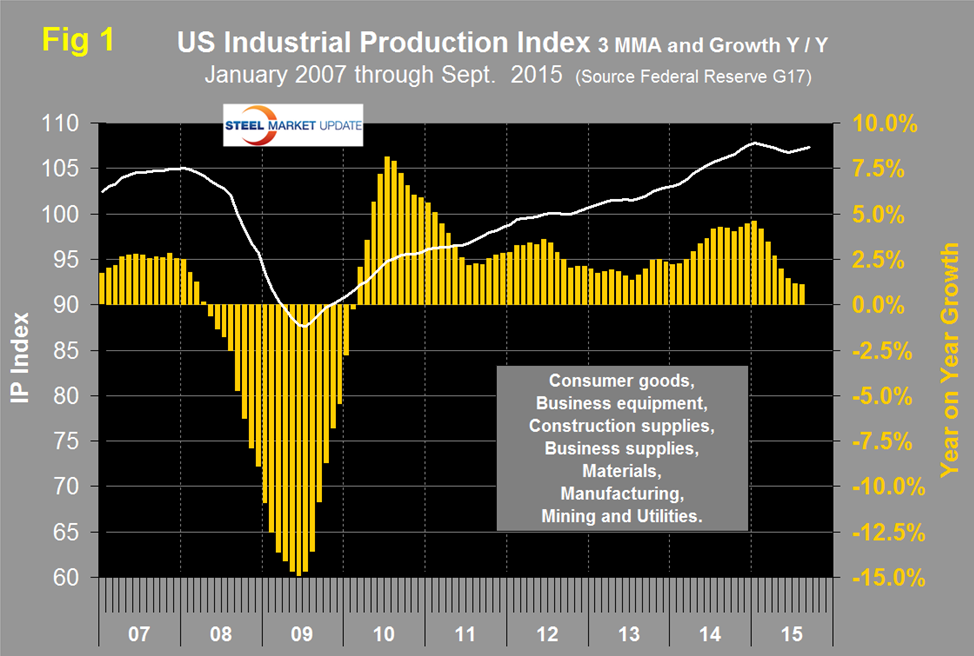
Data is seasonally adjusted and the index is based on the May 2012 level being defined as 100. The Federal Reserve summary for the September data reads as follows:
“Industrial production decreased 0.2 percent in September after edging down 0.1 percent in August. The decline in August is smaller than previously reported. In September, manufacturing output moved down 0.1 percent for a second consecutive monthly decrease; the index for mining fell 2.0 percent, while the index for utilities rose 1.3 percent. For the third quarter as a whole, total industrial production rose at an annual rate of 1.8 percent, and manufacturing output increased 2.5 percent. A strong gain for motor vehicles and parts contributed substantially to the quarterly increases. At 107.1 percent of its 2012 average, total industrial production in September was 0.4 percent above its year-earlier level. Capacity utilization for the industrial sector fell 0.3 percentage point in September to 77.5 percent, a rate that is 2.6 percentage points below its long-run (1972–2014) average.”
This data is similar to the ISM Manufacturing Index which has been expanding at a decreasing rate since June last year.
Manufacturing capacity utilization was 75.9 percent in September with a 3MMA of 76.14 percent (Figure 2).
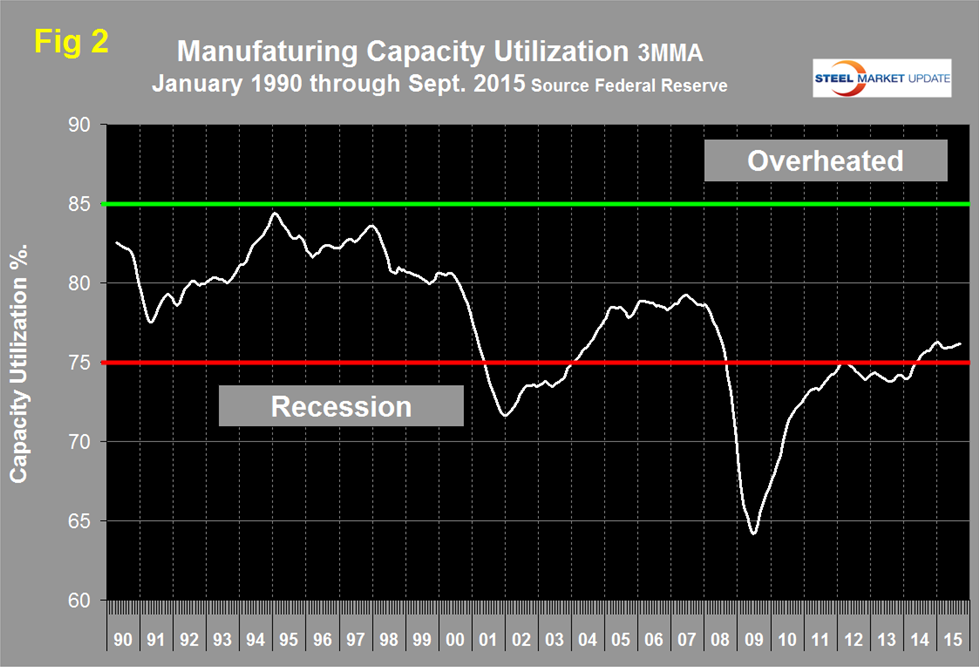
There was a recent peak of 76.27 percent in the 3MMA in January which declined to 75.87 in March and since then there has been a slight continuous improvement to the present value
The Manufacturers Alliance for Productivity and Manufacturing (MAPI) has collaborated with Deloitte, and examined the factors motivating footprint decisions and analyzed how global investment trends are shifting. By 2020, it is predicted that talent will become a key consideration for business expansion. South Africa, Turkey and Vietnam are countries to watch.
In summary the report concludes; A seismic shift in manufacturing location trends has occurred over the past 20 years as manufacturers sought to take advantage of labor arbitrage opportunities and gain access to raw materials, while accommodating an increasingly more global customer base. The growing global economy has enabled manufacturers to open new markets while surfacing opportunities to increase shareholder value through improved margins, reduced operating costs, shorter supply chains, and refinement of global tax structures.
However, balancing these potential advantages with challenges, such as protectionist tariffs, the inherent risks of expanding into new operating environments in which companies have limited experience, and a dynamic manufacturing environment can be challenging. As the global manufacturing environment evolves, the value proposition of each country changes as well. For example, what was once a cost play evolves into a market play or an opportunity to access talent for Research & Development, as has been the case with China. The next shift in manufacturing locations is imminent. To prepare, it is important to consider forward looking footprint strategies that examine realignment trends and offer expansion and optimization perspectives. The study asks companies which geographies they plan to invest in next and which levers do the intended countries pull in terms of increasing shareholder value. The objectives of the study are to understand trends driving global manufacturing footprint strategy shifts and to identify the next generation of locations manufacturers are considering as markets and strategic imperatives evolve.
However, single location expansion cannot be considered in isolation. The delivery of products and services to the global portfolio of customers and value to shareholders must be managed. Manufacturers can better position themselves for success by viewing their growth and expansion decisions as a dynamic fluid strategy, encompassing their entire footprint. Maintaining a proactive stance on managing the global footprint using cyclical planning can help manufacturers ensure their assets are aligned to changing market and manufacturing conditions and can avoid issues associated with business as usual approaches that result in severe misalignment.
A lot of optimism has emerged surrounding the US manufacturing renaissance, fueled by the concept of reshoring. While reshoring is a real phenomenon; a common misconception is it represents a return of previously offshored operations to US soil. In practicality, reshoring may include returning operations to Mexico. This offers greater access to the US market, but allows companies to maintain advantageous operating cost structures.
Sixty-six percent of survey respondents offshored their operations in the past 20 years, and a third are now considering bringing them back to North America. These moves focus on primary production and assembly operations currently located in China, India, and/or Brazil. Mexico is the first choice destination to re-shore operations, followed by the US.
SMU Comment: We suspect that many of our readers thought that reshoring meant returning to the US as we did but based on the MAPI report that may not be the case. The manufacturing data discussed above is through September. The growth of the IP index was 0.93 percent y/y and the growth in manufacturing employment was 0.9 percent y/y through September. There is no doubt that manufacturing is slowing but at this time growth is still positive.


