Prices

October 22, 2015
Hot Rolled Futures: Can't Both be Right!
Written by Andre Marshall
The following article on the hot rolled coil (HRC), busheling scrap (BUS), iron ore and financial futures markets was written by Andre Marshall, CEO of Crunch Risk LLC and our Managing Price Risk I & II instructor. Here is how Andre saw trading over the past week:
Financial Markets:
The stock market continues to prevail. From a chart perspective, it even looks downright bullish and is probably headed to set new highs again. Today was an important day in that statement in that the S+P broke it’s resistance line, which was started on July 20th, to settle just under 2052 on the Dec future. It’s only the first day to break it, but tomorrow all we would need is a settle above 2035 zone to convince us it’s a break out and we are headed higher again. This time it will be to test the old highs set on July 20th at 2118.50.
So what gives with the uber depressed commodity markets and the ebullient stock market here? Much of the same, plus some. Monetary easing, and now the idea that raising of interest rates in any meaningful way just isn’t in the cards yet. However, in my mind something has changed and that is the cessation of ever increasing revenues and profits, and this at a time when corporate debt find itself quite high here in the U.S.. Those looking at ratios will become less enamored and it’s likely that volatility on stocks will remain with us for the foreseeable future despite likelihood that news highs will likely be set in the immediate term.
In Commodities, it is still depressed, however, Crude and Iron Ore, arguably the two largest commodity markets, have both remained stable in their pricing of late. The charts in crude tell a complicated story. You may recall my mention of a bull flag formation started on August 31st, which gave indication that crude would want to move higher. As the chart suspected, we did break out of that flag to the upside. However, we did NOT surpass the high of that bull flag (think top of flag pole), and have since retraced back to the bottom of the flag. Usually a bearish indication and one where expectation would be of lower levels. However, the last two days of testing those lows on the flag, we have not only held those levels, but have put in higher lows than previous lows on the flag. So, this story isn’t done yet although we look quite precarious. The support of those levels is between $43.93/bbl and $44.43/bbl. If we break and settle through this zone we are headed back to test the Aug 24th lows of $39.22/bbl.
In Copper, we broke a long resistance back on August 27th around $2.32/lb., rallied to $2.4930/lb. zone only to retrace However since we have set higher lows and look equally poised to go higher than break down further. Sentiment is still very bearish across the board, and for this reason I would guess that next moves will take us to the upside rather than new lows. After all, these markets can’t both be right. Last time I checked commodities are used in the making of goods/profits. Either we head higher on raw materials to reflect the message the stock market is sending or the stock market is finally in trouble.
Steel:
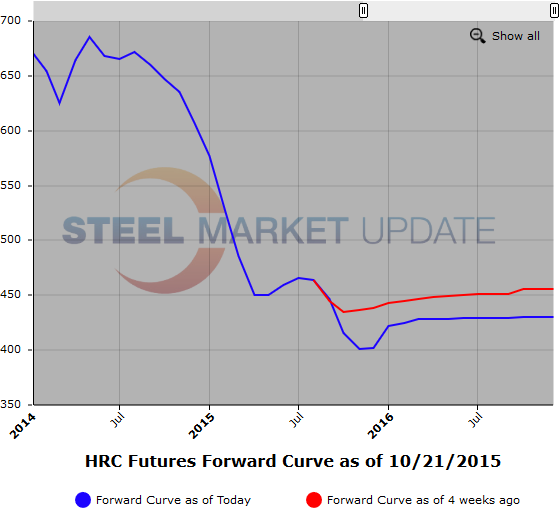
We have had a good week in steel futures trading 1770 Lots or 35,400 ST. For the first time we traded into 2017 where we did a 18K ST trade at $450/ST. IN 2016 the activity has been mostly around Q1 which has traded in the $423-$424 range, and a bit out into Q4 around $430/ST zone. IN Q1 we are up from the lows around $4/ST and in Q4 up slightly. On nearbys we have traded as low as $398/ST on Nov and $402 Dec equivalent and edged up a $1-2/ST since. The CRU came in at $410/ST down $10/ST, but expectations of further material drops seem muted. Lots of potential BOF closure hang in the winds as do tarrifs on trade cases and renewed buying in some sectors like OCTG, albeit muted.
Below is a graphic of the HRC Futures Forward Curve. The interactive capabilities of the graph can only be used in Steel Market Update website here. If you have any issues logging in or navigating the website please contact us at info@steelmarketupdate.com or (800) 432 3475.
Iron Ore:
Dead, and flat. Hasn’t really broken even a modest range in months. Comforting maybe, but stagnant. Last $51/MT approx on the index and no driver one way or other. Let’s call Nov either side of $48.50/MT, Dec. either side of $46.50/MT, Jan either side of $45.25/MT, Q1 either side of $44.35/MT, Q2 either side of $42.50/MT and Cal ’16 either side of $42.30/MT.
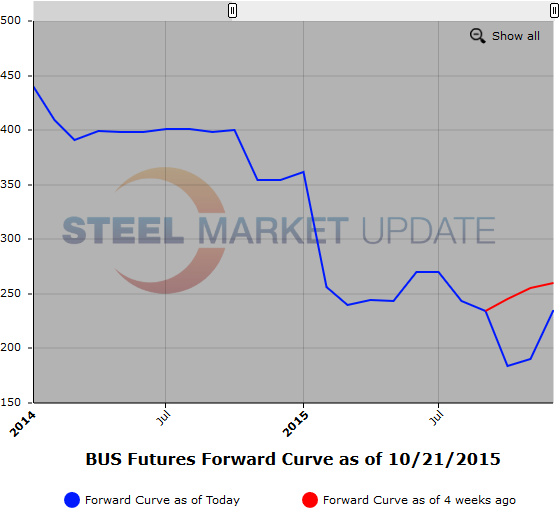
Scrap:
So this is really the Achilles heel to the global steel market, right! Trade cases will keep the steels out over time, but we have relied on a certain amount of scrap export and that is dead as long as the $ is so robust and the Chinese billet continues to flood the region affecting Turkey’s MENA market. Add to that cheap pig iron imports, ill timed DRI types, and depressed Iron Ore prices. Those close to the CFR Turkey market. thought $190/MT would hold, and here we are at $170/MT – Amazing! Looking at the U.S. , and reading about the levels for obsoletes, and it’s almost unimaginable i.e. $70/MT West coast for HMS no 2. Yikes! Rumors abound about how collectors are telling generators for low grade irons that they have to pay them to move them. I think that Nov. will end up being flat to upward despite concerns it might go lower. We’re just too close to winter to see dealers caving any further, the cash-flow grab was likely this last month. It’s going to be the mother of all rallies when it comes, if we only one knew when! Man deflation hits hard!
Another graphic is below, to use it’s interactive features you must visit this page on our website.