Prices

February 22, 2018
HRC Futures, it’s a Roofer!
Written by David Feldstein
The following article on the hot rolled coil (HRC) futures market was written by David Feldstein. As the Flack Global Metals Director of Risk Management, Dave is an active participant in the hot rolled futures market, and we believe he provides insightful commentary and trading ideas to our readers. Besides writing futures articles for Steel Market Update, Dave produces articles that our readers may find interesting under the heading “The Feldstein” on the Flack Global Metals website, www.FlackGlobalMetals.com. Note that Steel Market Update does not take any positions on HRC or scrap trading and any recommendations made by David Feldstein are his opinions and not those of SMU. We recommend that anyone interested in trading HRC or scrap futures enlist the help of a licensed broker or bank.
Last Friday, the Department of Commerce announced its 232 Investigation findings and recommendations. The HRC futures, which were already at ludicrous speed, immediately went plaid.

Below is the chart of the rolling 2nd month (March) CME Midwest HRC future settling this week at a new high of $797 while the April future settled at $801; that’s right folks, that’s an 8.
CME Rolling 2nd Month HRC Future
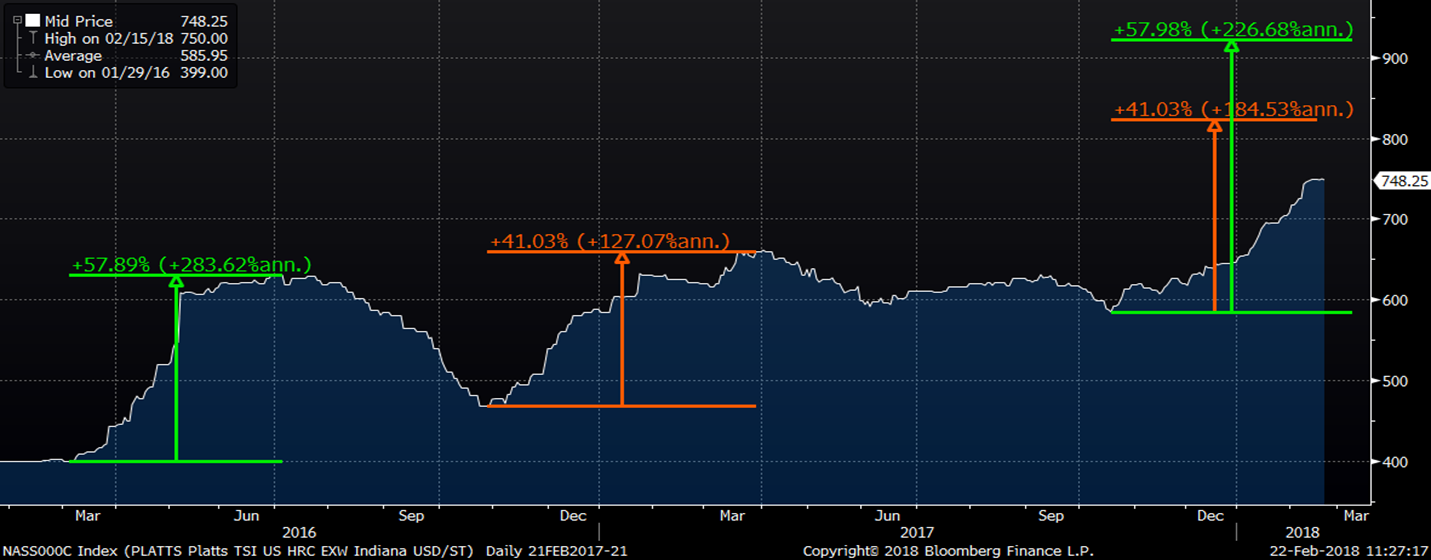
Domestic steel fundamentals are rock solid. In previous reports, it was pointed out that the last two times international HRC differentials (i.e. Midwest HRC – Turkish HRC) reached at or below $100/st, a significant rally followed in hot rolled. The first of these two rallies that started in March, 2016 gained 58% and the second rally starting in October, 2016 gained 41%. Last October, we saw the differentials reach the same low levels as in March and October, 2016. As the HRC price has moved into (recent) uncharted territory, the percentage gains from those two rallies were used to predict a price range of $820 – $920 for the future high of the Platts TSI Midwest HRC Index. Midwest HRC spot pricing and near term futures are now around the $800 level and closing in on the bottom end of that range.
Platts TSI Midwest HRC Index
With last Friday’s Section 232 announcement already affecting supply, most specifically through cancellations of working orders for imported tons, it would be reasonable to expect prices to trade to the top of the range. If the any of the 232 recommendations are implemented, there will likely be a steel shortage in the US and the price could reach to new all-time highs. Stock markets crash lower, but commodity prices crash up, usually due to droughts or some other kind of disruption or shortage.
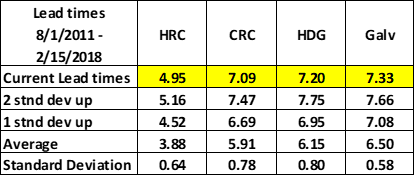
A few weeks ago, it was noted that flat rolled lead times materially pushed out as shown in the SMU chart below.
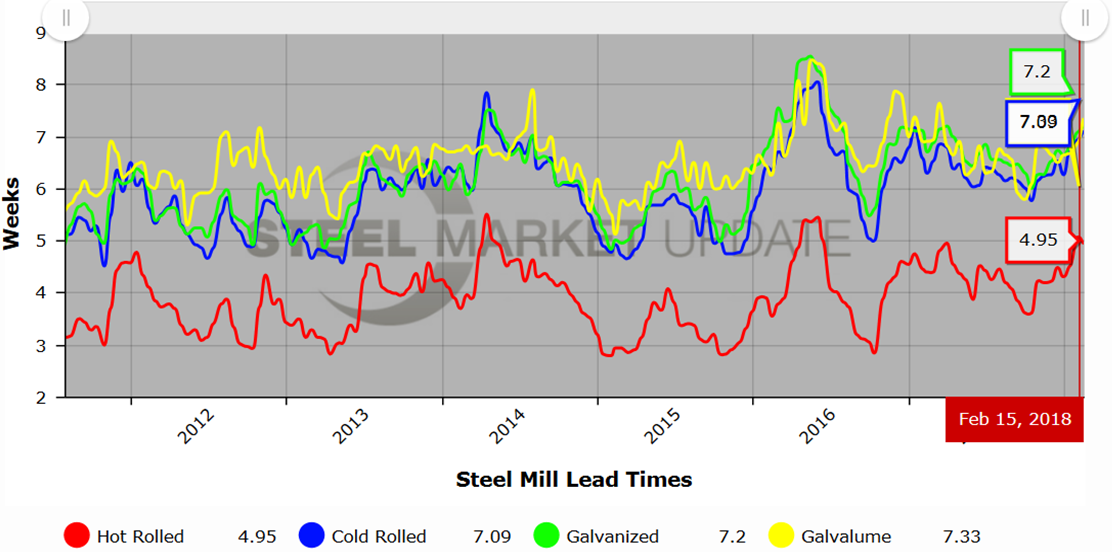
Taking the data from the chart above, all four lead times were approaching the second standard deviation of their six year average as of February 15th. Keep in mind that these lead times were before the 232 announcement.
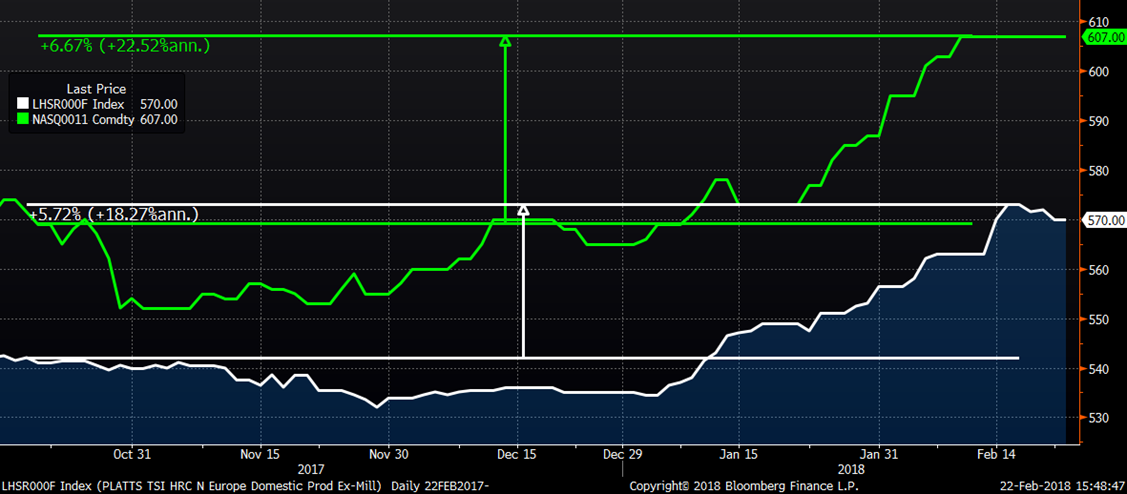
If the domestic fundamentals weren’t enough to get you bullish, prices in Asia and Europe have also been in rally mode, albeit at a slower pace, with the TSI North European Index up 6% and the ASEAN HRC Index up 6% since the TSI Midwest HRC Index bottomed in mid-October, 2017.
TSI North European HRC Index (white) & TSI ASEAN HRC Index (green)
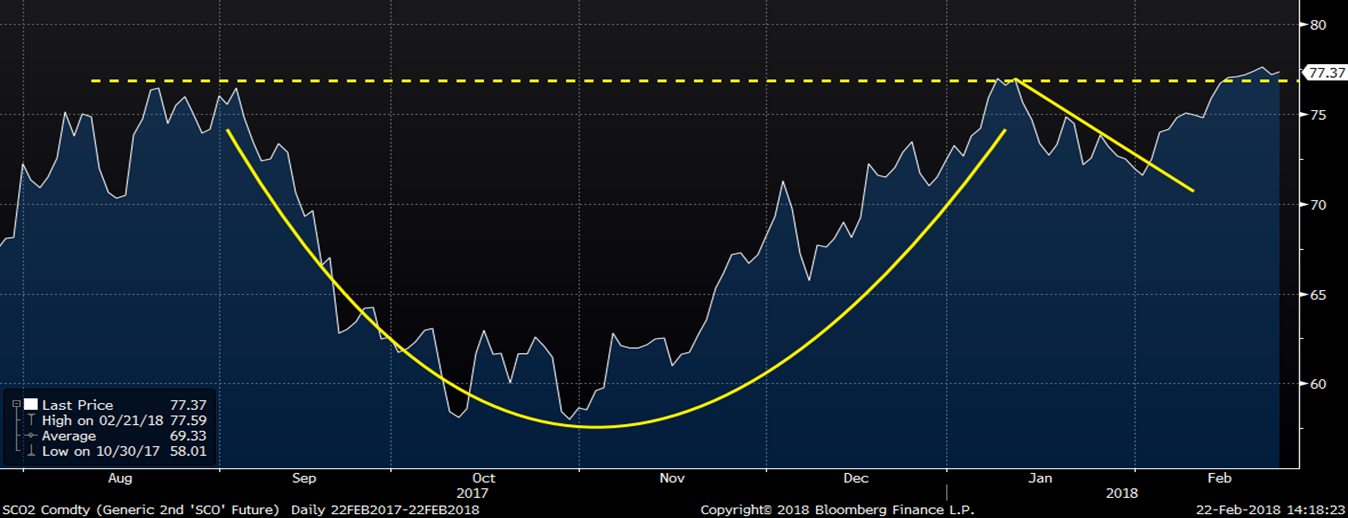
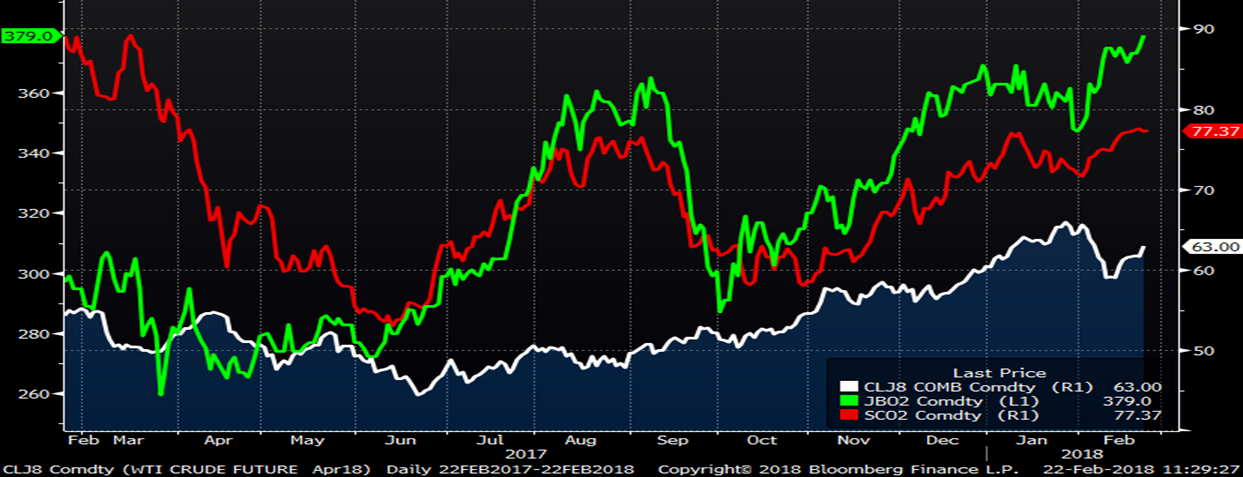
Crude oil, scrap and iron ore prices have all been rallying higher.
April WTI Crude (white), 2nd Month LME Turkish Scrap (green) & 2nd Month SGX Iron Ore (red)
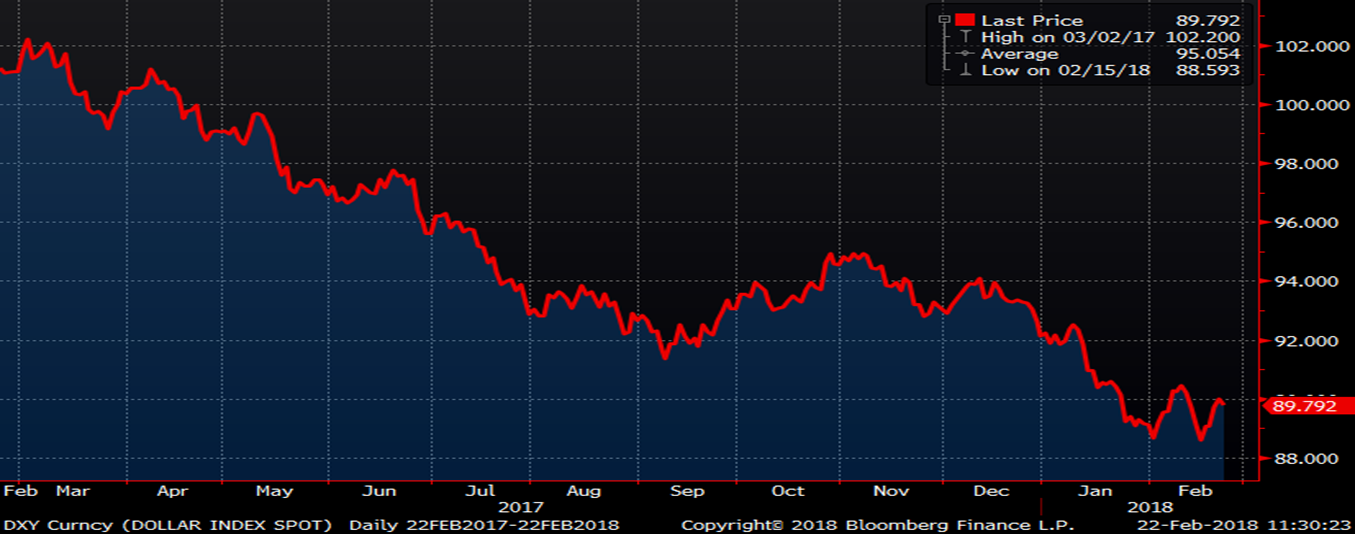
The US dollar is at multi-year lows, which has helped to drive commodity prices higher. It is truly a global rally with a rare synchronized global growth phenomenon underway.
US Dollar Index
There have been massive gains in the HRC futures with April trading at $800 and up over $100/st in one month! The curve has become increasingly downward sloping as spot prices skyrocket, but don’t make the mistake of reading too much into the shape of the curve. It is true that prices in the second half are over $60 below April, but if the 232 recommendations are implemented, the curve’s shape could change dramatically, perhaps shifting into contango (upward sloping).
CME Midwest HRC Future Curve
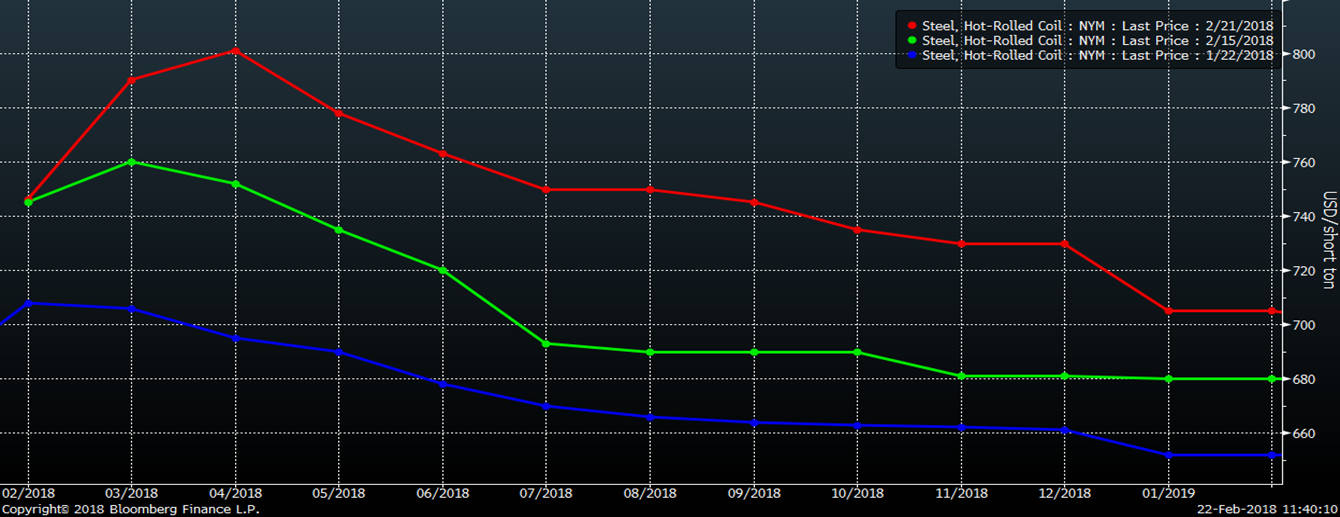
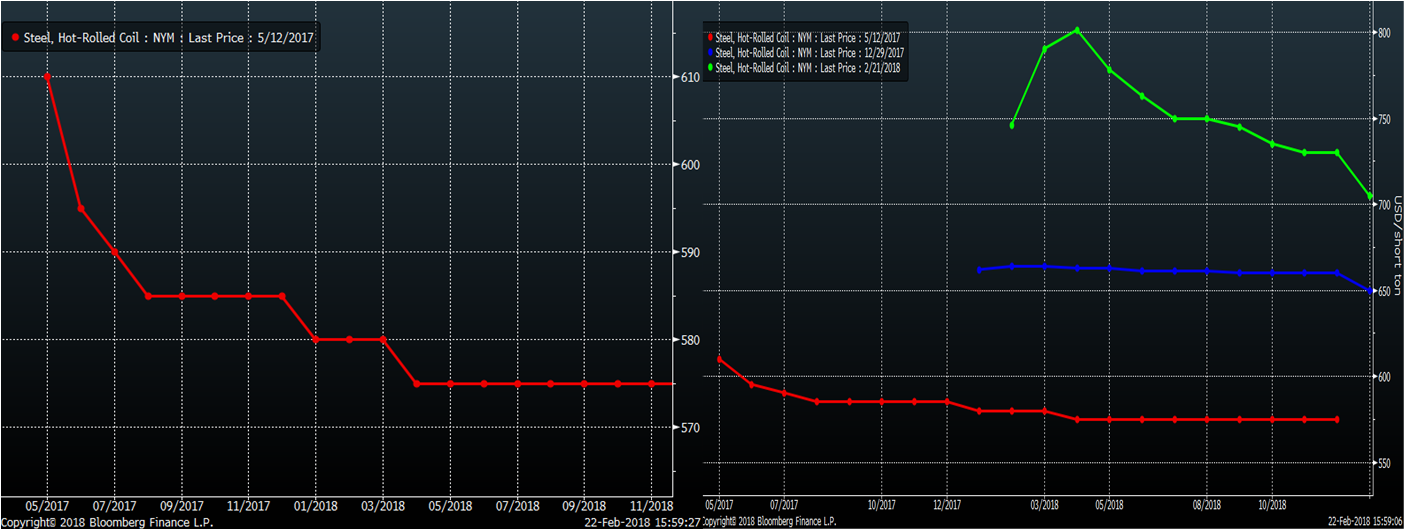
The idea that the shape of the futures curve predicts future price is one that comes up often. Each month of the curve is where market participants agree on future prices, that’s it. One individual will eventually be right and the other wrong. The curve reliably predicts nothing. For example, the downward sloping HRC curve in the chart on the left is from May 12th, 2017, a few weeks after the 232 Investigation was announced. The curve was downward sloping and showing $35 of backwardation from May, 2017 to April 2018. If you had used the curve as a price prediction tool and sold April at $580, you would currently be down $220/st. Sorry folks, but it just ain’t that easy! Don’t believe the hype!
CME Midwest HRC Future Curve
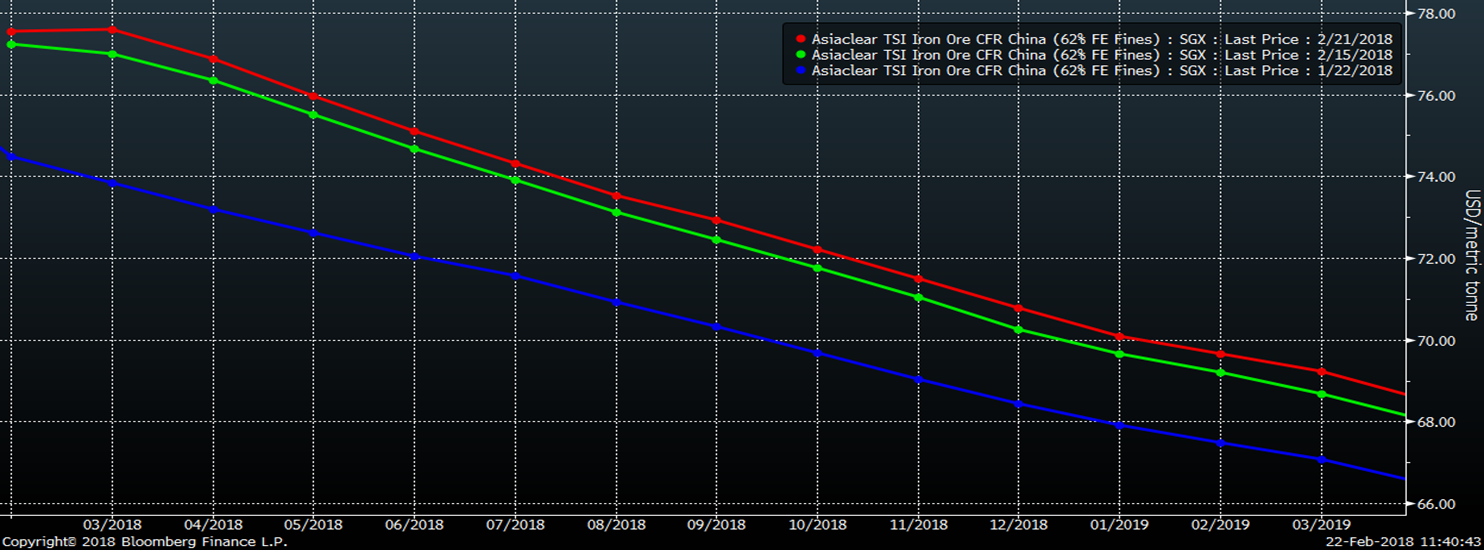
Iron ore is up nicely on the month with the curve maintaining its shape. Iron ore futures have been very quiet with China closed for the Lunar New Year.
SGX Iron Ore Future Curve
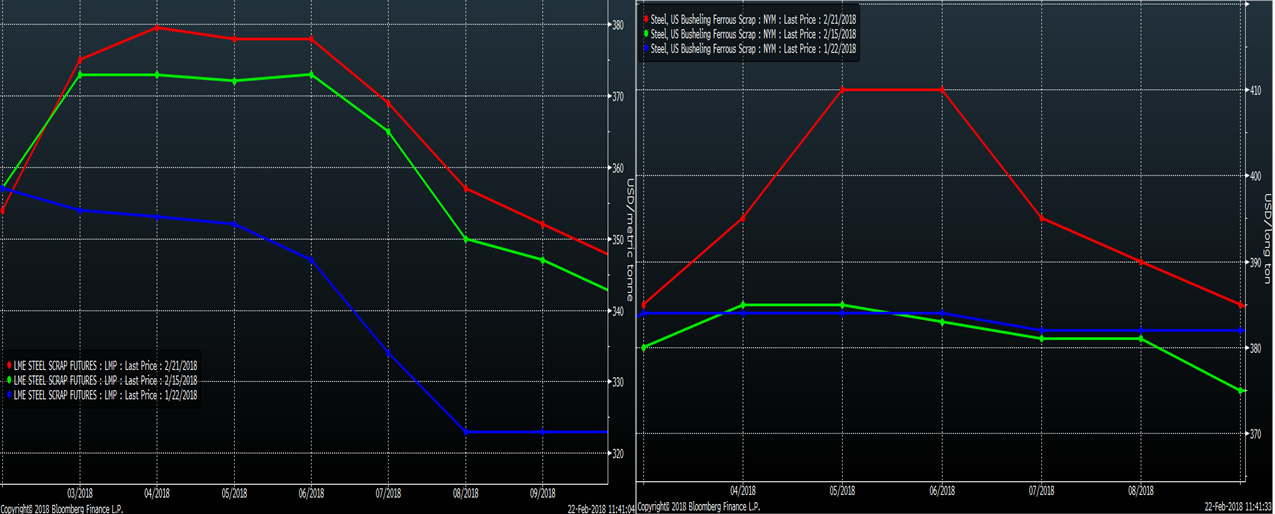
As discussed, scrap has also been rallying and the curve is downward sloping, however the busheling curve has taken on a strange shape with May and June futures trading above the rest of the curve. Both contracts continue to grow their volumes.
LME Turkish Scrap Futures & CME No. 1 Busheling Curves
Revisiting the SGX iron ore “cup and handle” chart from a couple weeks ago, we see the rally in iron ore has not only taken prices above the handle, but also broken above the top of the cup. Iron ore futures reopened today in Dalian, China and it will be interesting to see how price action develops. If prices continue to rally, look out above. This chart shows it is poised to join the global commodity rally. And if ore does rally, it will be one more reason to push Midwest HRC prices higher. Keep a close eye on ore.
SGX 2nd Month Iron Ore Future