Prices

April 5, 2018
Hot Rolled Futures: Lightning Round!
Written by David Feldstein
The following article on the hot rolled coil (HRC) futures market was written by David Feldstein. As the Flack Global Metals Director of Risk Management, Dave is an active participant in the hot rolled futures market, and we believe he provides insightful commentary and trading ideas to our readers. Besides writing futures articles for Steel Market Update, Dave produces articles that our readers may find interesting under the heading “The Feldstein” on the Flack Global Metals website, www.FlackGlobalMetals.com. Note that Steel Market Update does not take any positions on HRC or scrap trading and any recommendations made by David Feldstein are his opinions and not those of SMU. We recommend that anyone interested in trading HRC or scrap futures enlist the help of a licensed broker or bank.
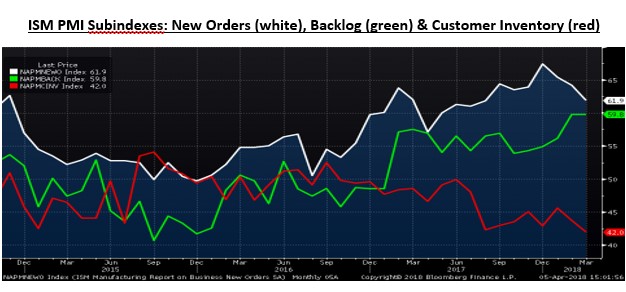
This was a big week for economic data. ISM Manufacturing PMI sub-indexes show continued strength in demand via new orders and backlog sub-indexes at 61.9 and 59.8, respectively, while the customers’ inventories sub-index fell to 42. If OEM’s were light when HRC lead times were at three weeks, they’re flashing red at eight weeks lead time.
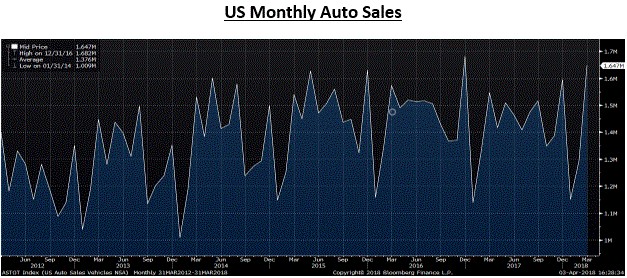
Stronger than expected auto sales of 1.65 million motor vehicles sold in March was up 27.4 percent month over month and 6 percent year over year.
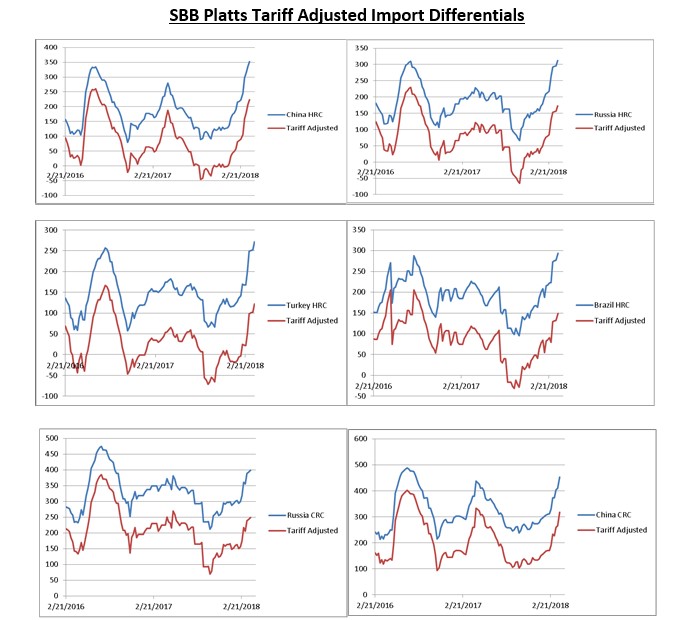
Don’t believe the hype. March imports are up, but current tariff-adjusted import differentials are not attractive. The charts below compare the historical differentials, i.e. Midwest HRC – China export HRC, with tariff-adjusted differentials, i.e. Midwest HRC – (1.25 x China export HRC). In comparison, the tariff adjusted levels are all near their historically low levels except for China, which is near the middle. Once the import differentials become attractive, then it’s gonna take a few months for the metal to arrive. See complications regarding customers’ inventory and domestic mill lead times above.
April CME Midwest HRC futures are consolidating with this week’s index print marginally higher, but well below the latest Platts TSI Midwest HRC Index print of $875.50.
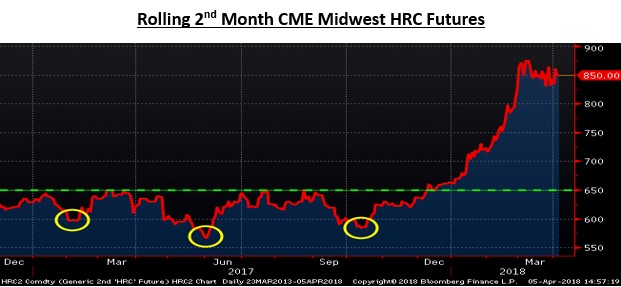
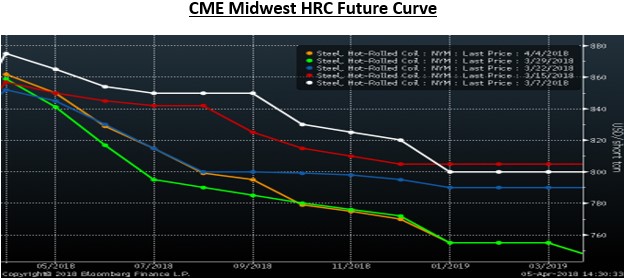
The “Gary Cohn” top still holds while prices in the second half and into 2019 have dropped $40 to $50 from their highs.
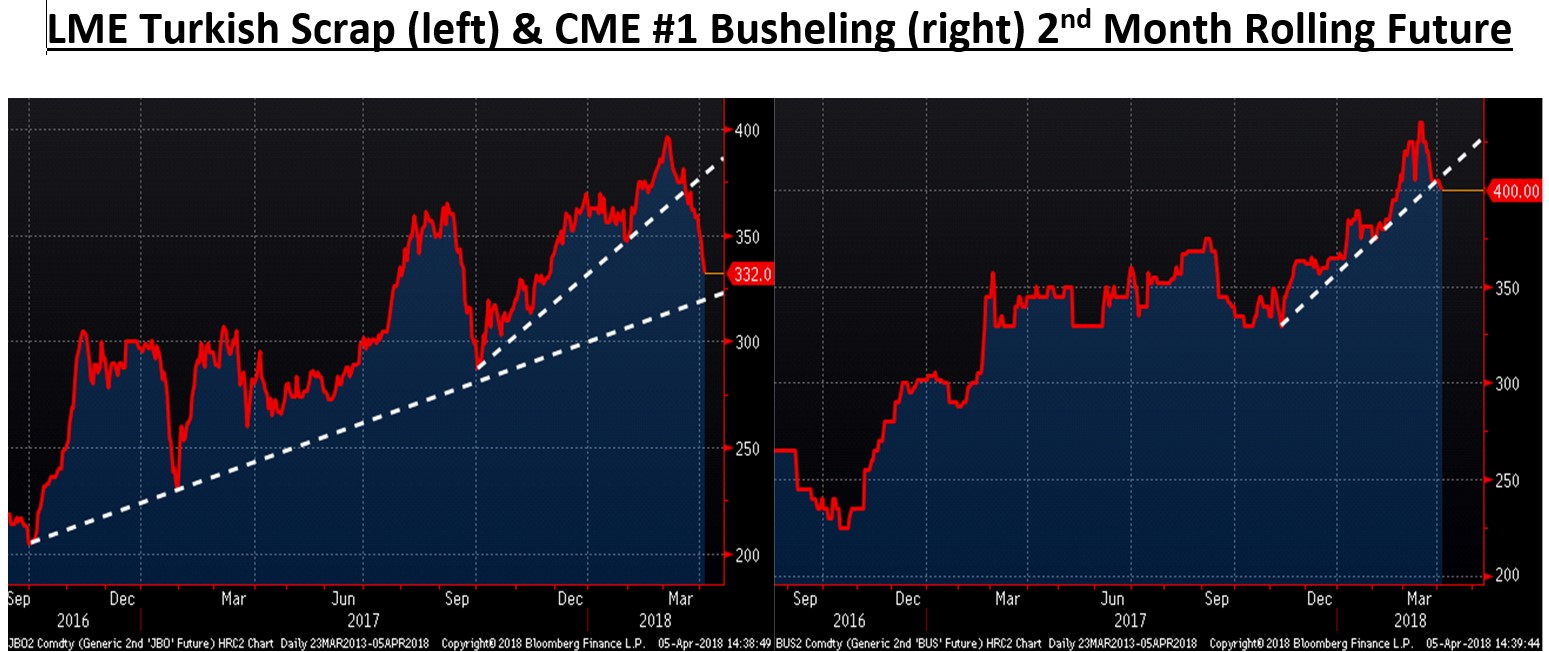
LME Turkish scrap futures have fallen sharply in recent days after breaking the up trendline a few weeks ago and the May futures are approaching support at a longer term trendline at $325. The May CME busheling future broke through its six-month up trendline, which is adding pressure to the CME HRC futures via the metal spread.
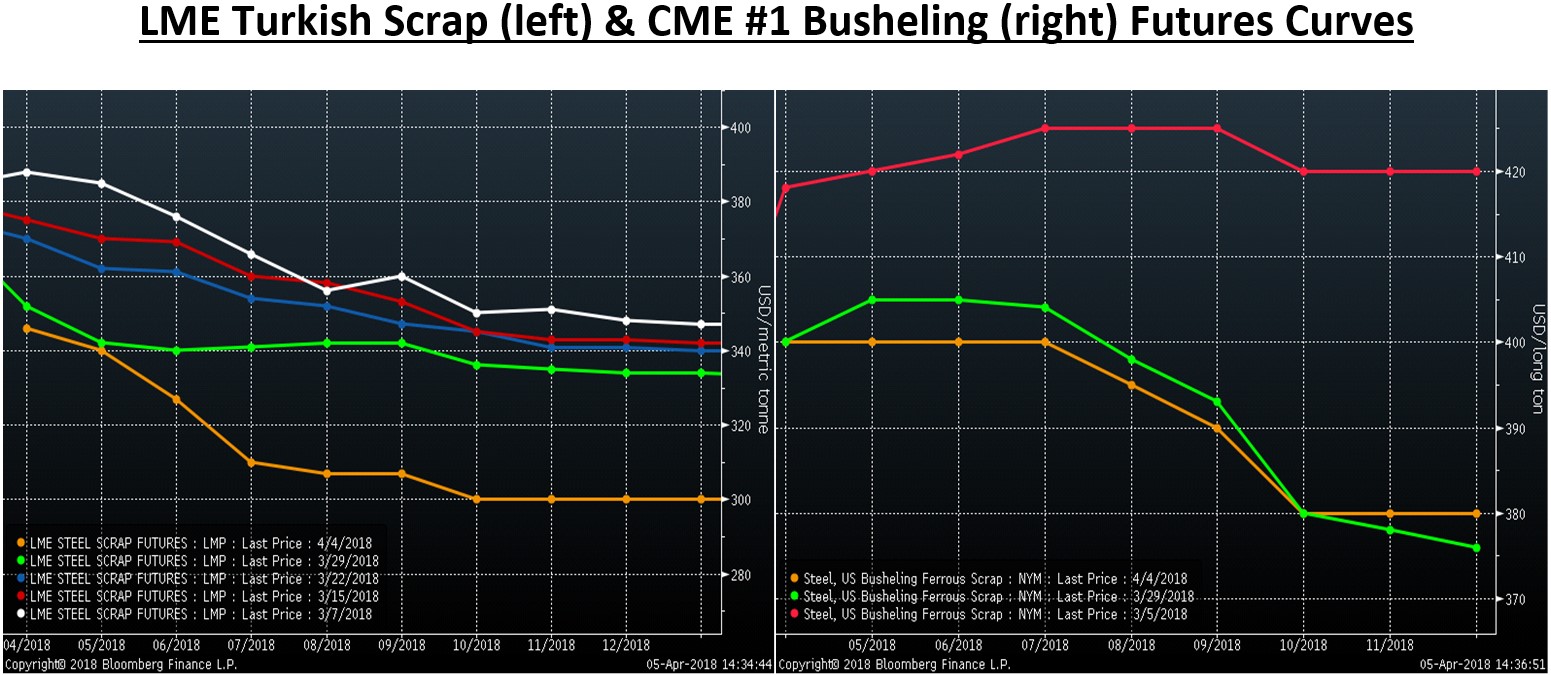
The scrap curves below are at their lows of the past few months.
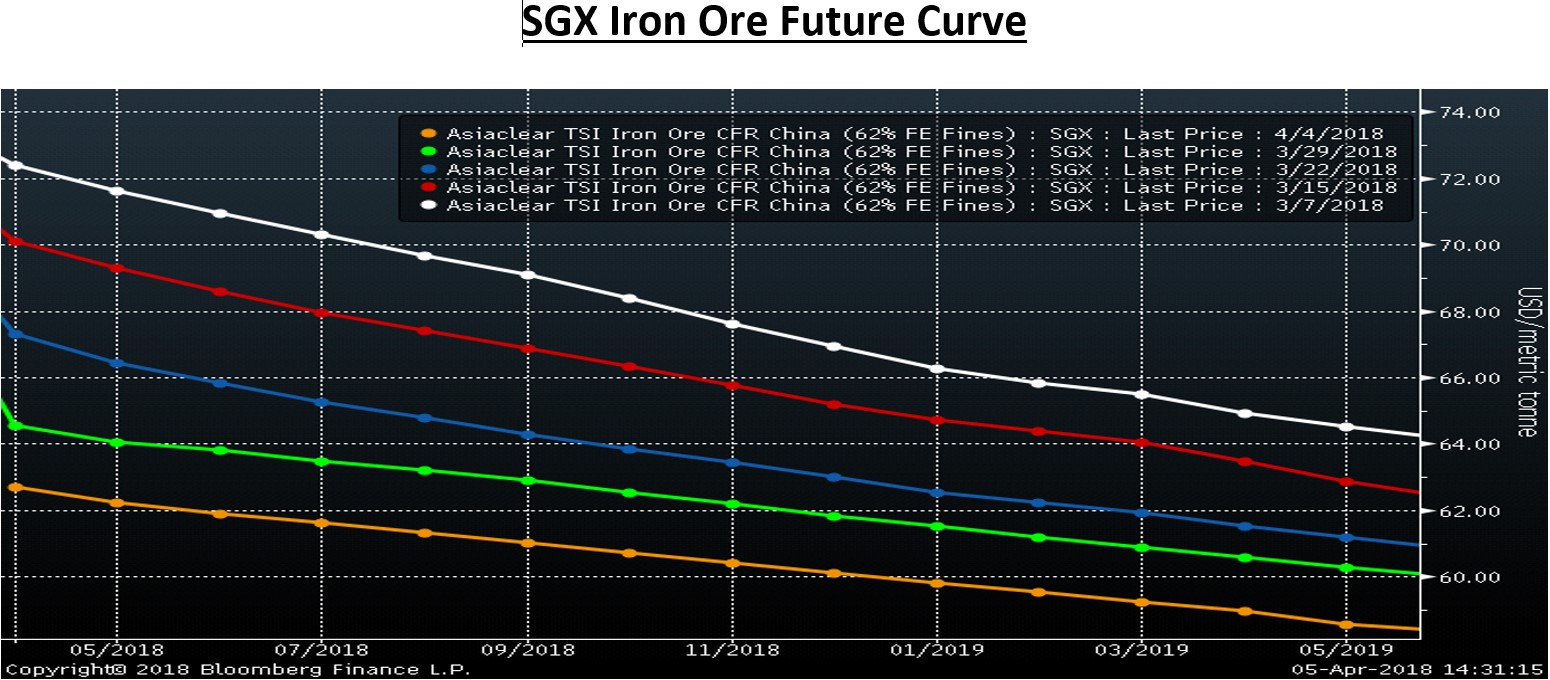
Iron ore futures continued to trade lower in the last week. Trading has dried up in the market as of yesterday due to the national Tomb Sweeping Festival holiday. China returns Monday.
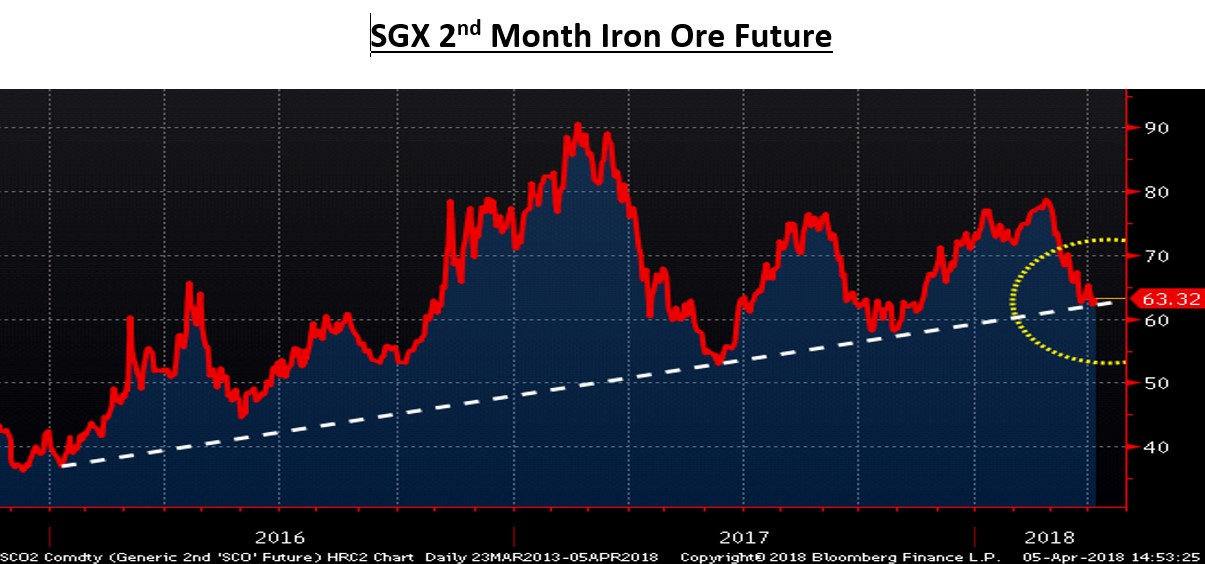
In the last article, this multi-year up trendline in the second month SGX iron ore future was being followed. Prices have so far found support trading right to the trendline and failing to break below it.
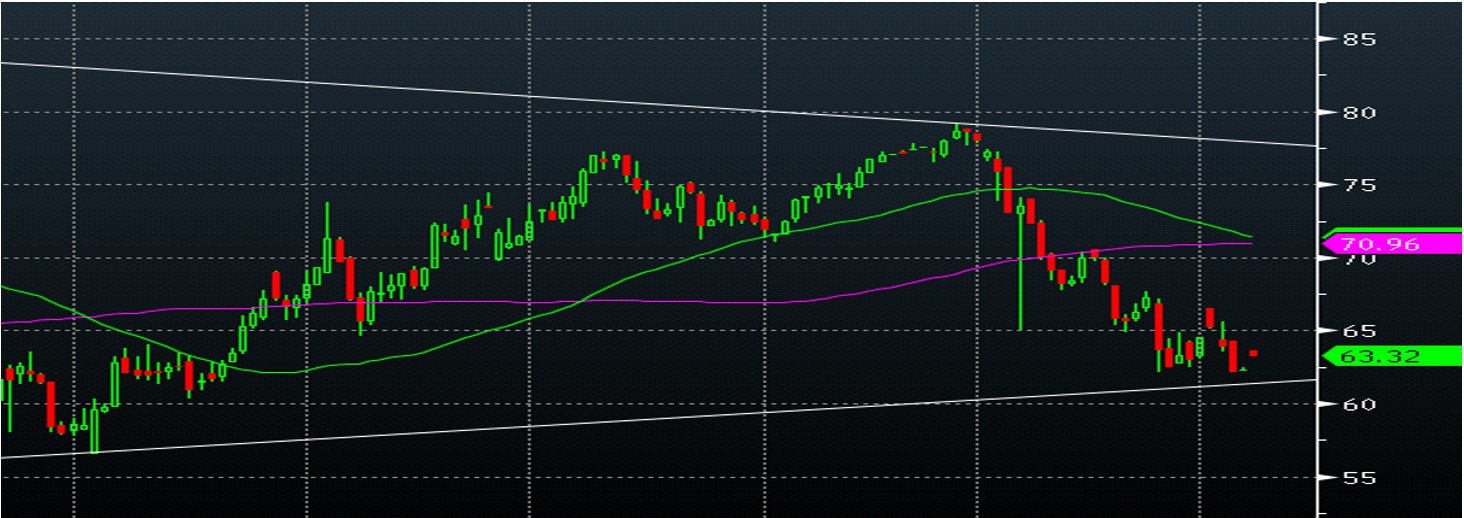
Here is closer view of how close to the trendline trading is, but so far prices are holding above it.
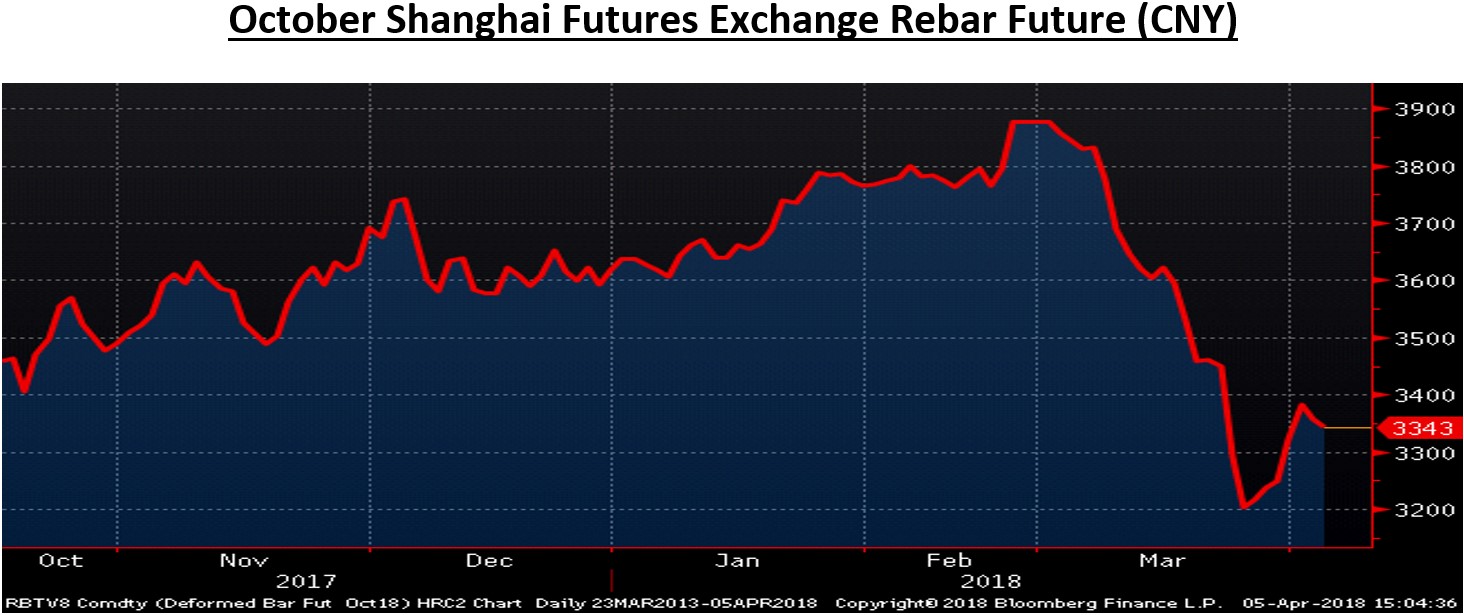
The Shanghai futures market usually leads the SGX market, so expect more clarity on Monday regarding iron ore. But regardless, prices are either going to bounce higher or break below the trendline very soon; $50 or $70 ore by next Friday wouldn’t be a surprise. However, last week there was a sharp bounce in Chinese rebar futures, which usually lead iron ore futures.
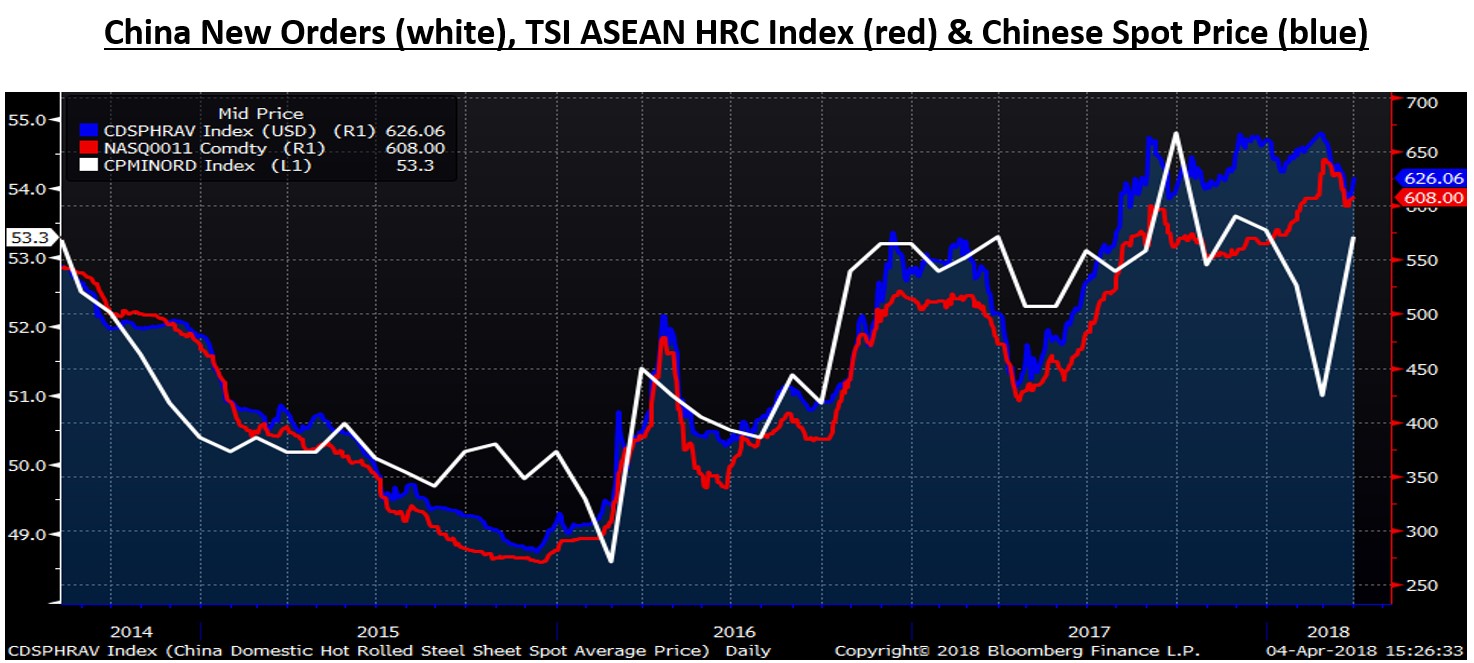
China’s manufacturing PMI also has a new orders sub-index, which jumped 2.3 points to 53.3, a very good sign for Chinese HRC prices and could also be further indication that iron ore is set to bounce.
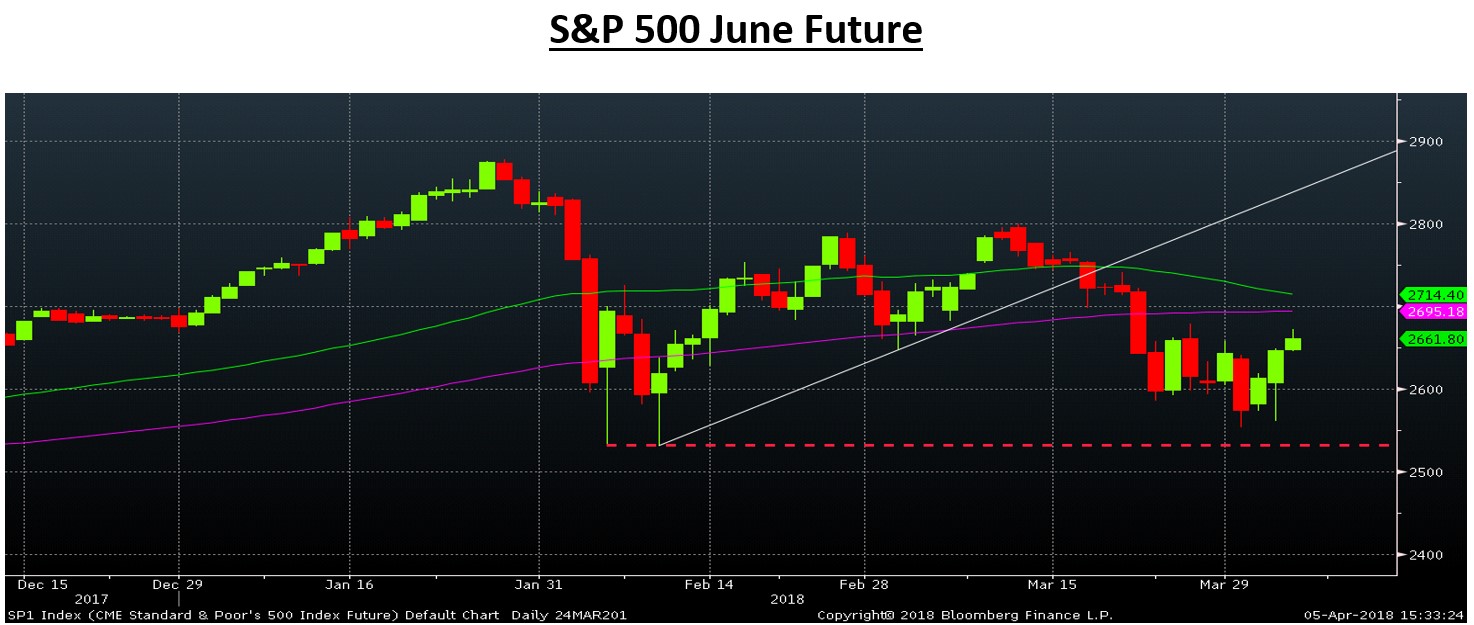
The S&P 500 has become much more volatile in 2018 and so far has held above the lows set in late January at 2530. Considering the elevated stock market, Federal Reserve’s rate hiking program and protectionist measures out of the White House and the resulting concerns of a trade war, the stock market could be an indication of things to come for the economy, especially if it breaks lower and saps confidence. Keep your eye on the 2530 level (dashed red line). If the market breaks below it, the market will be in for a very bumpy ride.