Prices
August 23, 2018
Hot Rolled Futures: Elevated Anxiety
Written by David Feldstein
The following article on the hot rolled coil (HRC) futures market was written by David Feldstein. As the Flack Global Metals Director of Risk Management, Dave is an active participant in the hot rolled futures market, and we believe he provides insightful commentary and trading ideas to our readers. Besides writing futures articles for Steel Market Update, Dave produces articles that our readers may find interesting under the heading “The Feldstein” on the Flack Global Metals website, www.FlackGlobalMetals.com. Note that Steel Market Update does not take any positions on HRC or scrap trading, and any recommendations made by David Feldstein are his opinions and not those of SMU. We recommend that anyone interested in trading steel futures enlist the help of a licensed broker or bank.
There seems to be an elevated level of anxiety across the steel industry in recent weeks. Chicken Little may have waddled through your factory floor screaming “the sky is falling!!!,” but he should be more nervous about the reality that he is gonna be served for lunch at next week’s SMU Summit.
The economy remains strong.
Inventory levels are low.
Supply is constrained.
The government is aggressively and proactively protecting domestic steel producers and supply.
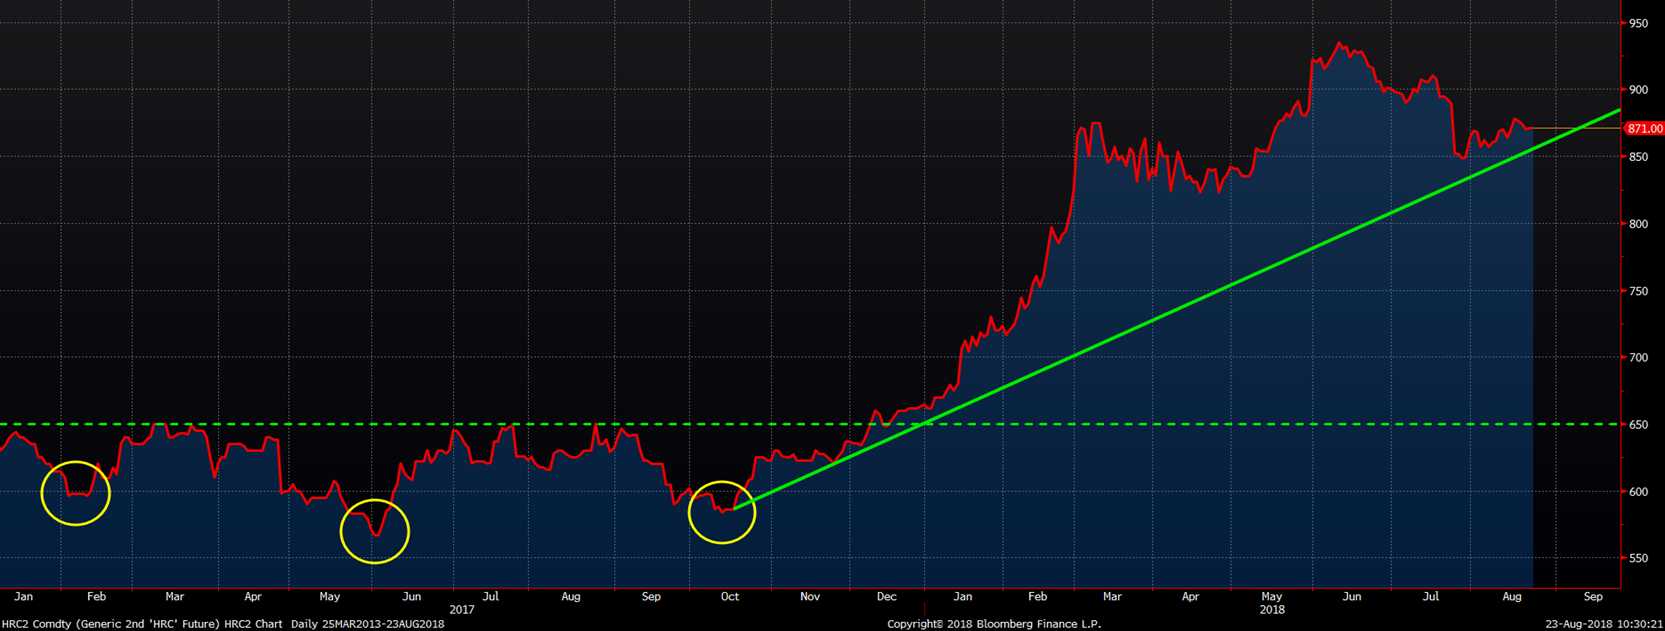
A favorite pasttime in the steel industry is to have long discussions about price directions, confirming opinions rooted in market participants’ “guts.” I prefer to look at hard data. Below is the chart used late last year pointing out the reverse head and shoulders and the $650 ceiling breakthrough. I have drawn a simple trendline from the low of October. The chart has held above this trendline with the recent correction finding support at the uptrend line. The first high made in March ($875) was followed by a higher high made in June ($935). The low point made in late July ($848) was higher than the low point made in late April ($831). Higher highs and higher lows are healthy signs of a rally, according to Dow theory. So, the rally continues, but we now have a line in the sand to watch. If futures trade below this line, we can shift into a more defensive mode. In the meantime, I’ll keep trading what has been working all year.
Rolling 2nd Month CME Midwest HRC Future
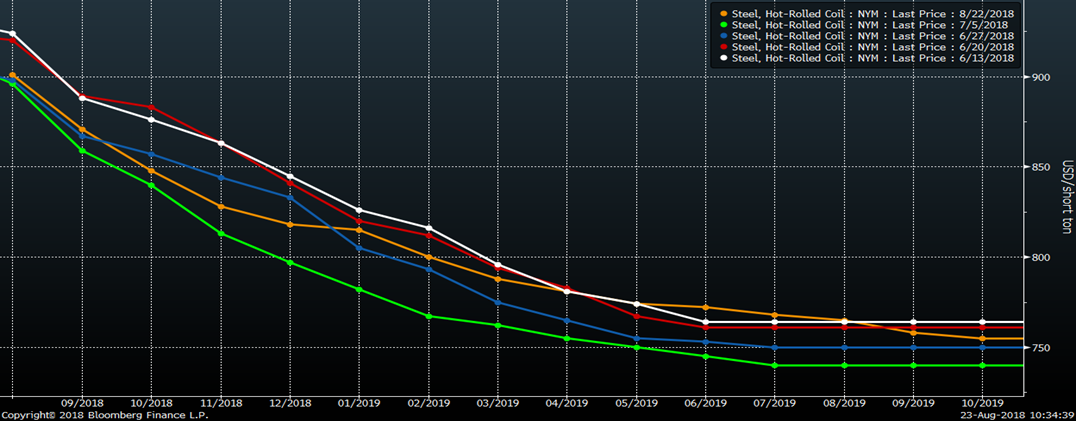
Below is a chart of the CME Midwest HRC futures curve. The white line was from the June, 13th settlement, the green line the July 5th settlement and the orange line from August 22nd. The first takeaway from this chart is that not much has really happened in the past two months. Prices have remained rangebound.
HRC futures made new highs following the administration’s revoking of tariff exculsions for Mexico, Canada and Europe last June. Prices then steadily moved lower off these extreme levels until the industry returned from the Fourth of July holiday when buyers looked to lock in forward pricing.
CME Midwest HRC Future Curve
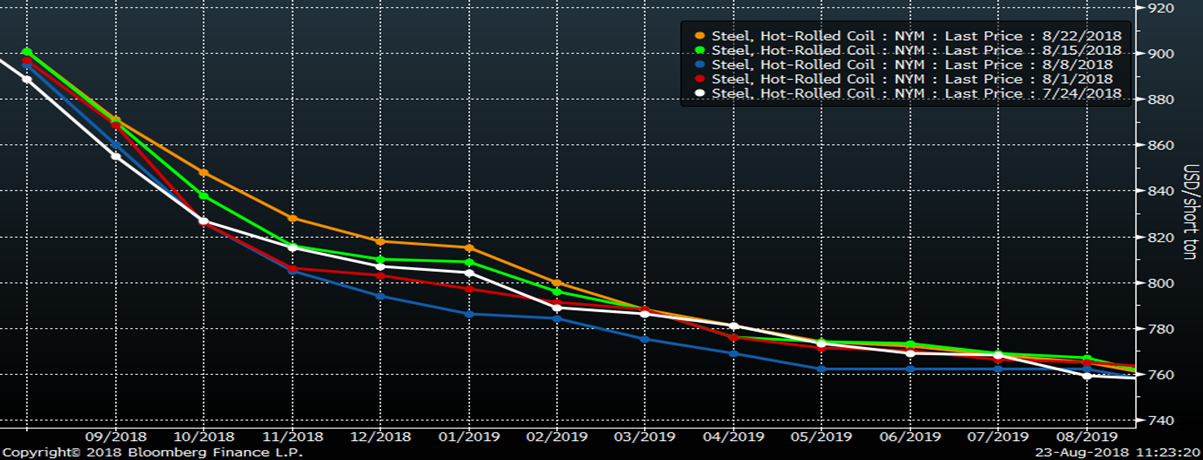
The chart below looks at the last five weeks. The administration’s announcement to increase the Turkish steel tariff to 50 percent was on August 10th. The blue line was the curve on August 8th. You can see that prices have moved higher since then with last night’s close at the highest level.
The conclusion to all of this is that although there is an elevated level of anxiety, very little has actually happened in the market as it has remained rangebound all summer. What has been working all year was to buy the backwardation of the curve.
CME Midwest HRC Future Curve
Futures market participants are either commercial hedgers, intermediaries (banks) or speculators. While more speculators have entered the market in the past year, most of the market participants are and have been commercial players. Of the commercial hedgers, there are those who want to execute a “carry trade,” which is done by selling futures against imported physical tons to be delivered some months later. Another commercial hedger would be those who own physical inventory, service centers being the most obvious. For both of these players, the sharply backwardated curve offers very few attractive solutions and little help. However, for steel mills that are procuring raw materials to convert into flat rolled steel, the curve provides a very attractive solution as ore and scrap prices have remained flat throughout the year and their curves are backwardated, thus allowing mills the opportunity to lock in a sizeable “metal spread” profit. The last type would be OEMs who have the opportunity to lock in future prices sharply discounted to current spot pricing, and for this group the curve does offer opportunity.
One question we have been discussing in the halls of Flack Global Metals is what would the HRC price be if there were no tariffs? Our guess would be $680-700. Tariff adjusted, that comes out to $850-875. Along that line of thinking, the curve offers some interesting opportunities to buy well below those prices in the not-so-distant future. Going back to the curve on July 5th above, it looks like that was the realization that put a floor in the futures market.
CME Midwest HRC Future Curve
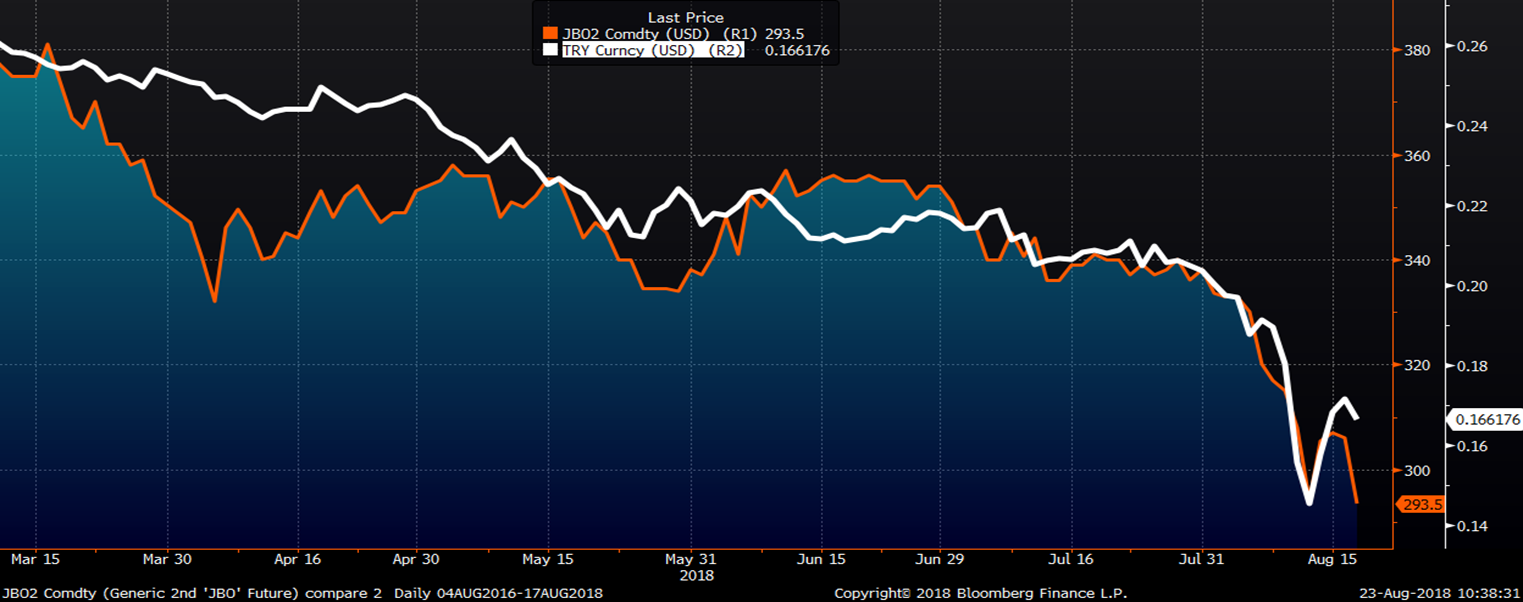
Turkish scrap has dropped sharply as Turkey’s financial markets and currency plummeted. The 2nd month LME Turkish scrap future has fallen from $340 to $293.50/t in August.
LME 2nd Month Rolling Turkish Scrap Future (orange) & Turkish Lira (white)
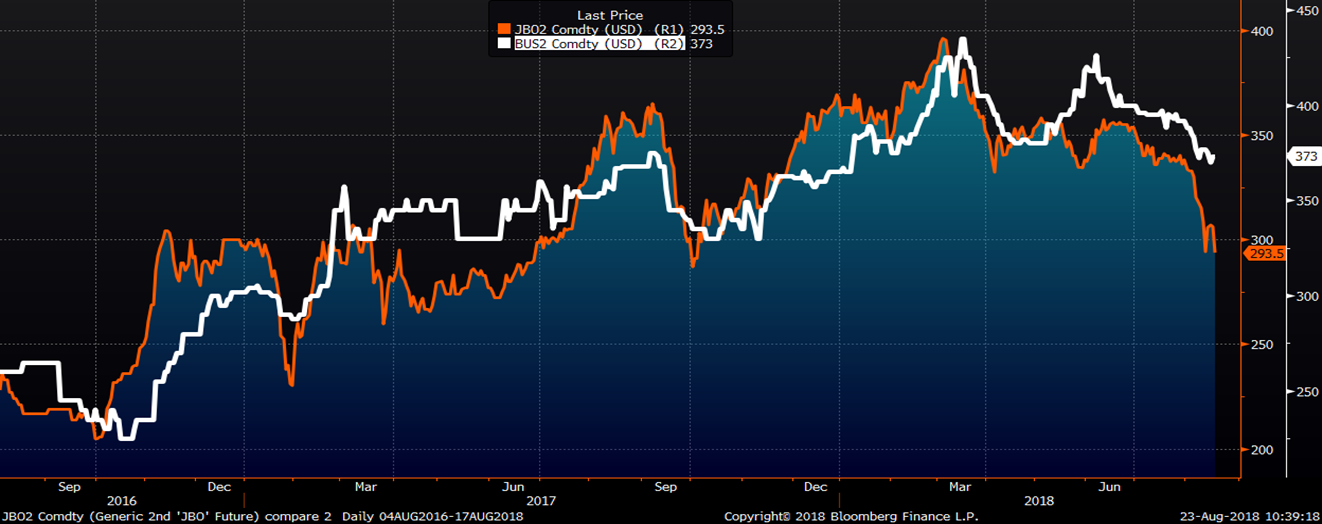
The September CME busheling future has been dragged lower by these developments.
2nd Month Rolling LME Turkish Scrap Future (orange) & CME Busheling Future (white)
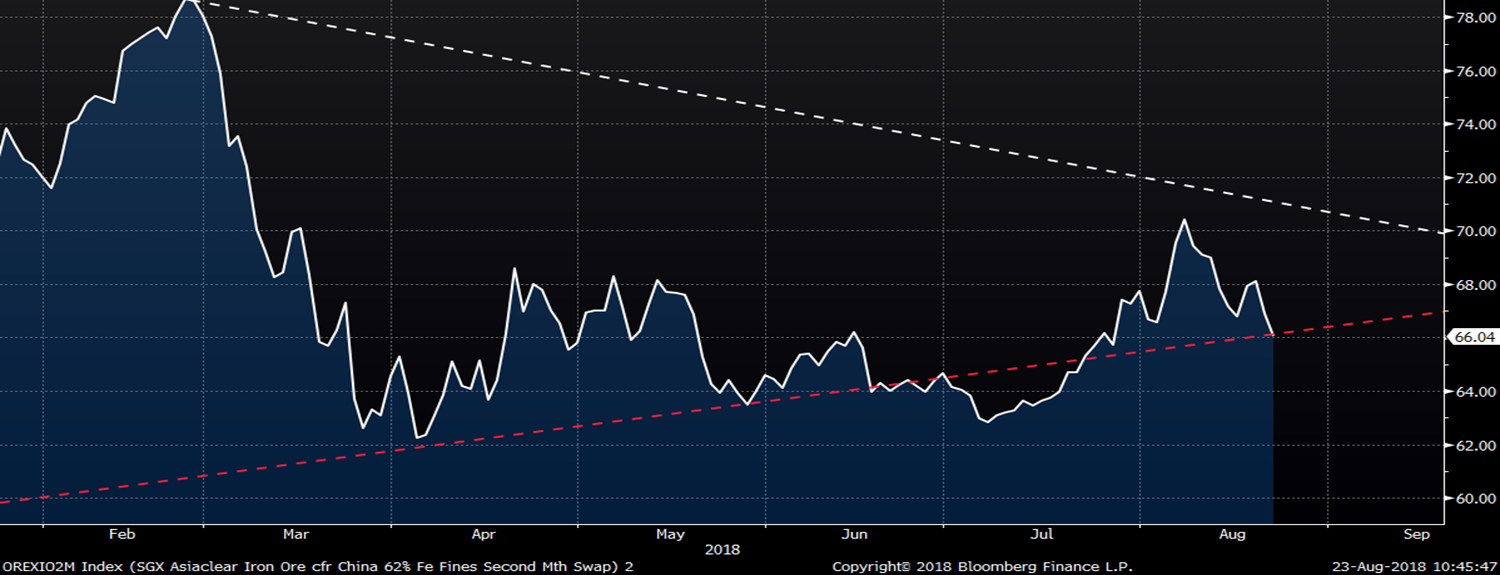
September SGX iron ore futures broke back below the long-term uptrend line we’ve been following after failing to rally above $70 in mid-August.
2nd Month Rolling SGX Iron Ore Future