

Market Data

July 29, 2021
GDP Grows By 6.5% in Q2’s Initial Estimate
Written by David Schollaert
U.S. gross domestic product (GDP) grew by 6.5% in the second quarter of 2021 on an annualized basis, according to the advanced estimate from the Bureau of Economic Analysis (BEA). While the gain was the second-fastest pace of growth in 38 years, it was a disappointing mark, falling short of forecasts for 8% GDP. The second quarter’s 6.5% growth rate was slightly better than the 6.3% gain in Q1, which was revised down slightly.
The increase in real GDP in the second quarter came thanks to increases in personal consumption expenditures, which rose 11.8% as consumers accounted for 69% of all activity. Nonresidential fixed investment, exports, and state and local government spending also helped boost growth. The increases were partly offset by a decrease of 3.5% in gross private domestic investment, as declines in private inventory and residential investment held back gains. Rising imports and a 5% decline in the rate of federal government spending were also factors, the BEA said.
Acceleration of economic activity in the U.S. – the fourth consecutive quarter of growth – came as business reopenings and government aid powered a surge over the past two quarters, and for the first time since the pandemic took hold economic output eclipsed its pre-pandemic high.
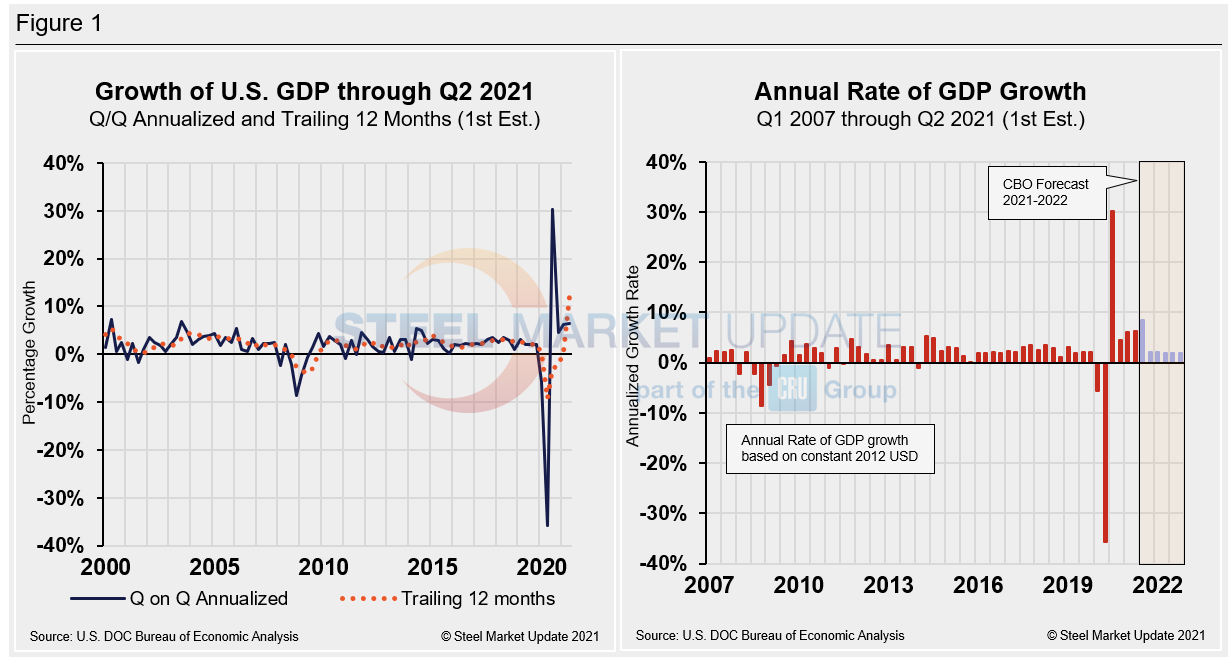
The Department of Commerce’s advanced look at U.S. GDP in Q2 totaled $22.72 trillion, a 13.0% or $684.4 billion increase from the previous quarter, measured in chained 2012 dollars on an annualized basis. Below in Figure 1 is a side-by-side comparison of the growth of U.S. GDP and the annual rate of GDP, both through Q2 2021. In the first chart, the orange dotted line is the trailing 12-month growth and the dark blue line is the headline quarterly result. The chart on the right details the headline quarterly results since Q1 2007 including the Congressional Budget Office’s GDP projection through 2022. On a trailing 12-month basis, GDP shot up to 12.17% in Q2, a surge from the 0.40% in Q1, and a huge improvement from negative 9.04% seen one year ago at the height of the pandemic. For comparison, the average in 46 quarters since Q1 2010 has been a growth rate of 1.96%.
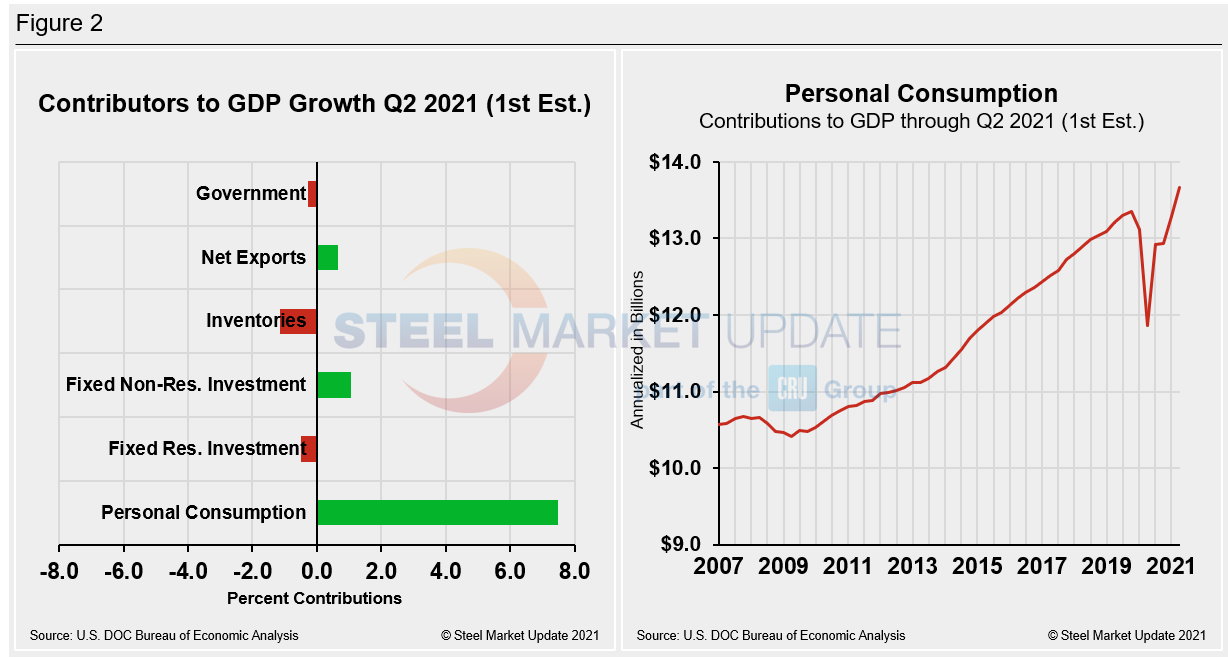
Shown below in Figure 2 is a side-by-side comparison of two charts. On the left is the mix of the six major components in the GDP growth calculation, while the chart on the right puts a spotlight on personal consumption. The most notable change and major source of GDP fluctuation is still personal consumption, which saw a negative 24.01% contribution a year ago, followed by a positive 25.44% contribution in Q3 last year. Personal consumption has gone from 1.58 in Q4 to 7.42 in Q1. Presently personal consumption, which typically reflects consumer confidence and spending engagement, edged up to 7.48 in the second quarter. The gain in personal consumption underscores the impressive economic turnaround in the U.S.
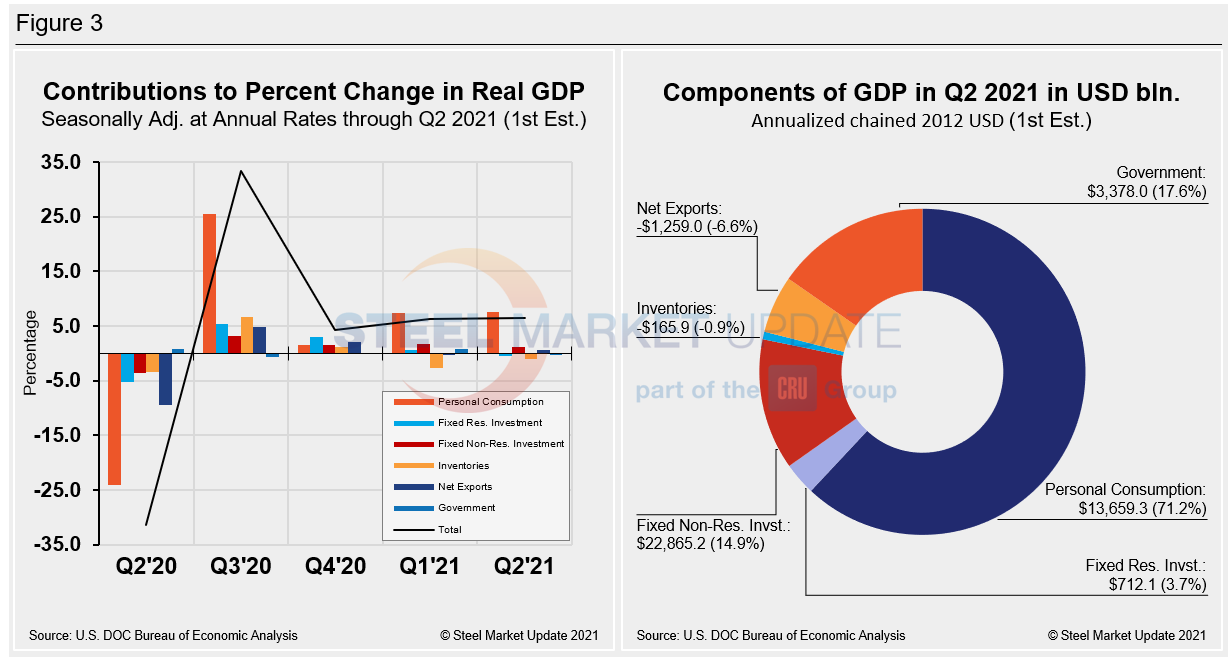
Quarterly contributions of the six major subcomponents of GDP since Q2 2020 and the breakdown of the $22.72 trillion economy in BEA’s advanced estimate of Q2 GDP are both shown in Figure 3. The chart on the left is detailed out for cross-comparison with Figure 1 above. The chart on the right shows the size of the other components relative to personal consumption.
SMU Comment: Although the second quarter fell short of many forecasts, the reported 6.5% annual rate of growth – pushing the economy’s size beyond its pre-pandemic level – is a strong measure of the economy’s ongoing recovery. While the current growth rate may slow in coming months due to the COVID-19 concerns and materials and labor shortages that are clouding the outlook, July’s consumer confidence report suggests the marketplace is well positioned for further growth.
By David Schollaert, David@SteelMarketUpdate.com


