

Market Data

October 1, 2021
Final Revision: U.S. GDP Grew at a 6.7% Rate in Q2
Written by David Schollaert
U.S. gross domestic product (GDP) grew by a healthy 6.7% in the second quarter of 2021 on an annualized basis, slightly faster than the 6.6% previously estimated, according to the Bureau of Economic Analysis (BEA). This third and final review was adjusted higher thanks to upward revisions in personal consumption expenditures, exports and private inventory investment. Those were partially offset by increased imports, which are a subtraction in the calculation of GDP.
Although supply-chain disruptions and labor shortages continue to hinder the U.S. economy, the latest upward revision to Q2’s results marks the fourth consecutive quarter of growth in the U.S. economy. Yet, some economists note that the second quarter could represent the peak in growth as fiscal stimulus measures start to wind down. Many are looking past the latest GDP data and instead are focused on how a fourth wave in COVID-19 infections during the summer has impacted activity. Growth estimates for the third quarter are below a 5% rate, while inflation climbed at a 6.5% annual clip in the second quarter.
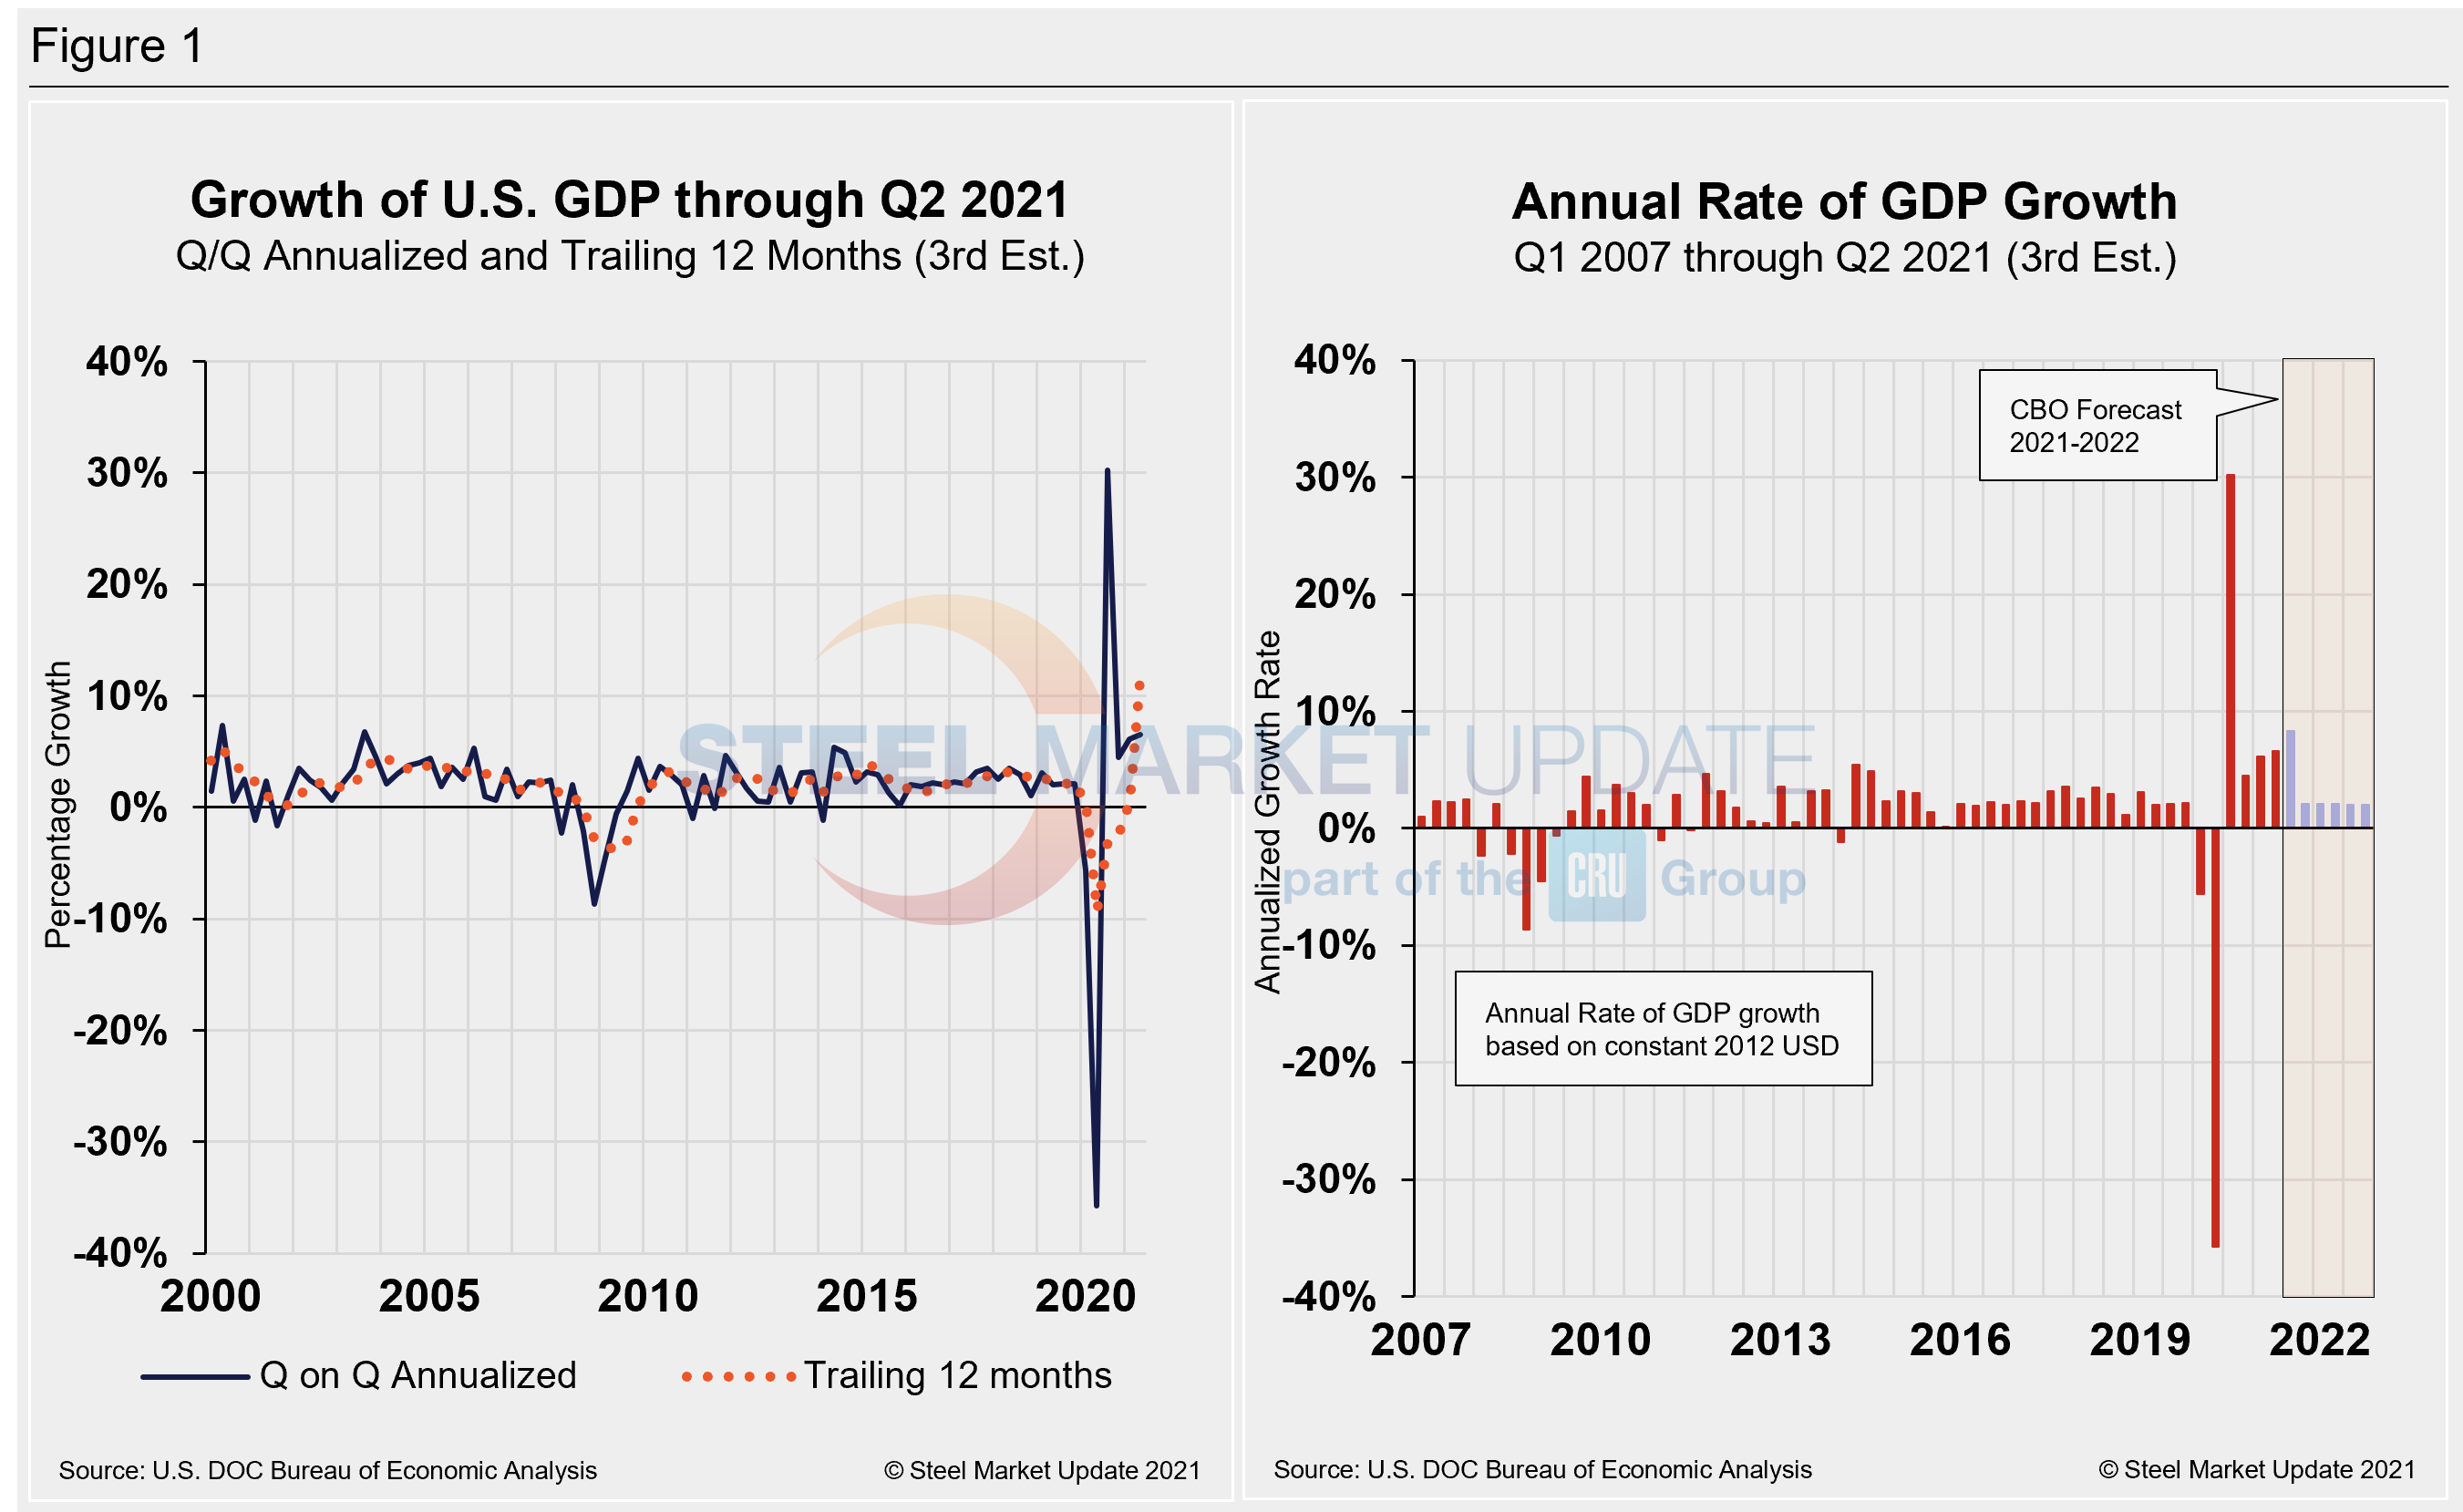
The Department of Commerce’s third look at U.S. GDP in Q2 totaled $22.74 trillion, a 13.4% or $702.8 billion increase from the previous quarter, measured in chained 2012 dollars on an annualized basis. Below in Figure 1 is a side-by-side comparison of the growth of U.S. GDP and the annual rate of GDP, both through Q2 2021. In the first chart, you’ll see the contrast between the trailing 12-month growth (orange dotted line) and the headline quarterly result (dark blue line). The chart on the right details the headline quarterly results since Q1 2007 including the Congressional Budget Office’s GDP projection through 2022. On a trailing 12-month basis, GDP shot up to 12.23% in Q2, a surge from the 0.55% in Q1, and a huge improvement from -9.27% seen one year ago at the height of the pandemic. For comparison, the average in 46 quarters since Q1 2010 has been a growth rate of 1.96%.
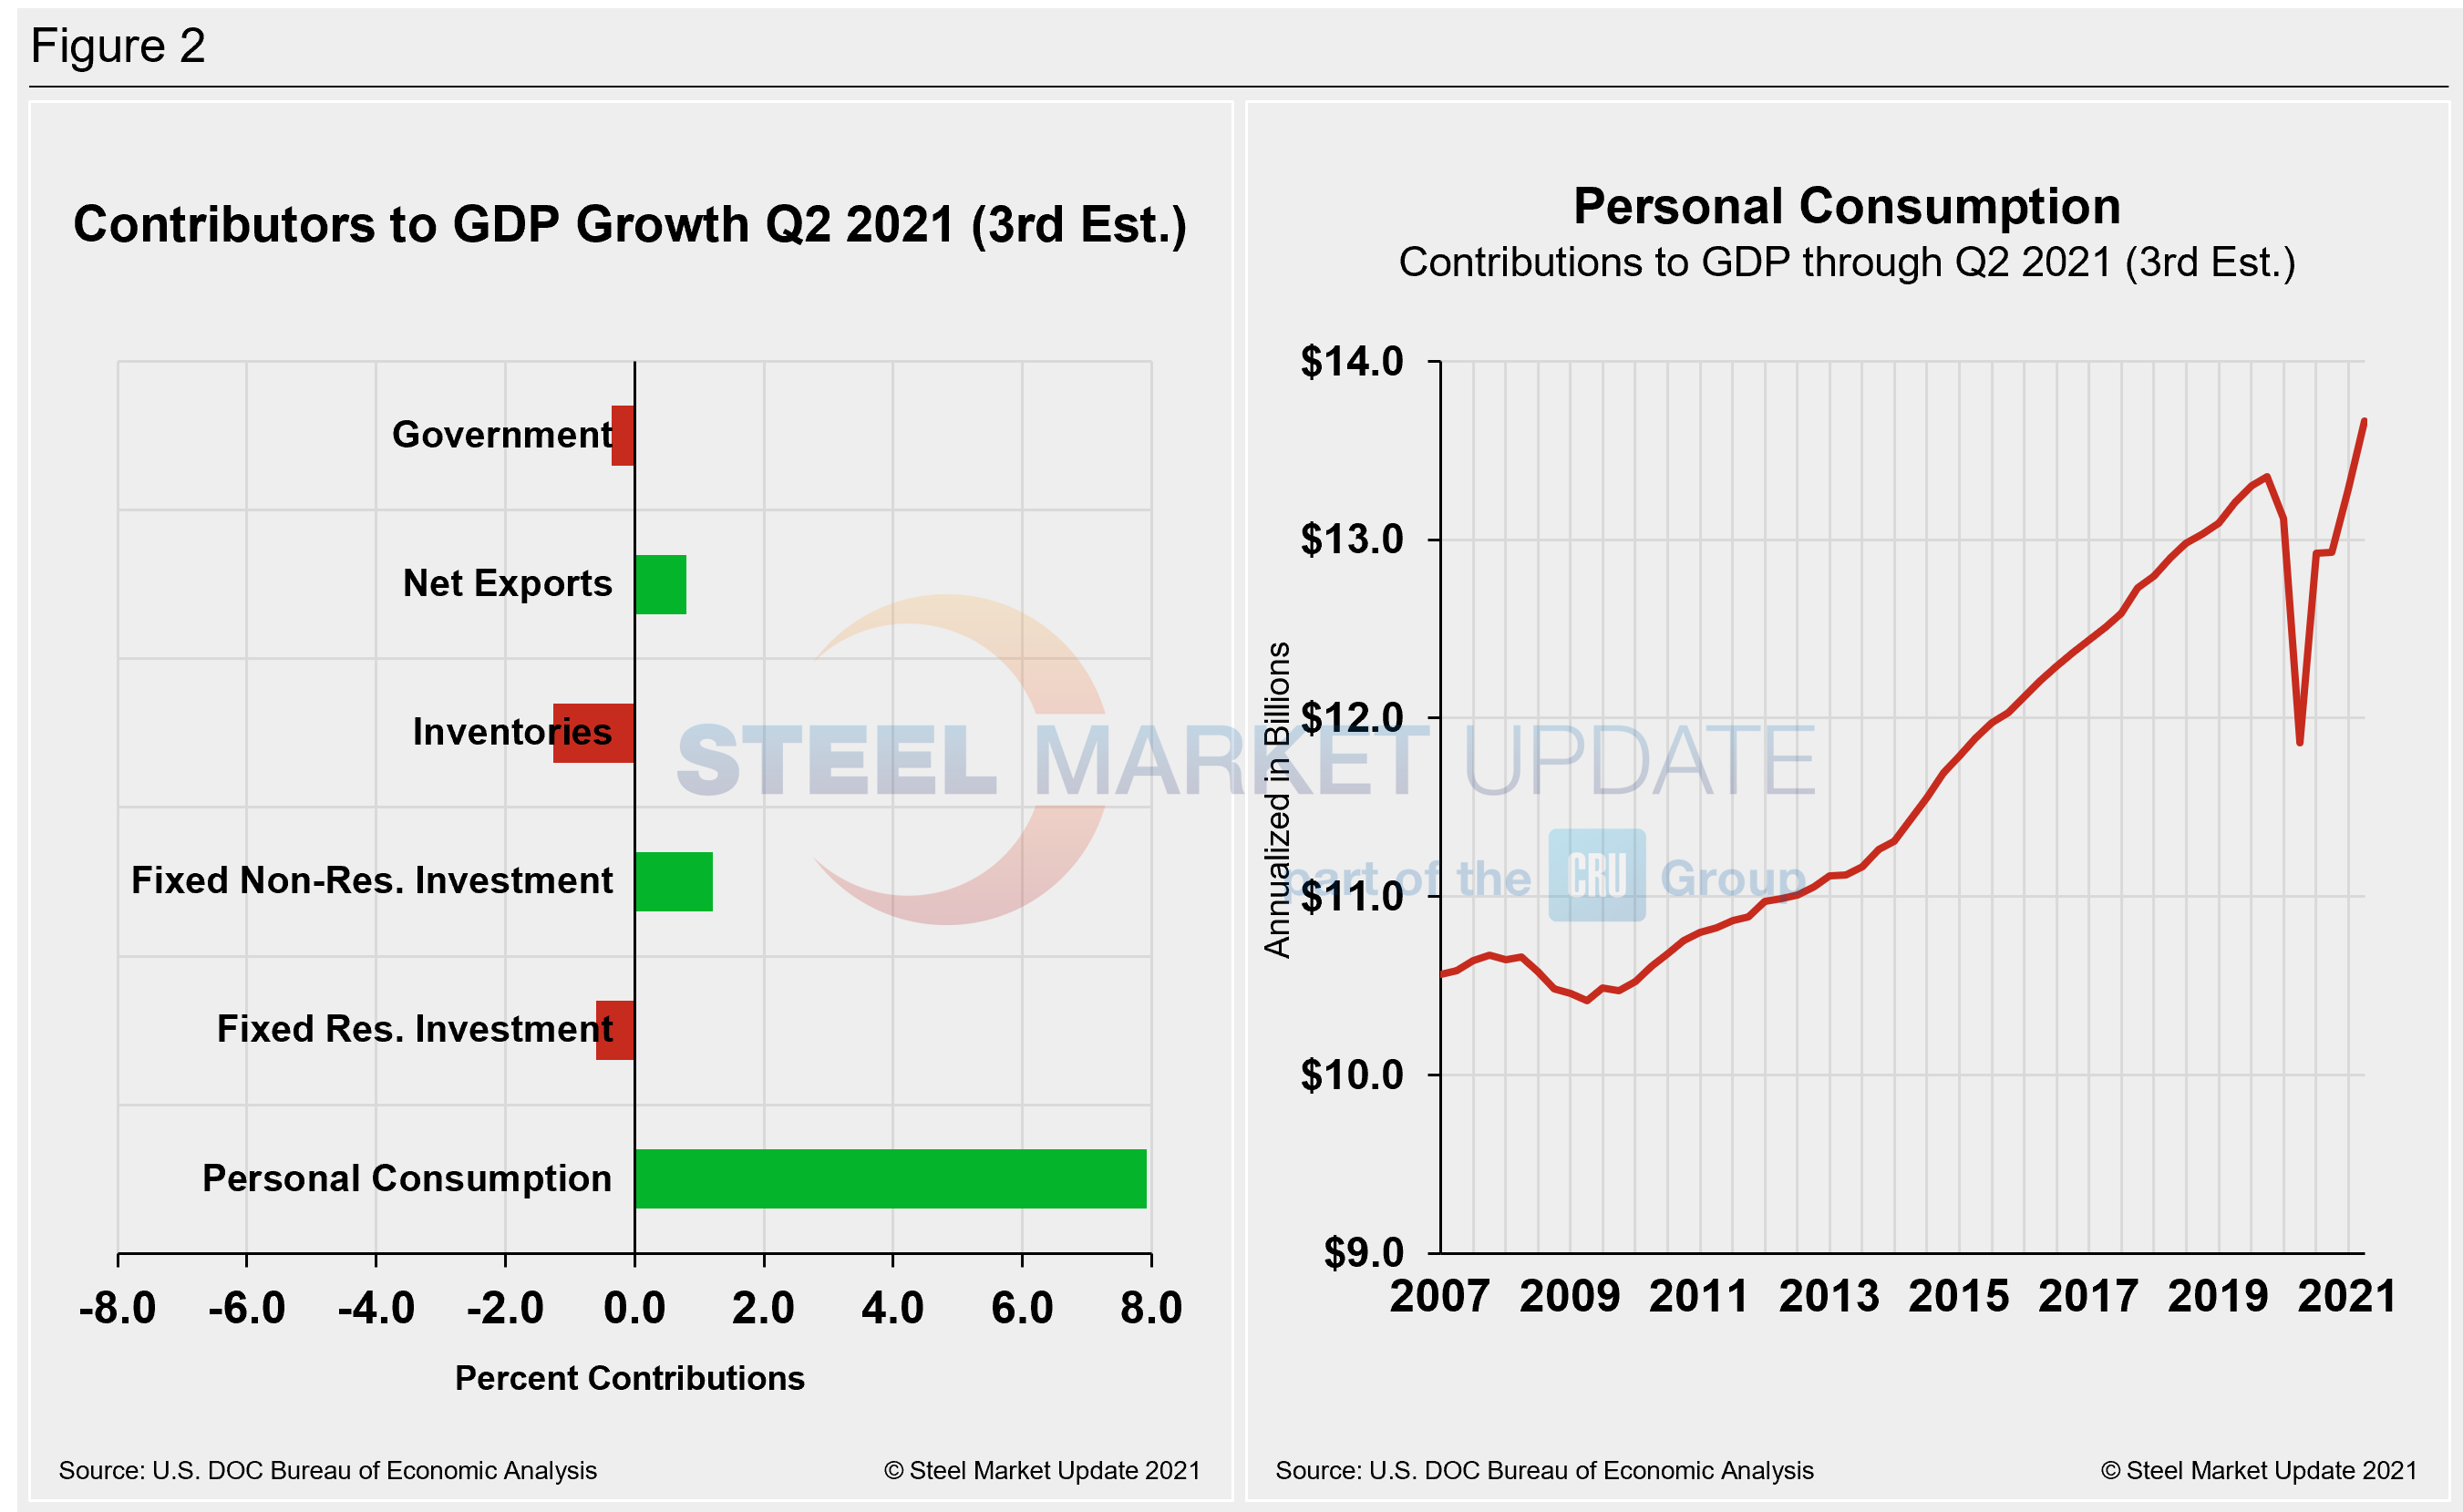
Shown below in Figure 2 is a side-by-side comparison of two charts. On the left is the mix of the six major components in the GDP growth calculation, while the chart on the right puts a spotlight on personal consumption, a measure of consumer confidence and spending engagement. The most notable change and major source of GDP fluctuation is personal consumption, which saw a negative 24.01% contribution a year ago after the onset of COVID, followed by a positive 25.44% contribution in Q3 last year as the economy reopened. Personal consumption jumped from 1.58% in Q4 to 7.42% in Q1, edging up to 7.92% in Q2’s third estimate. The extreme shifts the U.S. economy has faced over the past 12-16 months can be seen in the big swings in personal consumption.
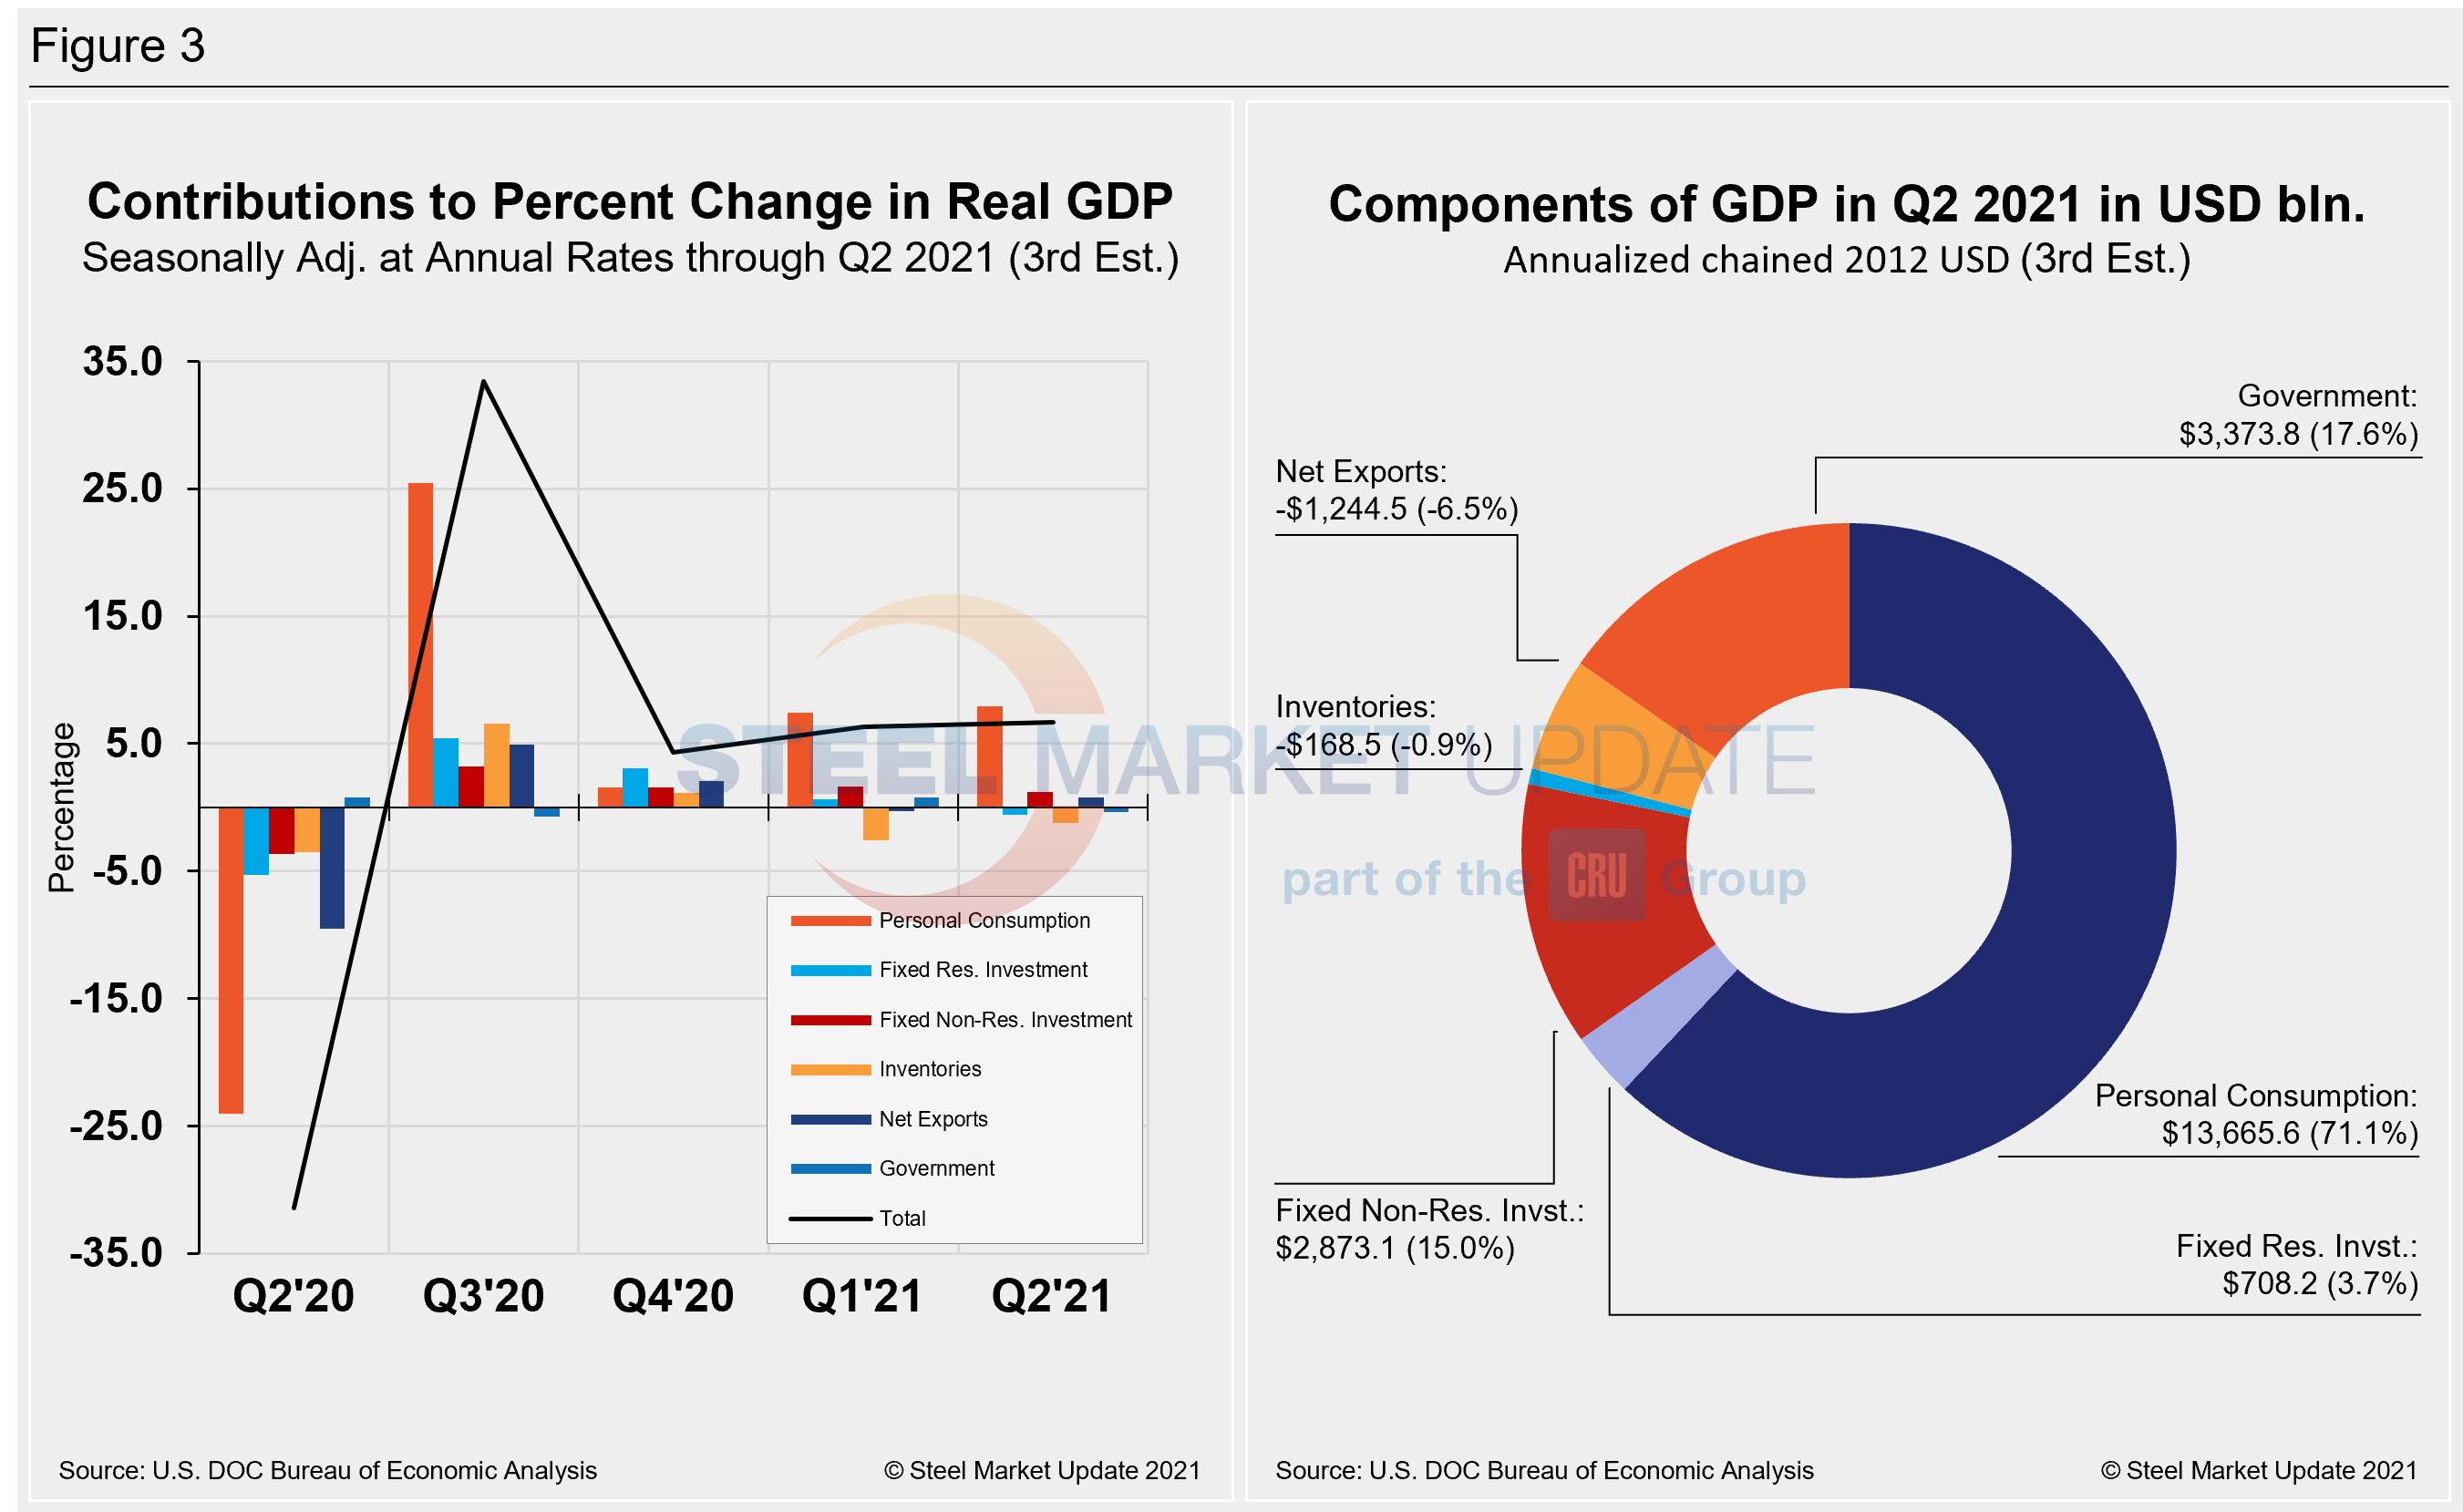
Quarterly contributions of the six major subcomponents of GDP since Q2 2020 and the breakdown of the $22.74 trillion economy in BEA’s second estimate of Q2 GDP are both shown in Figure 3. The chart on the left is detailed out for cross-comparison with Figure 1 above. The chart on the right shows the size of the other components relative to personal consumption.
SMU Comment: At an annual growth rate of 6.7% in Q2’s third revision, the U.S. economy has seen outstanding growth, pushing well beyond its pre-pandemic level. Some economists have sounded the alarm over possible stagflation, a period of low growth and higher inflation that could threaten the economy’s progress. This idea was further detailed by Federal Reserve Chair Jerome Powell, acknowledging earlier this week that supply-side constraints appear to be slowing down economic activity. The attention now shifts to third-quarter GDP results, where the pace of growth is expected to slow.
By David Schollaert, David@SteelMarketUpdate.com


