

Market Data

October 1, 2021
U.S. GDP’s Advance Q3 Estimate Disappoints at Just 2.0% Growth
Written by David Schollaert
U.S. gross domestic product (GDP) grew at a 2.0% annual rate in the third quarter, the slowest pace in more than a year, according to the Bureau of Economic Analysis (BEA). The Delta variant is likely to blame for slowing U.S. economic growth in the third quarter. Consumer spending was stifled as the new strain of COVID-19 flared up, further straining global supply chains and causing shortages across consumer goods.
The latest review by the BEA is a backward-looking glimpse at the economy’s worst quarter since the recovery began. Looking ahead, much will depend on the virus’ path and whether higher prices, enduring supply-chain disruptions and a shaky job market dampen consumer spending going into the holiday season. If the positive trends pile up – assuming no major stumbles in the final three months of the year – economists believe the economy should grow by more than 5% overall in 2021. That would be its strongest year since 1984, when GDP grew by more than 7% in a rebound from a double-dip recession.
The BEA’s first review of the country’s real GDP in the third quarter reflected increases in private inventory investment, personal consumption expenditures, state and local government spending, and nonresidential fixed investment. Those were partly offset by decreases in residential fixed investment, federal government spending, and an increase in exports, which are a subtraction in the calculation of GDP.
Net exports served as a drag yet again on headline GDP and subtracted 1.1 percentage points from the headline rate, owing to a yawning trade deficit. The goods trade gap widened to a record high in September as exports sank and imports rose, with businesses attempting to bring in goods to keep pace with demand.
Consumption, the largest component of U.S. GDP comprising about two-thirds of overall economic activity, slowed to a 1.09% rate in the third quarter, also marking the weakest pace since the fourth quarter of 2018.
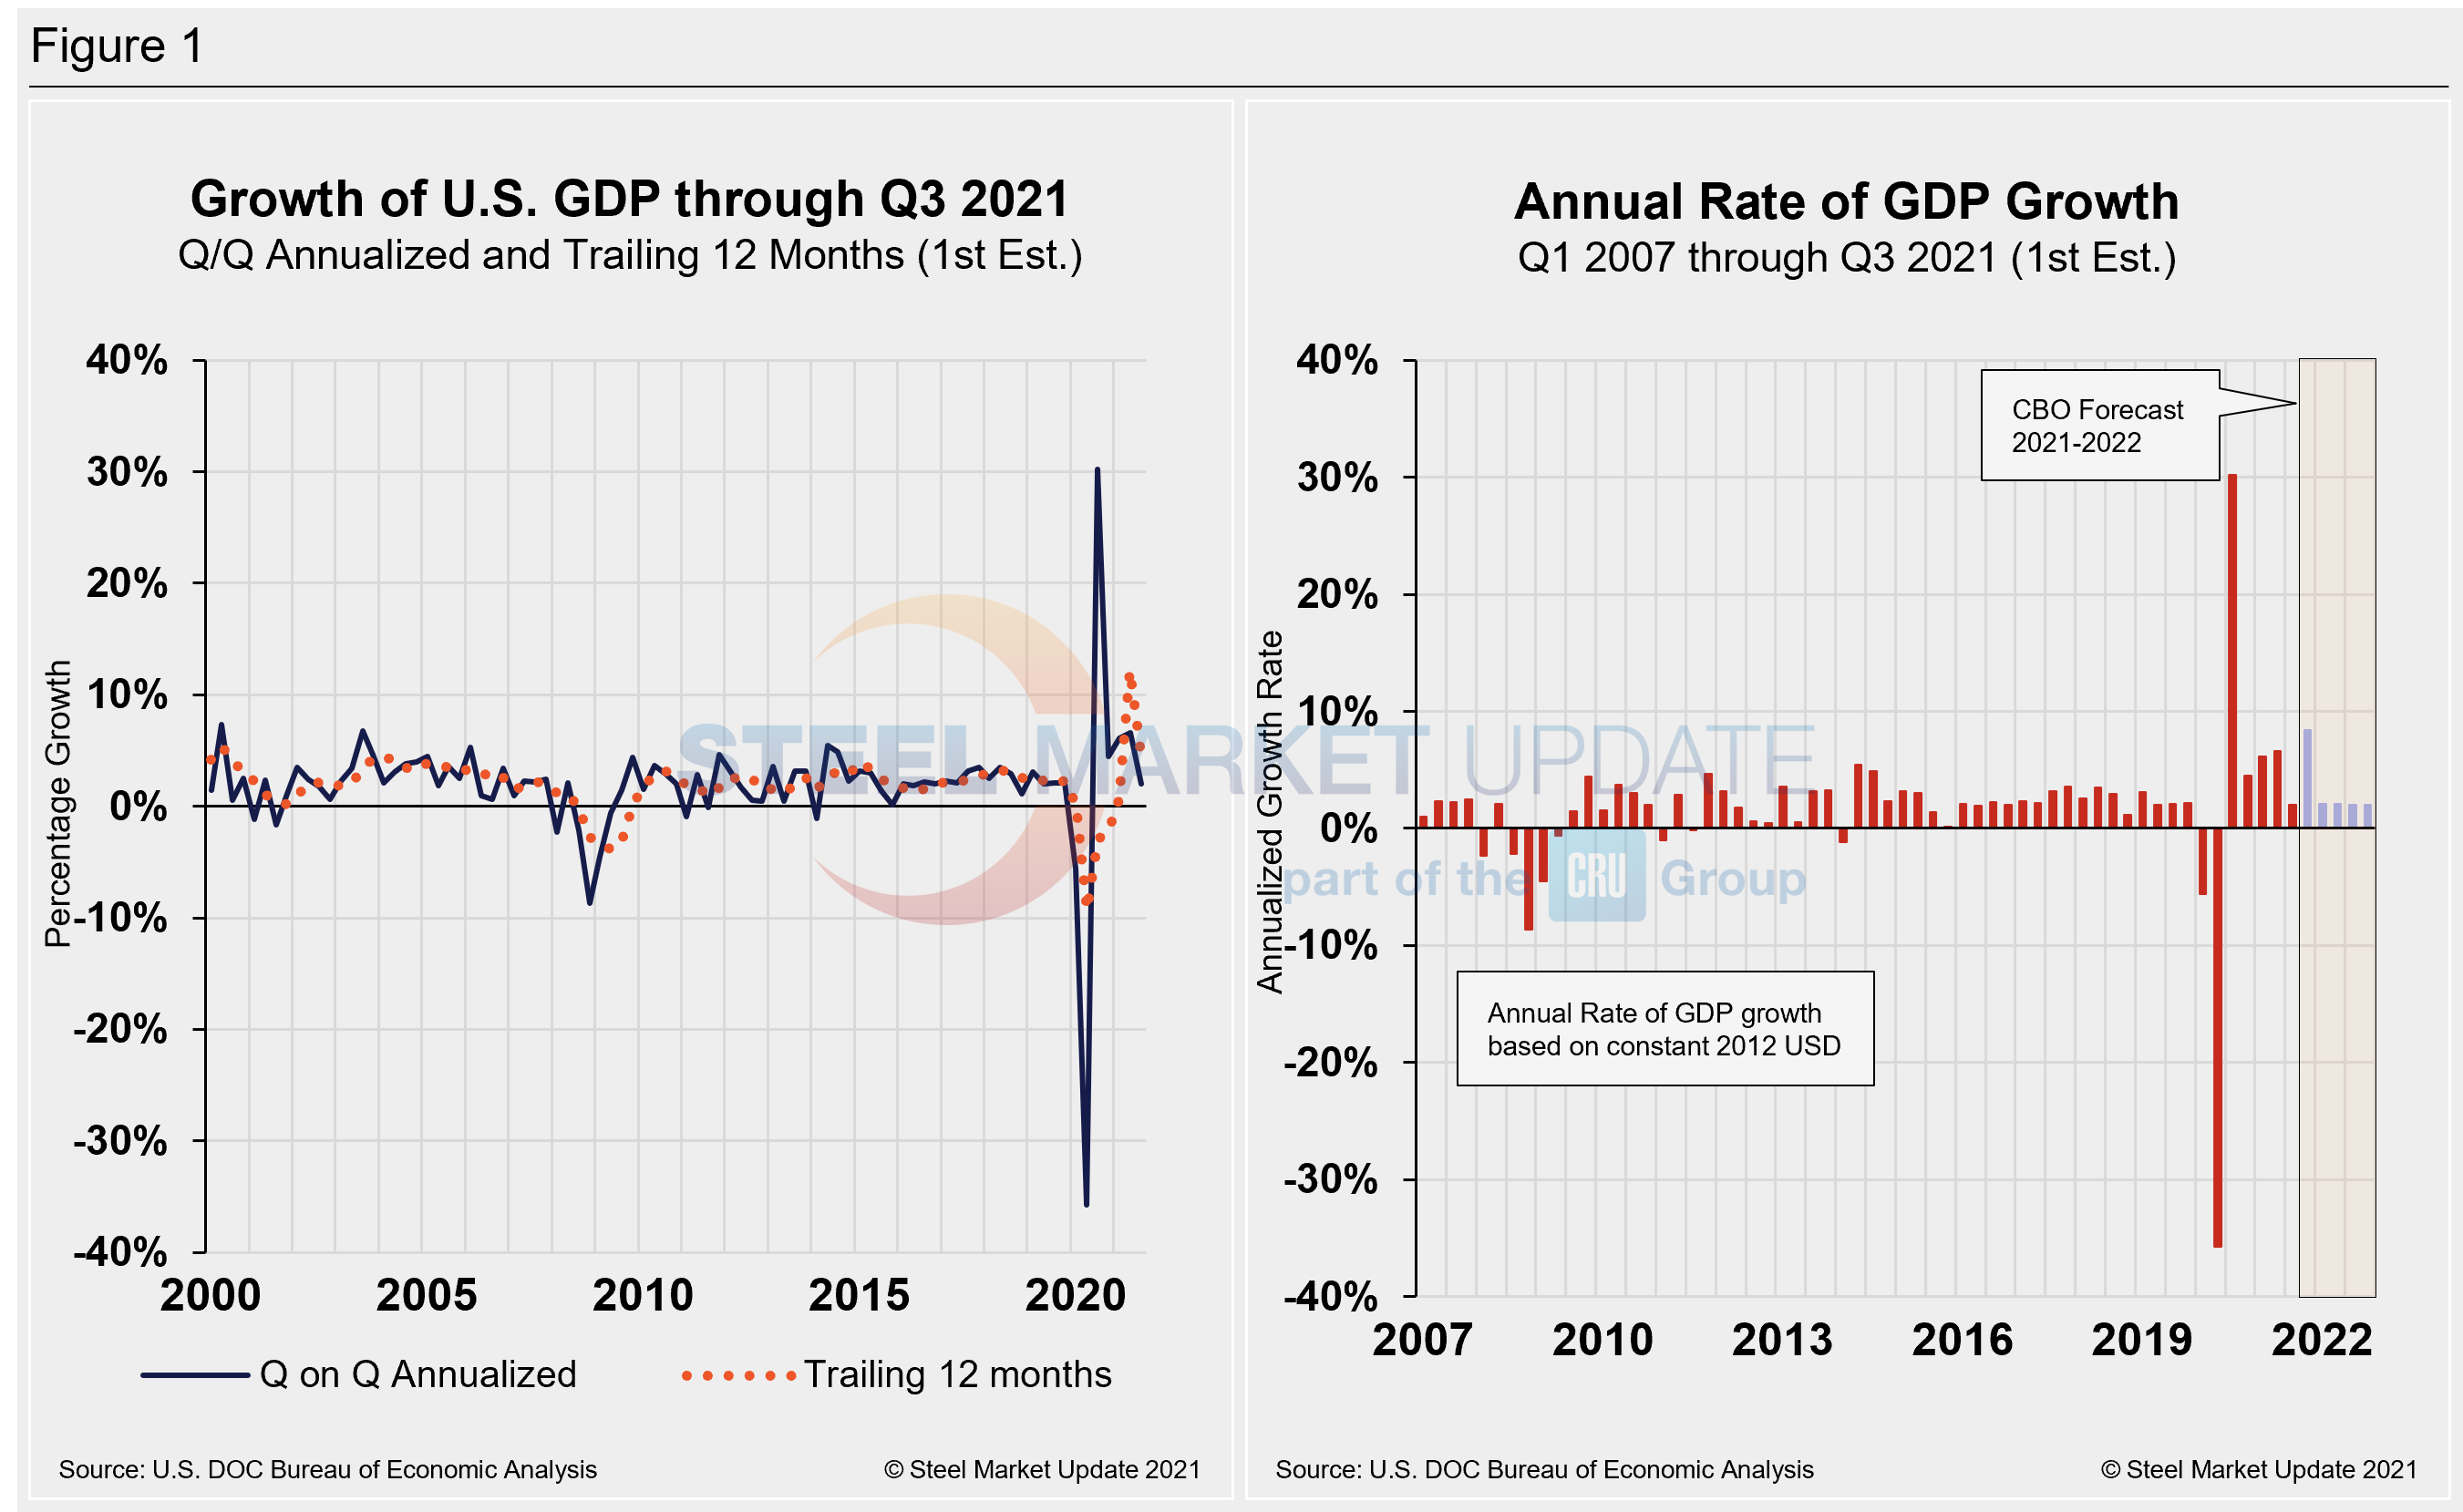
The Department of Commerce’s first look at U.S. GDP in Q3 totaled $23.17 trillion, a 7.8% or $432.5 billion increase from the previous quarter, measured in chained 2012 dollars on an annualized basis. Below in Figure 1 is a side-by-side comparison of the growth of U.S. GDP and the annual rate of GDP, both through Q3 2021. In the first chart, you’ll see the contrast between the trailing 12-month growth and the headline quarterly result. The chart on the right details the headline quarterly results since Q1 2007 including the Congressional Budget Office’s GDP projection through 2022. On a trailing 12-month basis, GDP decelerated to 4.87% in the third quarter, a steep fall from 12.23% in Q2, but still a vast improvement from -9.27% in Q2 2020 at the height of the pandemic. For comparison, the average in 47 quarters since Q1 2010 has been a growth rate of 2.06%.
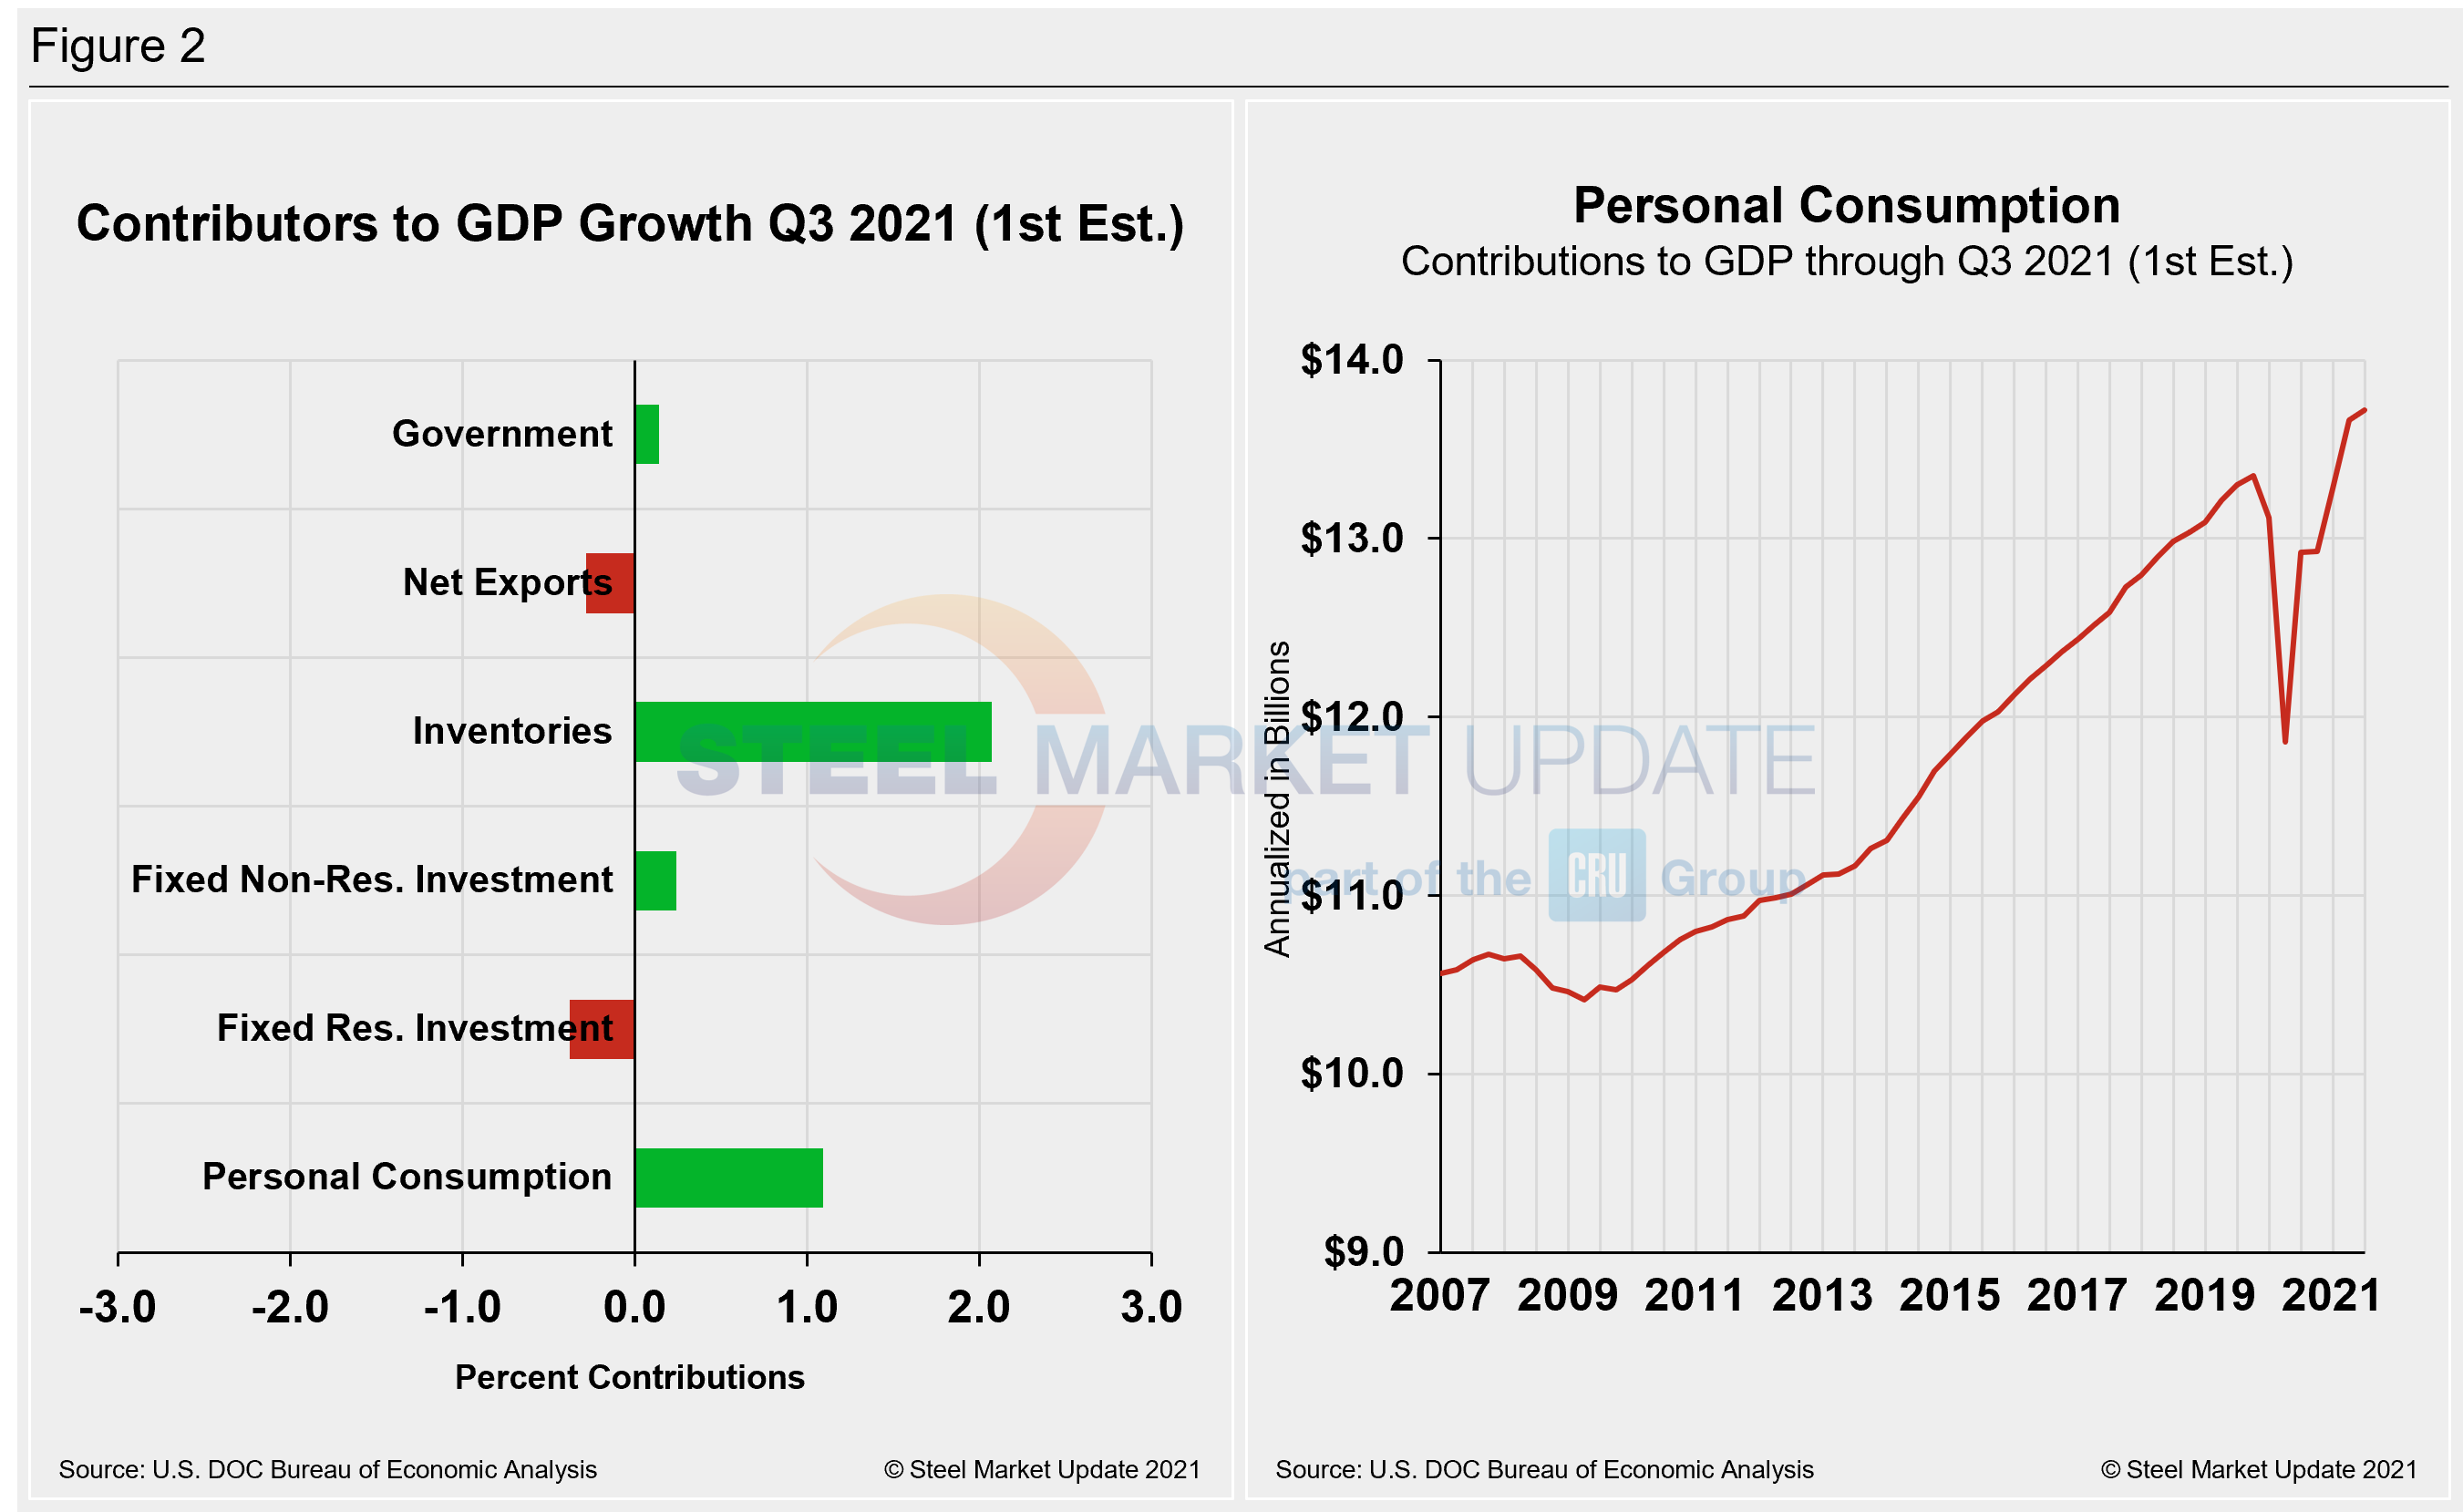
Shown below in Figure 2 is a side-by-side comparison of two charts. On the left is the mix of the six major components in the GDP growth calculation, while the chart on the right puts a spotlight on personal consumption, a measure of consumer confidence and spending engagement. The most notable change and major source of GDP fluctuation is personal consumption, which saw a negative 24.01% contribution a year ago after the onset of COVID, followed by a positive 25.44% contribution in Q3 last year as the economy reopened. Personal consumption jumped from 1.58% in Q4 to 7.42% in Q1, edging up to 7.92% in the second quarter. The slump to 1.09% in Q3’s advanced estimate offers yet another snapshot of an economy plagued by the ongoing pandemic. The extreme shifts the U.S. economy has faced over the past 12-16 months can be seen in the big swings in personal consumption.
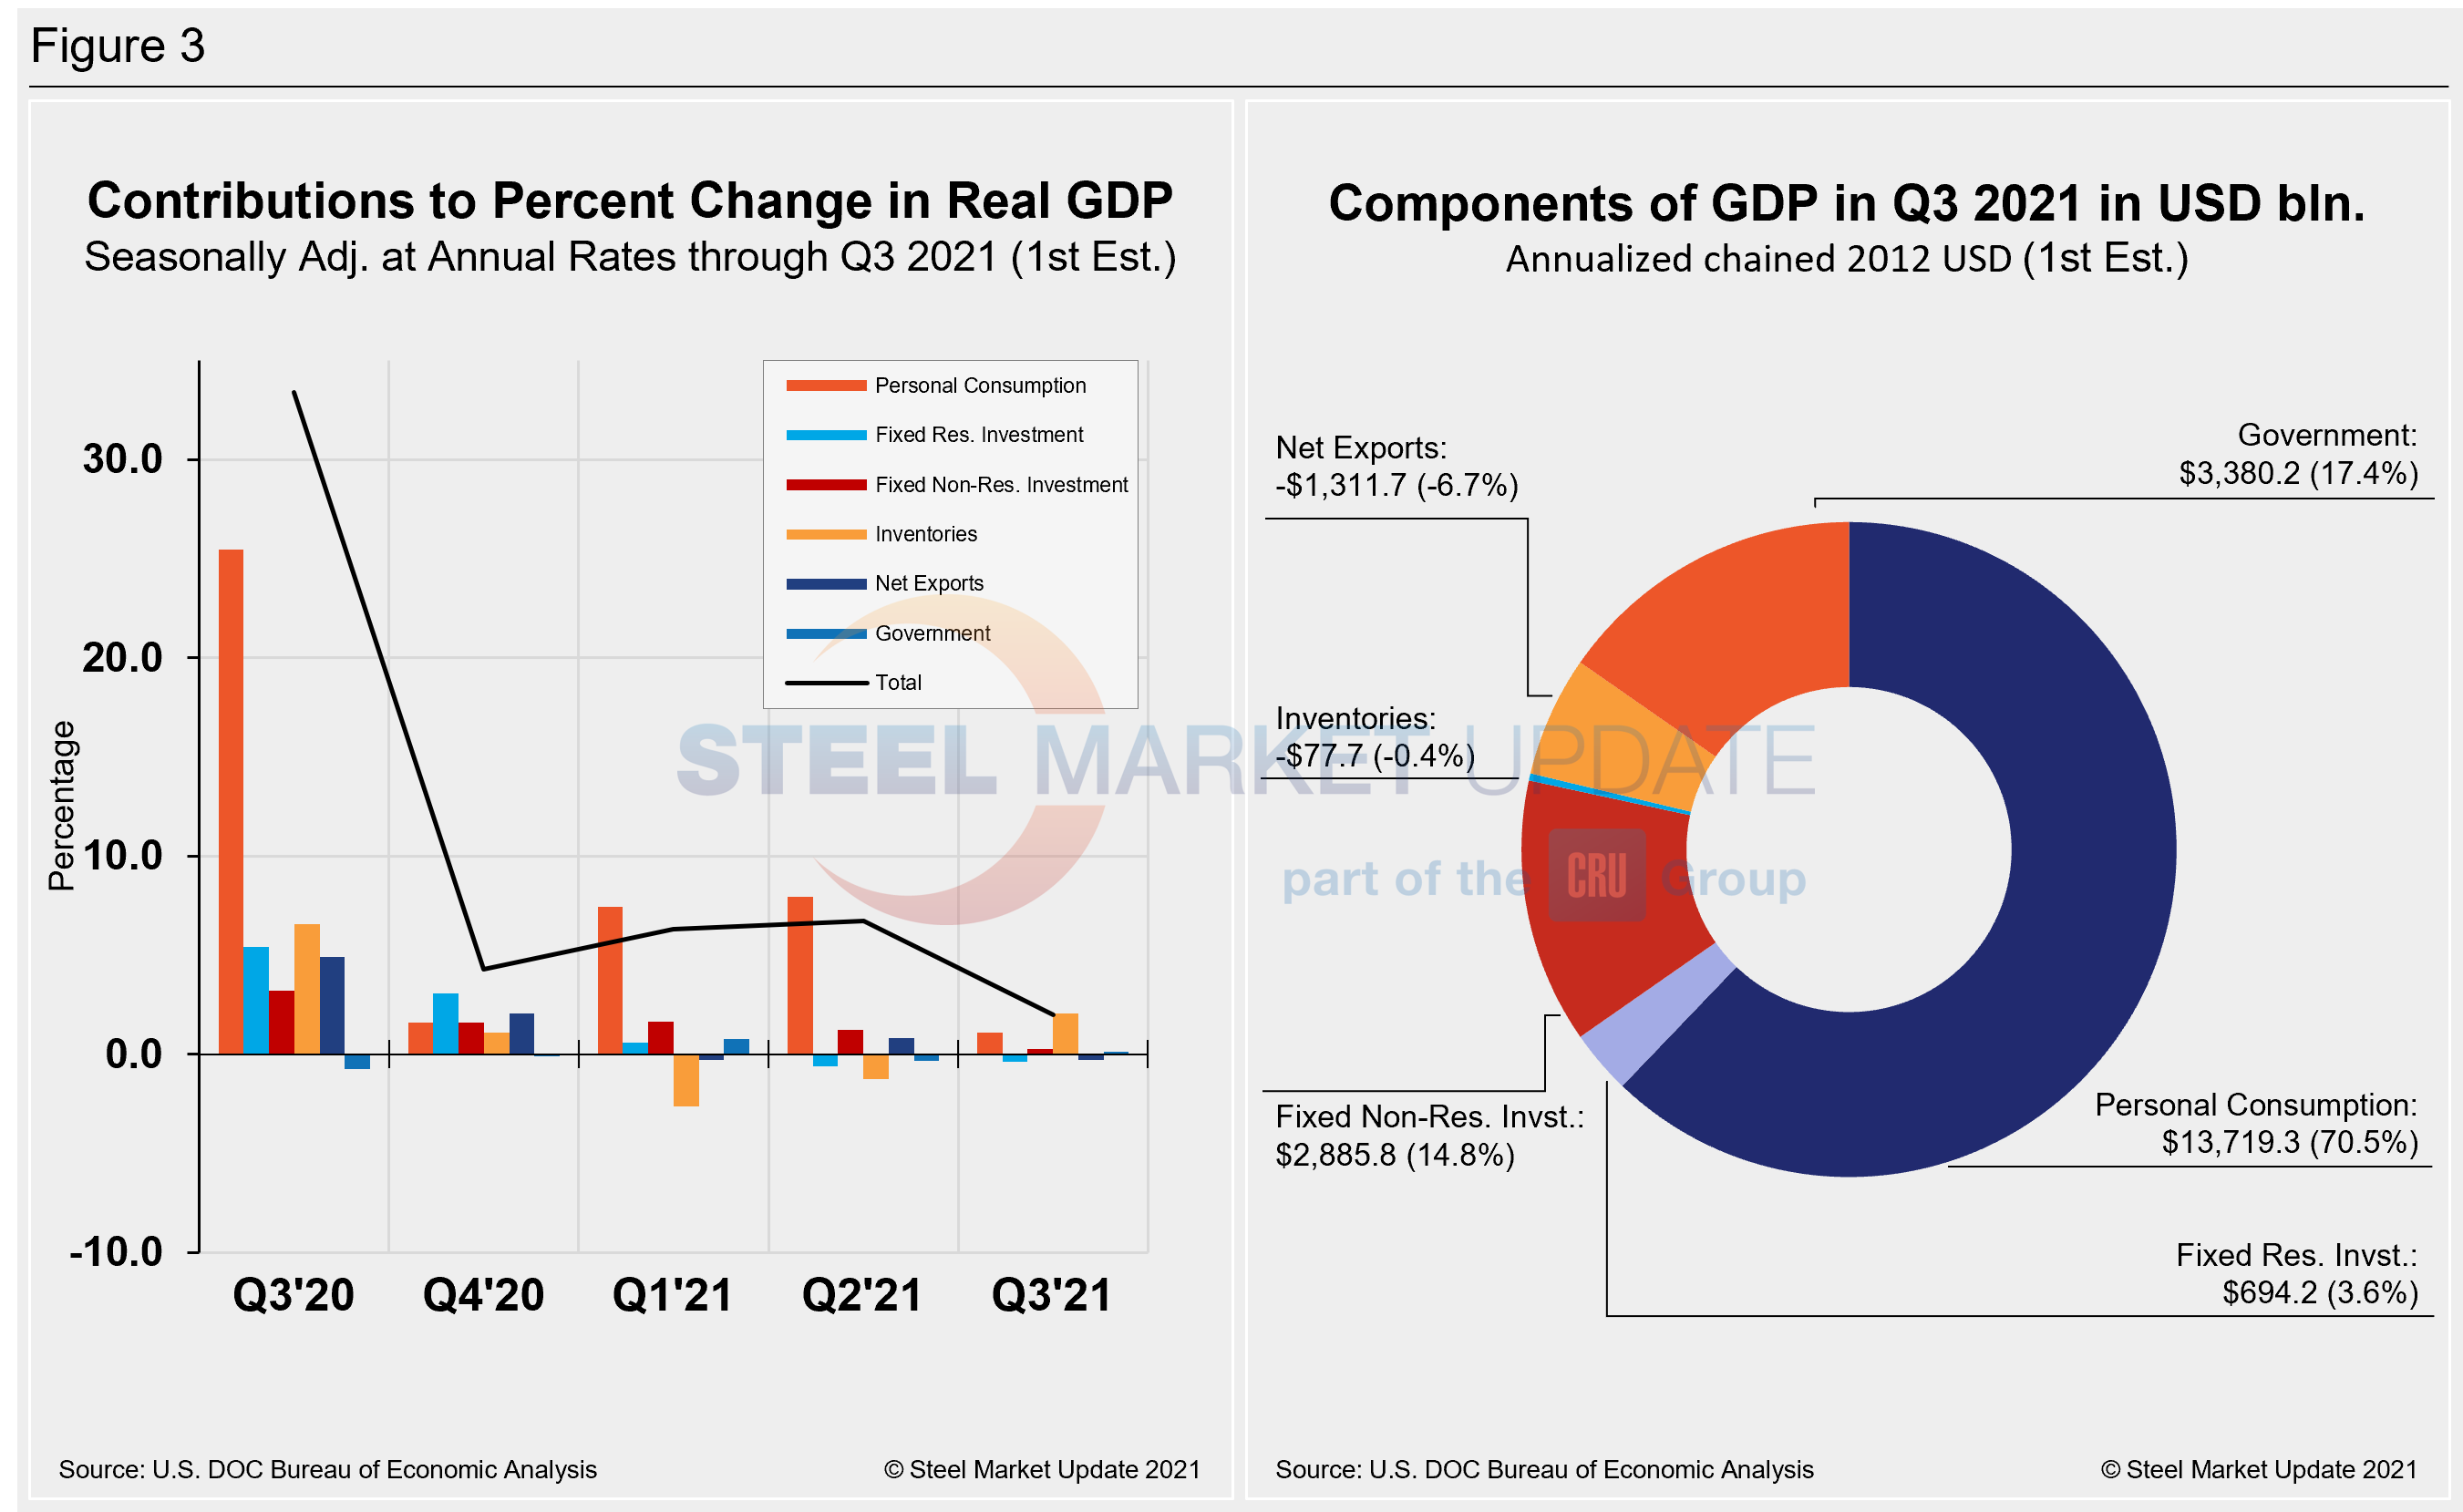
Quarterly contributions of the six major subcomponents of GDP since Q2 2020 and the breakdown of the $23.17 trillion economy in BEA’s advanced estimate of Q1 GDP are both shown in Figure 3. The chart on the left is detailed out for cross-comparison with Figure 1 above. The chart on the right shows the size of the other components relative to personal consumption.
SMU Comment: U.S. economic growth lagged in the third quarter, a significant blow to positive momentum in the first two quarters of the year. Despite the early letdown in Q3, hopeful signs abound for the rest of 2021. Economists suggest there are many reasons for optimism in the fourth quarter and beyond. Consumer confidence is rebounding, and consumer spending is expected to improve around the holiday season. And jobless claims have been ticking down for about a month, dropping to a new pandemic low last week, according to a separate report from the Department of Labor. The wildcard remains the COVID pandemic. Should infection rates continue to dip and stay low, economic growth should accelerate to cap off an extraordinary 2021.
By David Schollaert, David@SteelMarketUpdate.com


