

Market Data

December 1, 2021
BEA: Economic Growth Slows in Q3 to Just 2.1%
Written by David Schollaert
U.S. gross domestic product (GDP) grew at a modest 2.1% annual rate in the third quarter, the slowest pace in more than a year, according to the Bureau of Economic Analysis (BEA). U.S. third-quarter economic growth was slowed by the Delta variant’s disruptions to consumer spending and global supply chains.
The second review by the BEA was slightly better than its first estimate, but the revision was still well below the solid GDP gains of 6.3% in the first quarter and 6.7% in the second. The small increase from the initial GDP estimate reflected a slightly better performance for consumer spending, which grew at a still lackluster 1.7% rate in Q3, compared to a 12% surge in the April-June quarter. The contribution to GDP from business inventory restocking was also revised up.
The economy’s weak summer performance could lead to a strong rebound as pentup demand boosts consumer spending leading up to the Christmas holiday. Some forecasts predict fourth-quarter growth that could be the strongest of the year, barring any major disruptions from the new omicron variant of COVID.
For the year, economists believe the economy could grow by roughly 5.5%, which would be its best showing since 1984 when it rebounded from a double-dip recession, and a big turnaround from the 3.4% decline last year due to the pandemic.
The BEA’s second review of the country’s real GDP in the third quarter reflected increases in private inventory investment, personal consumption expenditures, state and local government spending, and nonresidential fixed investment. Those were partly offset by decreases in residential fixed investment, federal government spending and exports. Imports, which are a subtraction in the calculation of GDP, increased.
Personal consumption, the largest component of U.S. GDP comprising about two-thirds of overall economic activity, was revised up to 1.18% in the government’s second look at the third quarter, but was still the weakest pace since the first quarter of 2019.
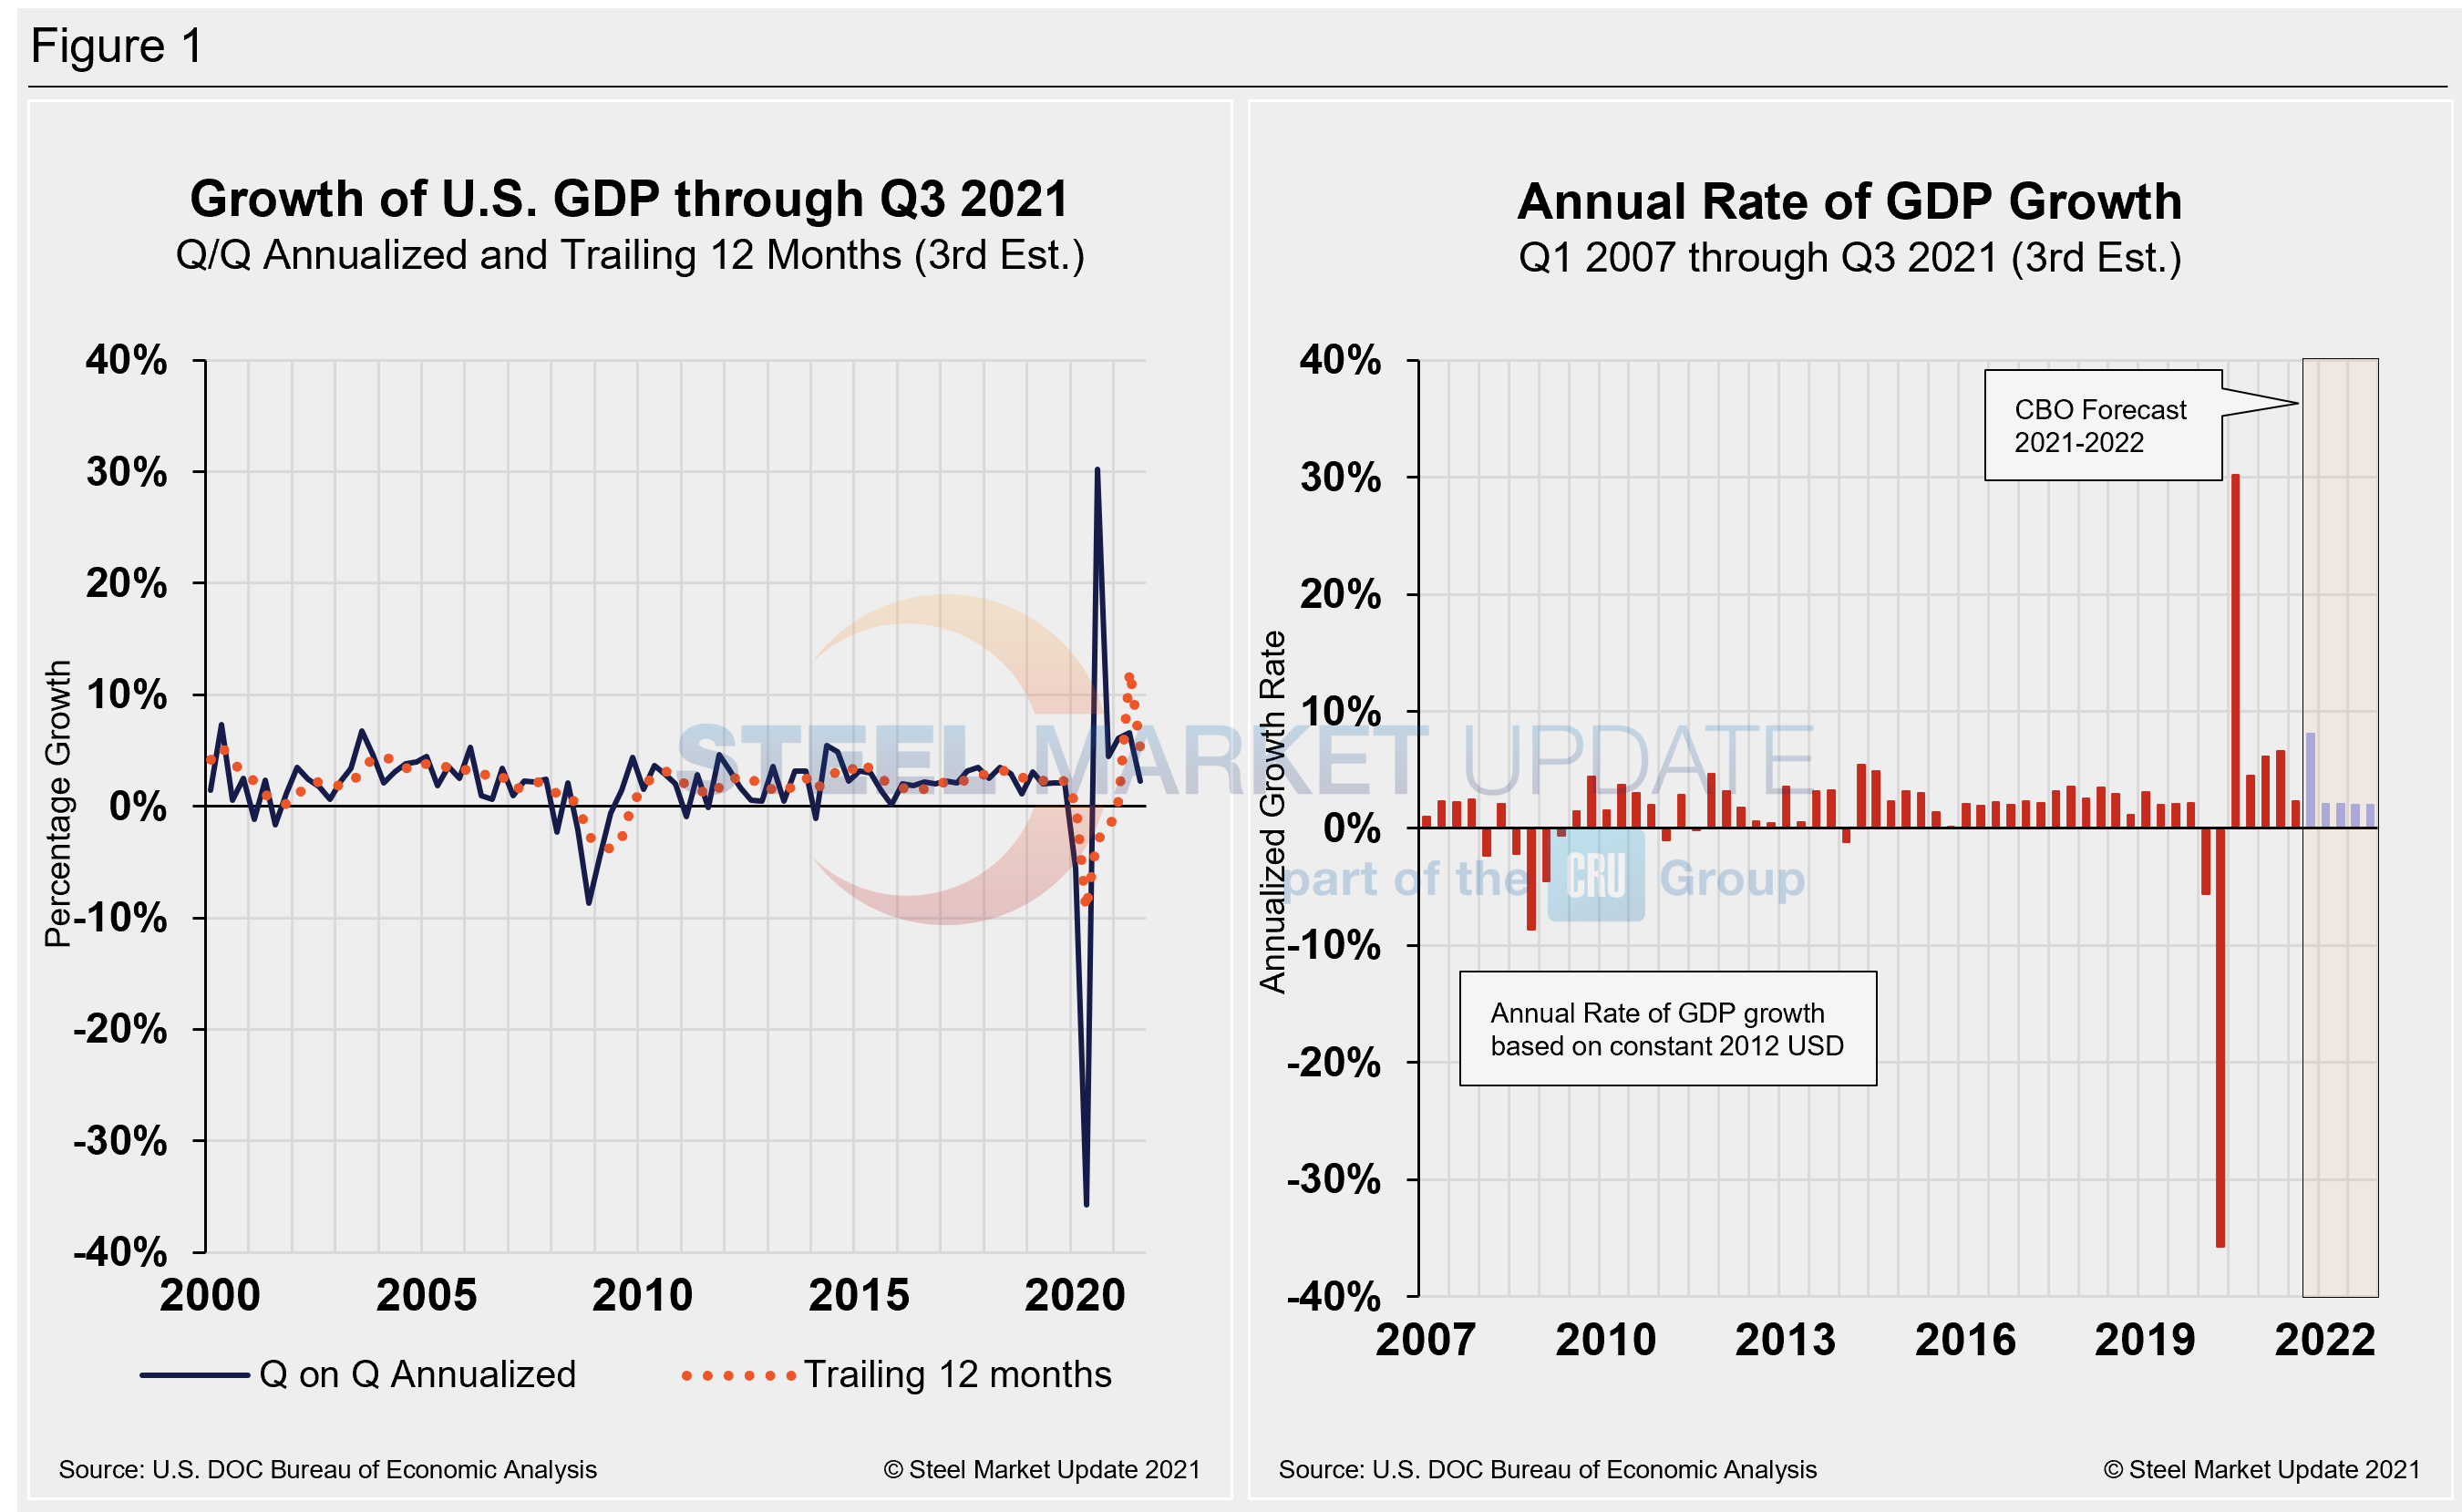
The Department of Commerce’s second look at U.S. GDP in Q3 totaled $23.19 trillion, an 8.1% or $446.0 billion increase from the previous quarter, measured in chained 2012 dollars on an annualized basis. Below in Figure 1 is a side-by-side comparison of the growth of U.S. GDP and the annual rate of GDP, both through Q3 2021. In the first chart, you’ll see the contrast between the trailing 12-month growth and the headline quarterly result. The chart on the right details the headline quarterly results since Q1 2007 including the Congressional Budget Office’s GDP projection through 2022. On a trailing 12-month basis, GDP decelerated to 4.90% in the third quarter, a steep fall from 12.23% in Q2, but still a vast improvement from -9.27% in Q2 2020 at the height of the pandemic. For comparison, the average in 47 quarters since Q1 2010 has been a growth rate of 2.06%.
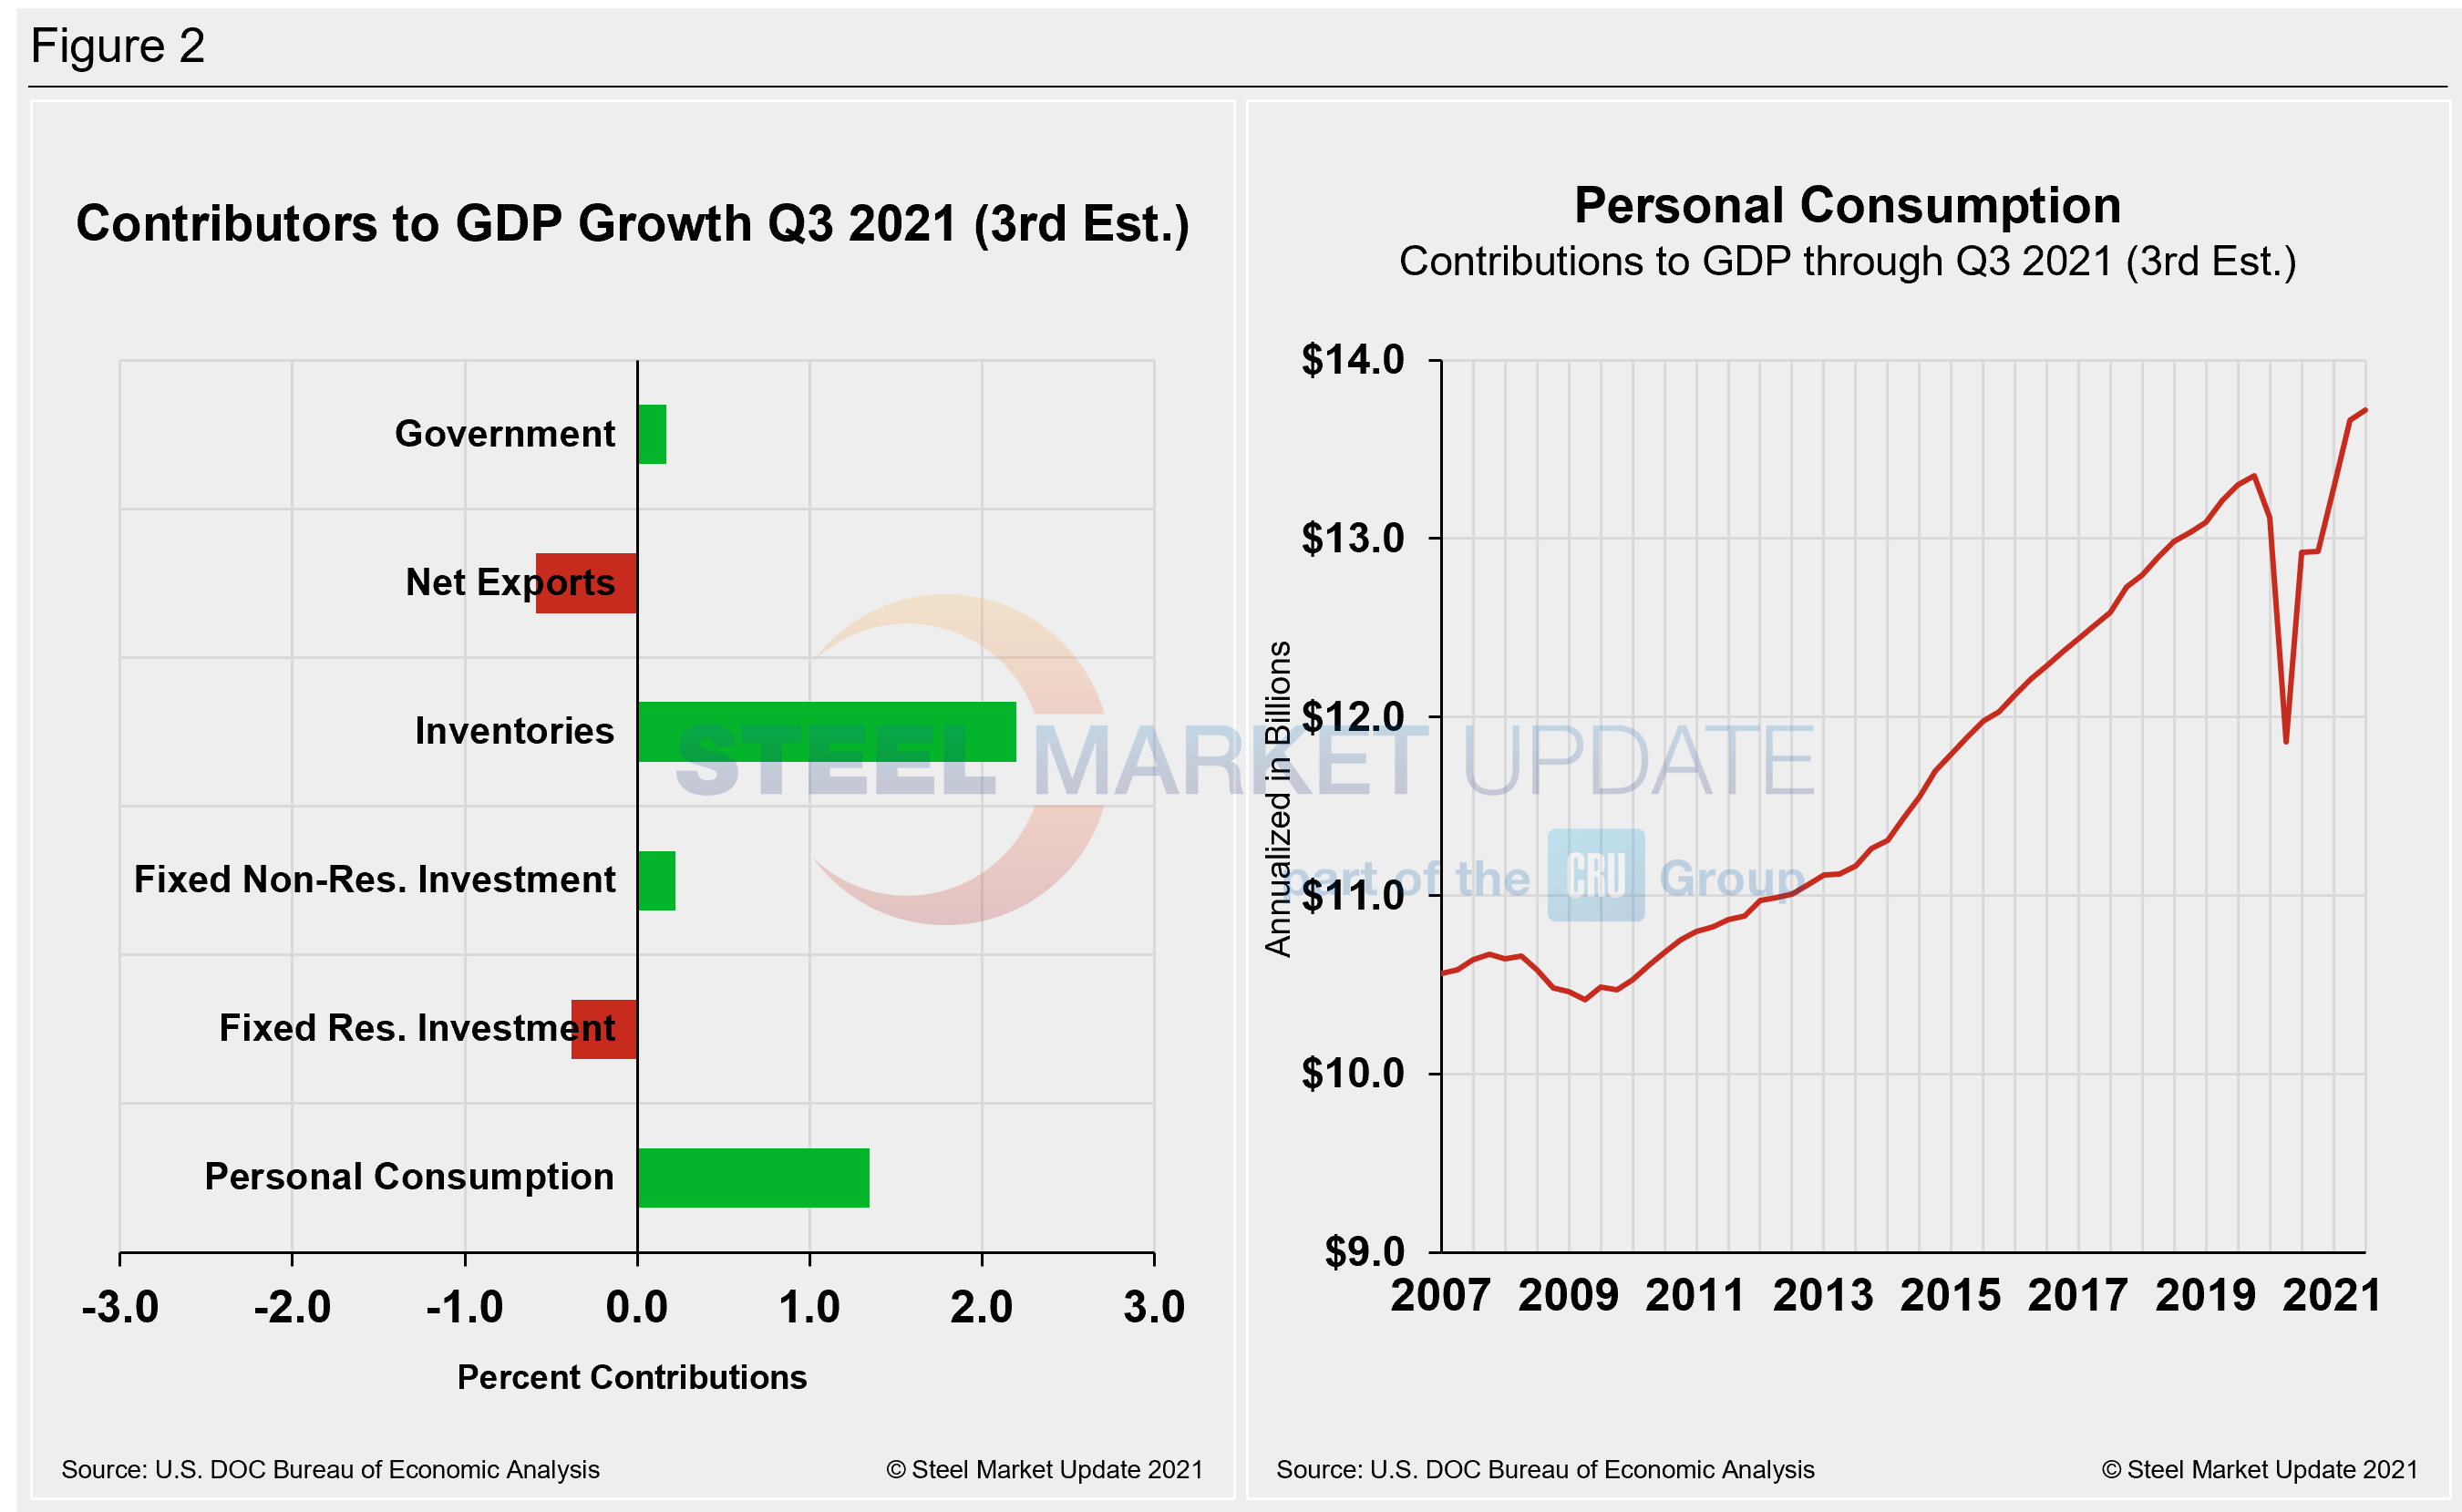
Shown below in Figure 2 is a side-by-side comparison of two charts. On the left is the mix of the six major components in the GDP growth calculation, while the chart on the right puts a spotlight on personal consumption, a measure of consumer confidence and spending engagement. The most notable change and major source of GDP fluctuation is personal consumption, which saw a negative 24.01% contribution a year ago after the onset of COVID, followed by a positive 25.44% contribution in Q3 last year as the economy reopened. Personal consumption jumped from 1.58% in Q4 to 7.42% in Q1, edging up to 7.92% in the second quarter. The slump to 1.18% in Q3’s second estimate offers yet another snapshot of an economy still dealing with the effects of the pandemic. The extreme shifts the U.S. economy has faced over the past 12-18 months can be seen in the big swings in personal consumption.
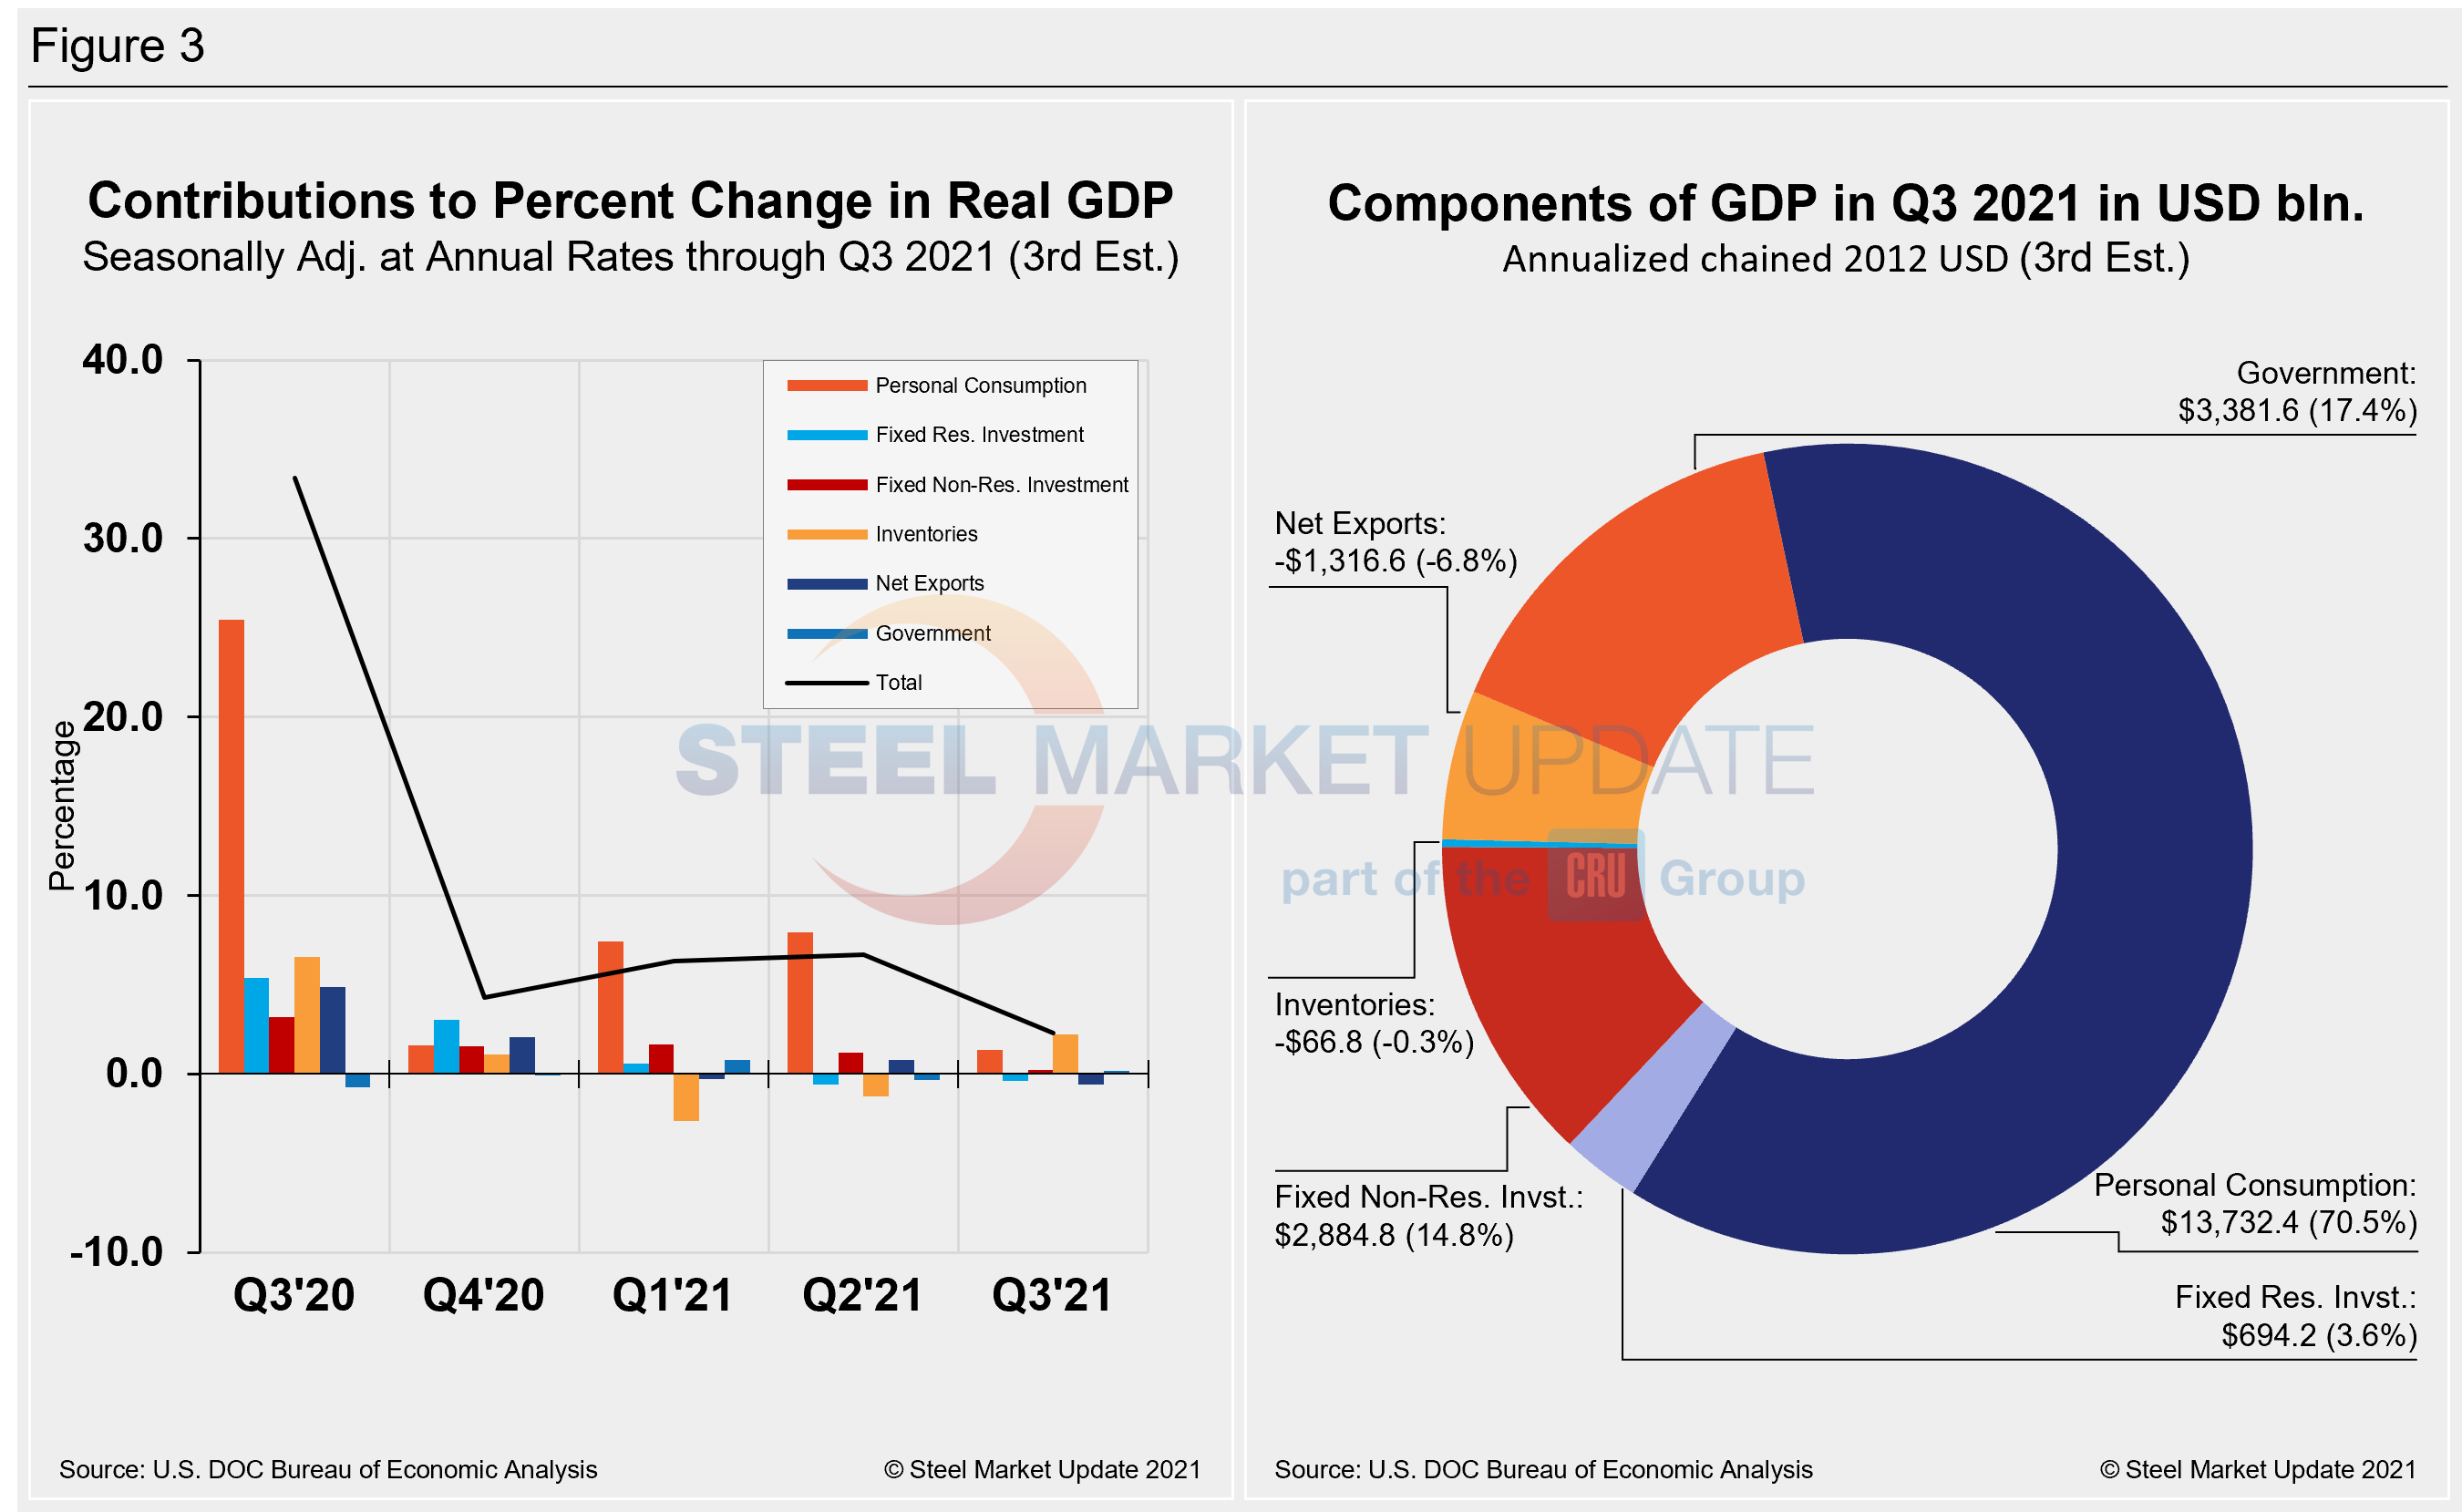
Quarterly contributions of the six major subcomponents of GDP since Q2 2020 and the breakdown of the $23.19 trillion economy in BEA’s second estimate of Q1 GDP are both shown in Figure 3. The chart on the left is detailed out for cross-comparison with Figure 1 above. The chart on the right shows the size of the other components relative to personal consumption.
SMU Comment: U.S. economic growth slowed in the third quarter, nearly stalling the positive momentum seen in the first two quarters of the year. Despite the letdown seen in Q3, optimism abounds for the fourth quarter, potentially leading to historic GDP growth for the full year. The market is keeping a wary eye on the threat from the latest COVID variant.
By David Schollaert, David@SteelMarketUpdate.com


