

Market Data

April 29, 2022
US GDP Down a Dreary 1.4% in Q1
Written by David Schollaert
The US economy shrank in the first quarter of 2022 with gross domestic production declining at a 1.4% annualized pace. The drop was a sharp reversal from an annual growth rate of 6.9% from October through December, according to the US Commerce Department’s Bureau of Economic Analysis (BEA).
The initial estimate for Q1 was the worst since the pandemic-induced recession in 2020. It was an unexpected decline and marked an abrupt reversal for an economy coming off its best performance since 1984.
Multiple factors weighed against growth during the first three months of the year.
Supply disruptions weighed on the economy, but consumers and businesses continue to spend. Consumer spending, the economy’s main driver, rose at a 2.7% annual rate in the first quarter, a slight acceleration from the end of last year. The growth came amid a 7.8% increase in prices.
Businesses also poured more money into equipment and research and development, triggering a 9.2% rise in business spending. Declines in fixed investment, defense spending, and the record trade imbalance weighed on growth. Imports to the US surged and exports fell, widening the trade deficit and reflecting pandemic-related supply-chain constraints.
A deceleration in private inventory investment weighed on growth after helping propel GDP in the back half of 2021. Other restraints came from government spending across state, federal, and local governments.
Recession expectations on Wall Street remain low. But there are concerns about what increasesd interest rates might mean for the broader economy. Recall that the Federal Reserve is expected to enact a series of rate hikes aimed at combatting escalating prices.
The personal consumption expenditures price index excluding food and energy – a preferred inflation measure for the Fed – rose 5.2% in Q1, well above the central bank’s 2% inflation target.
Current market pricing indicates the equivalent of 10 quarter-percentage-point interest rate moves. That would take the Fed’s benchmark interest rate to about 2.75% by the end of the year. It would come after two years of near-zero rates aimed at allowing recovery from the steepest recession in US history.
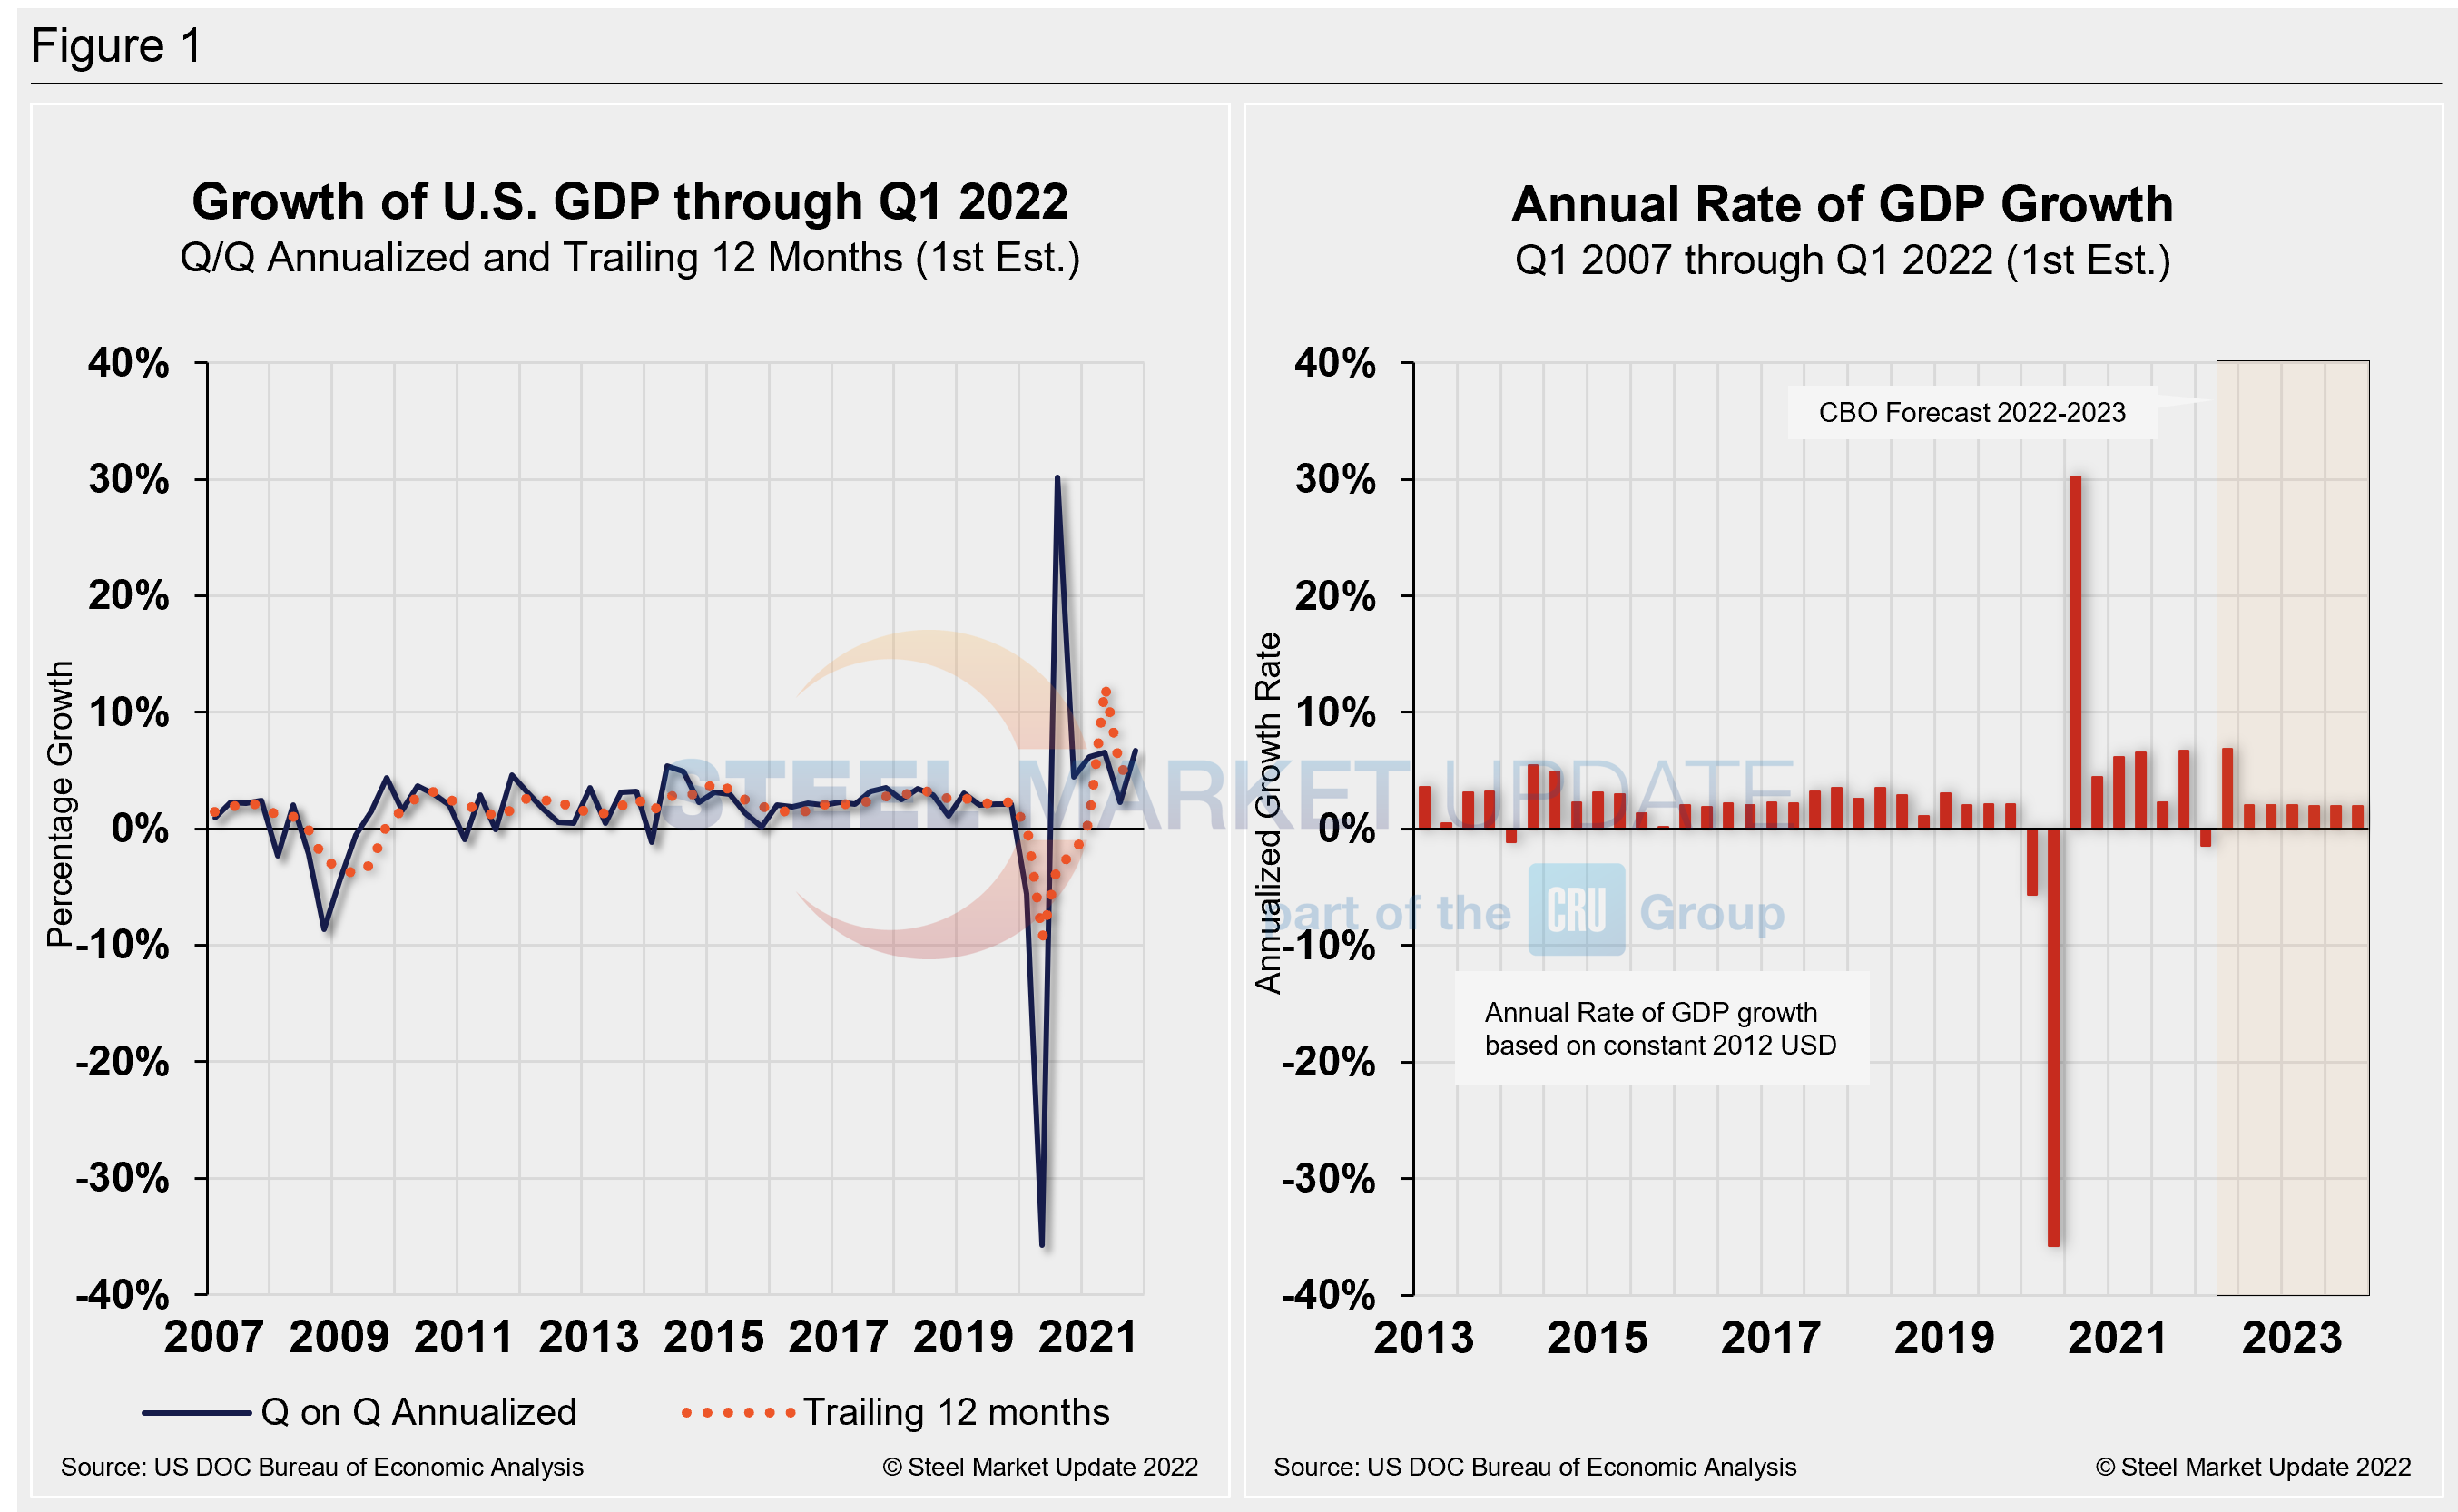
Commerce’s first look put total US GDP in Q4 at $24.38 trillion, a 6.5% increase, or $379.9 billion, over the previous quarter. Below in Figure 1 is a side-by-side comparison of US GDP growth and the annual rate of GDP, both through Q1 2022. In the first chart, you’ll see the contrast between the trailing 12-month growth and the headline quarterly result. The chart on the right details the headline quarterly results since Q1 2007, including the Congressional Budget Office’s GDP projection through 2022.
On a trailing 12-month basis, GDP accelerated to 3.57% in the first quarter, down from 5.53% in the prior quarter but still well behind 12.23% growth in Q2. Yet, it’s a vast improvement from -9.27% in Q2 2020 at the height of the pandemic. For comparison, the average in 49 quarters since Q1 2010 has been a growth rate of 2.17%.
Two years after the pandemic first struck, the US economy faces many challenges, including supply disruptions related to the pandemic and the war in Ukraine, labor shortages, and high inflation.
Current forecasts estimate GDP rising 2.6% in the fourth quarter of 2022 from a year earlier, matching 2019 annual growth, but logging in well below the 5.5% growth recorded last year, according to a report from The Wall Street Journal.
The labor market is presently a key source of economic strength. Jobless claims – a proxy for layoffs – have been near historic lows and fell last week to 180,000 as employers clung to employees amid a shortage of available workers.
Though businesses are hiring and ramping up wages and supporting consumer spending, high inflation is cutting into households’ purchasing power. Consumer prices rose 8.5% in March from a year earlier, a four-decade high.
Elevated inflation is wiping away pay gains for many workers: average hourly earnings were up 5.6% over the same period. Fast-rising prices are not just impacting households, they are also challenging many businesses.
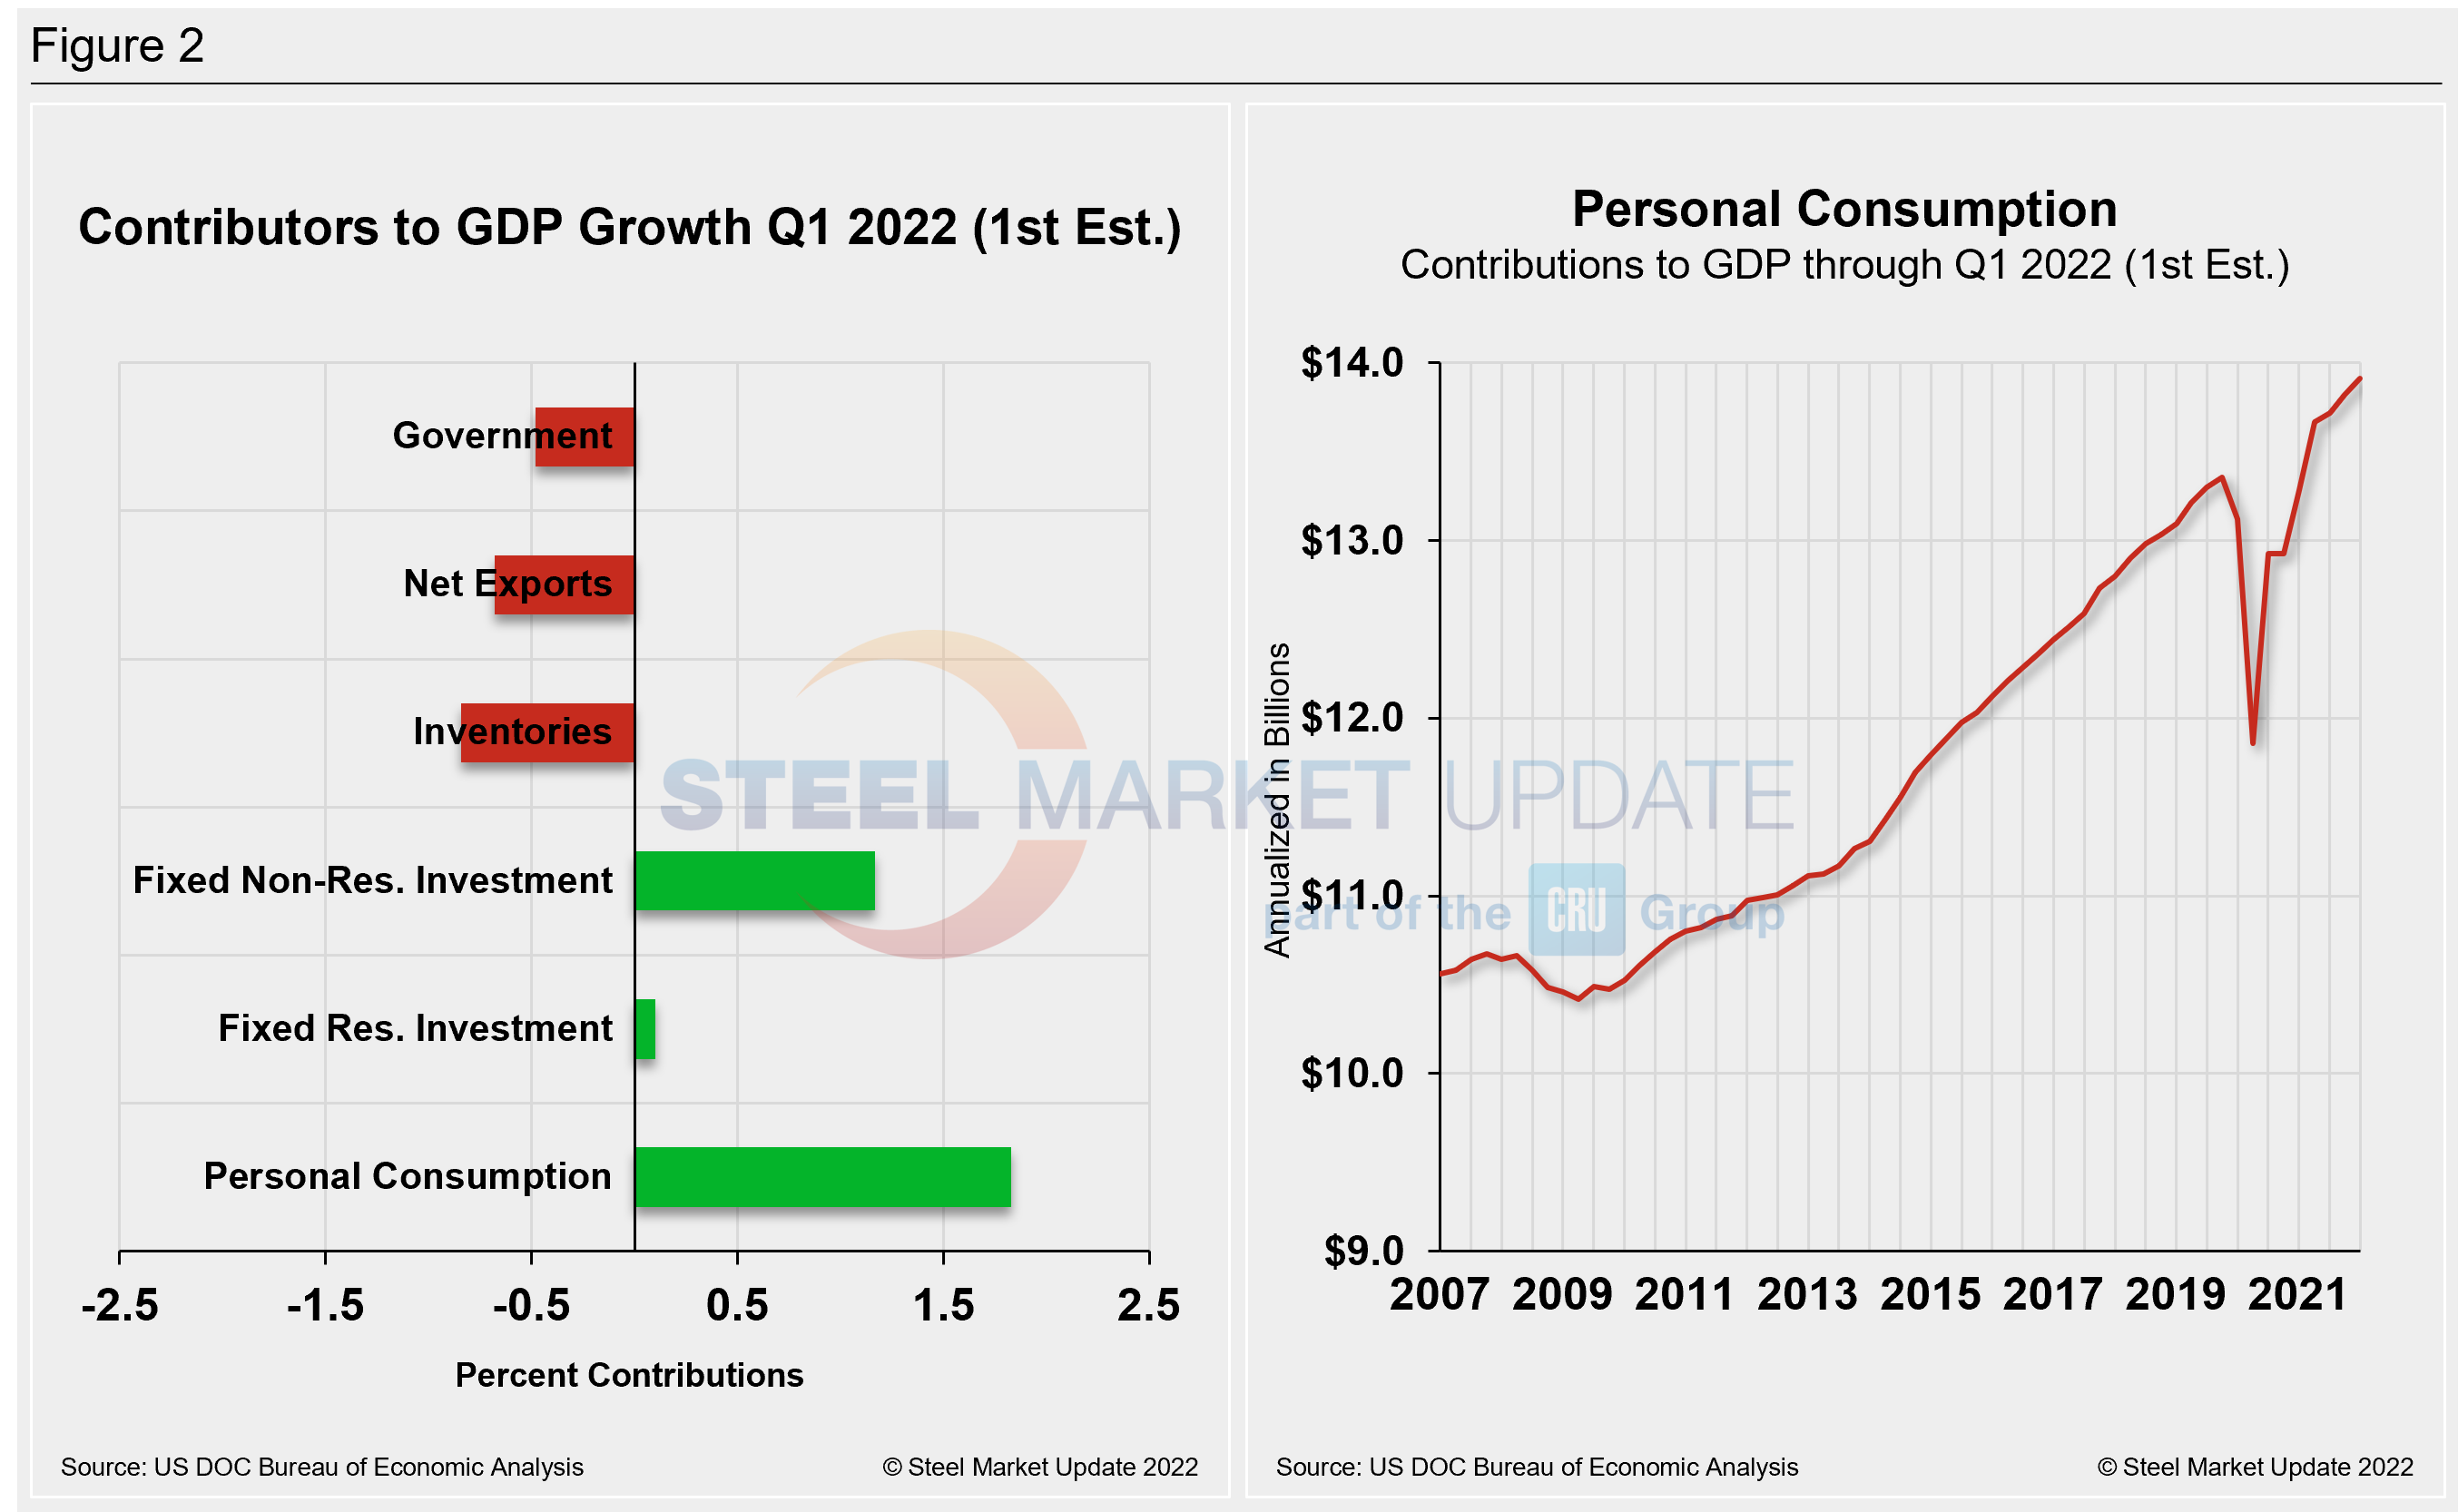
Shown below in Figure 2 is a side-by-side comparison of two charts. On the left is the mix of the six major components in the GDP growth calculation. The chart on the right puts a spotlight on personal consumption, a measure of consumer confidence and spending engagement.
The most notable change and a major source of GDP fluctuation is personal consumption, which has experienced extreme swings since the onset of Covid. It has been resilient more recently, and a bright spot despite inflation headwinds.
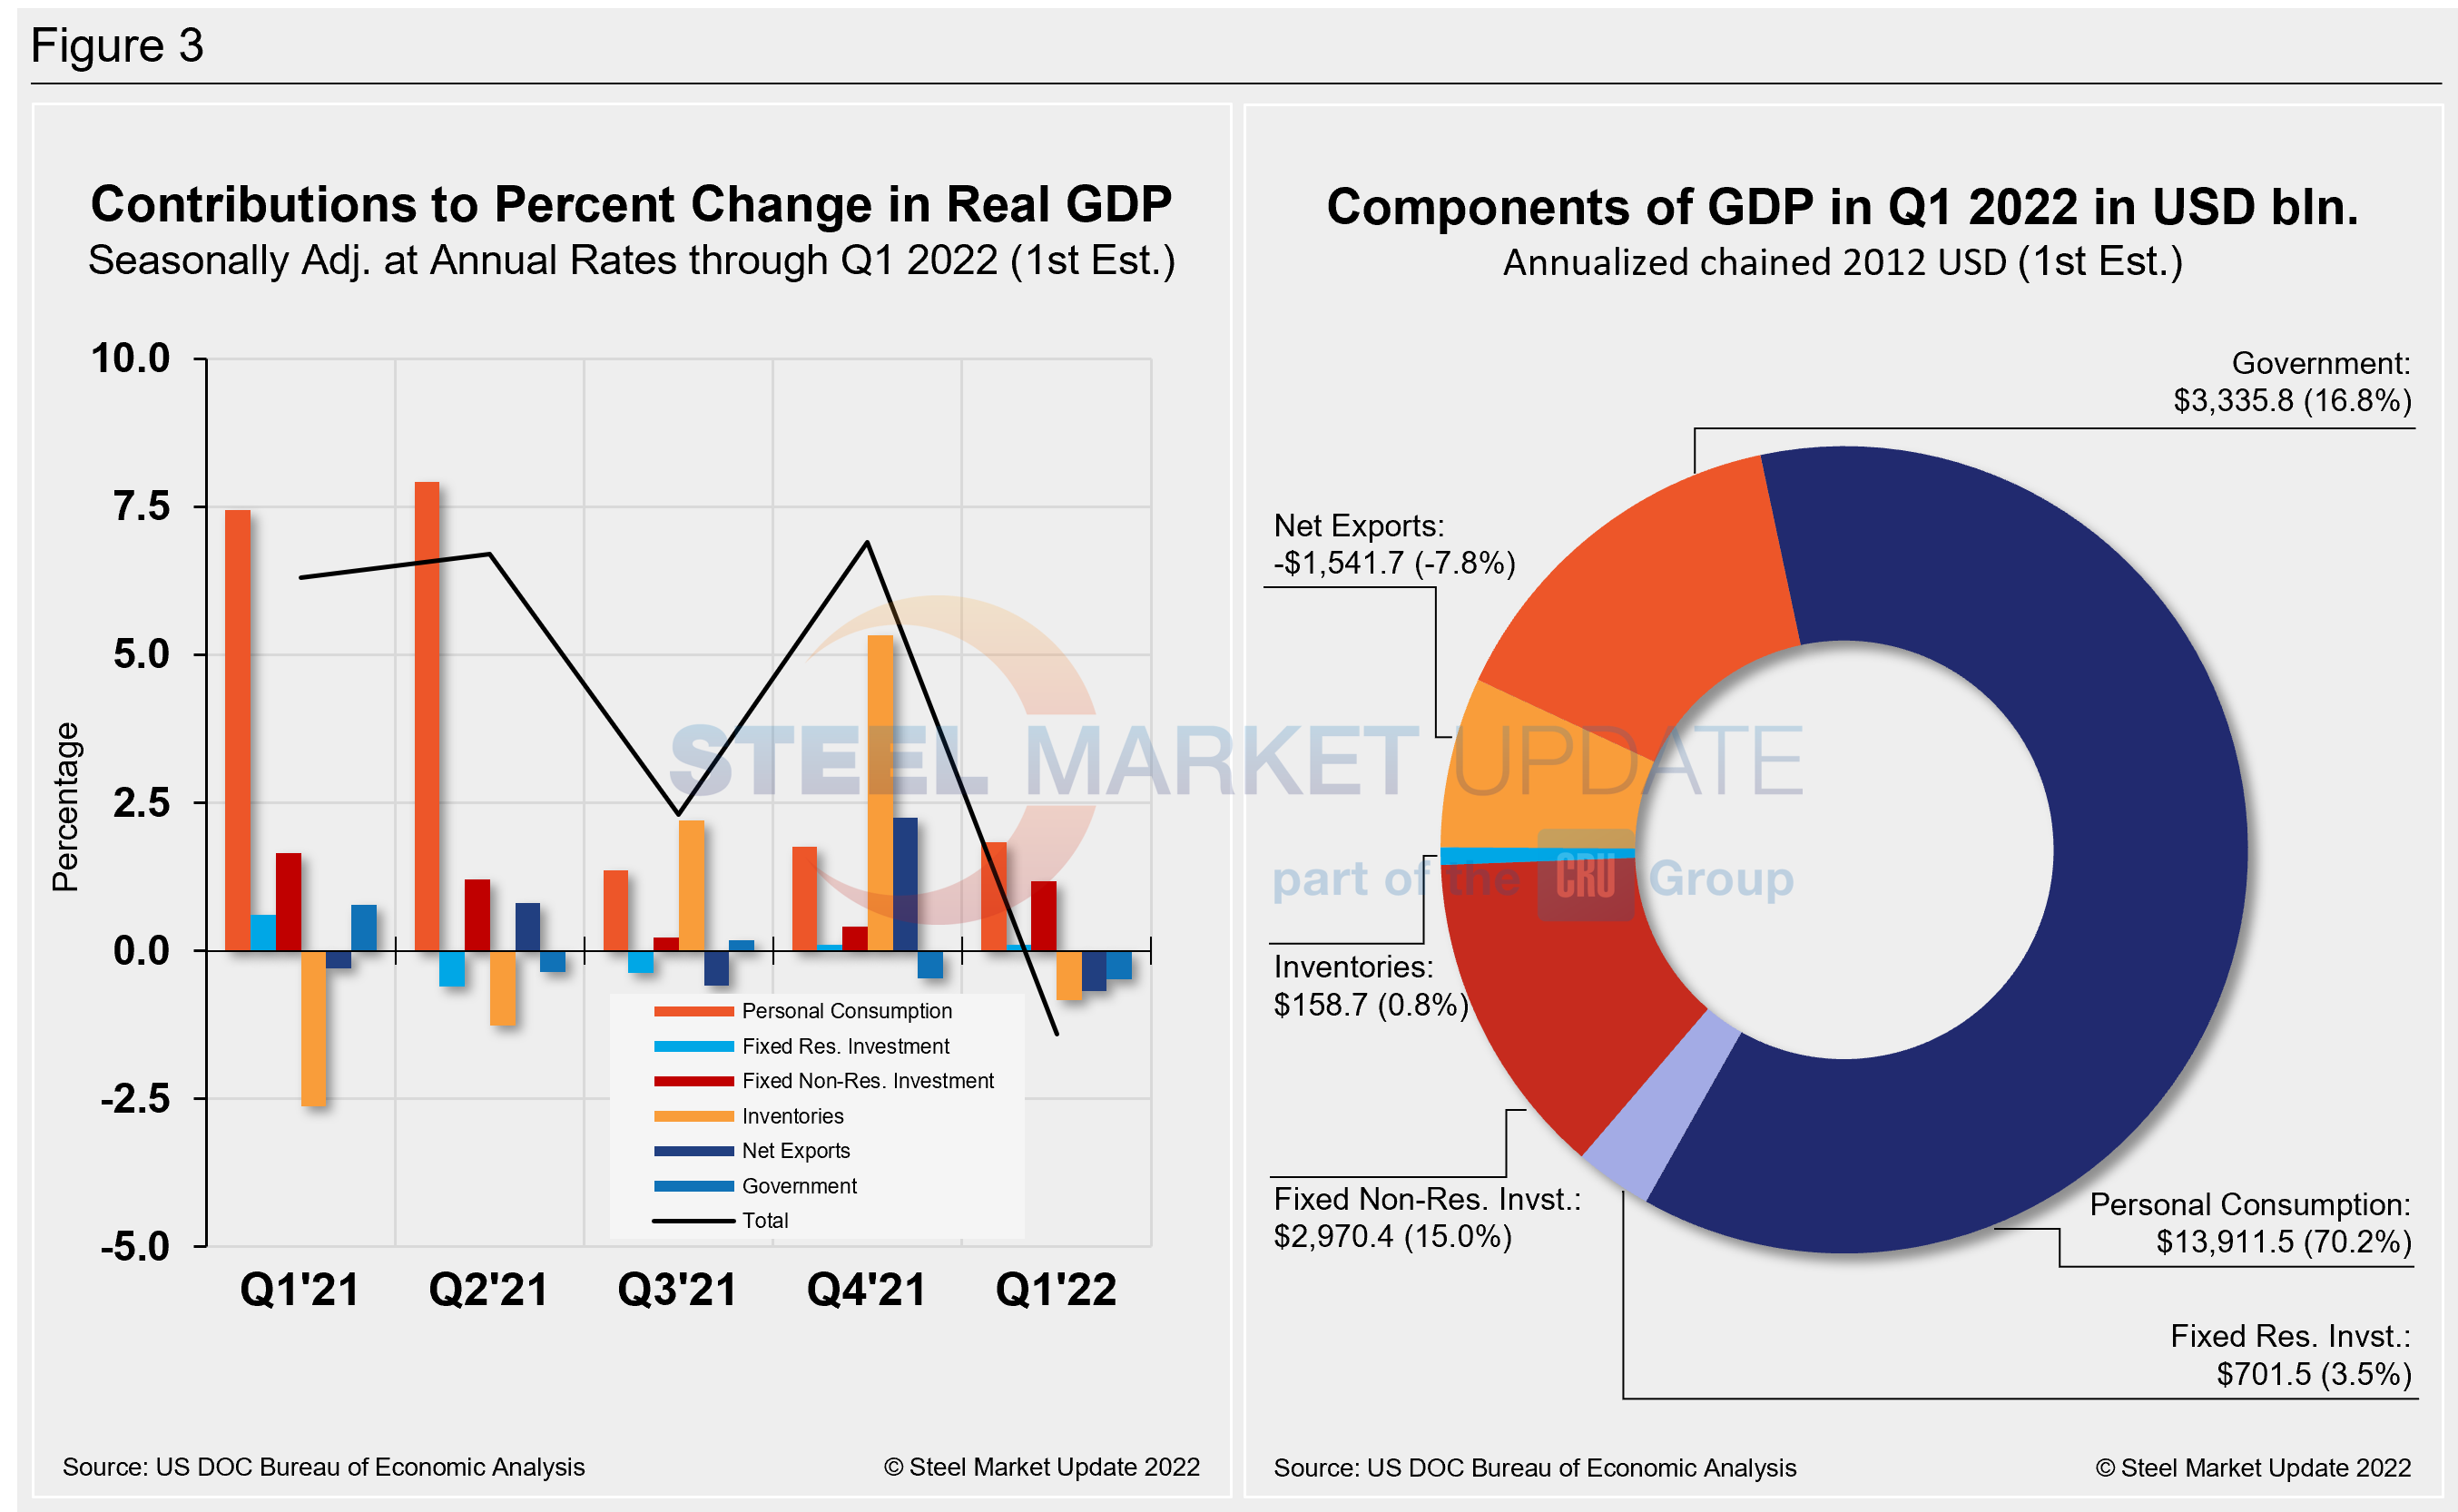
The quarterly contributions of the six major subcomponents of GDP since Q4 2020 and the breakdown of the $24.38 trillion economy in BEA’s first review of Q1 GDP are both shown in Figure 3. The chart on the left is for cross-comparison with Figure 1 above. The chart on the right shows the size of the other components relative to personal consumption.
By David Schollaert, David@SteelMarketUpdate.com


