

Market Data

September 1, 2022
US GDP Improved Moderately, Contracting -0.6% in Q2
Written by David Schollaert
The US economy shrank at a revised -0.6% in the second quarter of 2022, declining for the second straight quarter.
Gross domestic production in Q2 contracted at a more moderate pace than initially though, according to the second estimate from the US Commerce Department’s Bureau of Economic Analysis (BEA). The result was a slight improvement from the -0.9% annualized pace in its advanced estimate a month earlier. It stemmed from better data on consumer spending.
Despite the improvement, the negative rate continued to meet the criteria for a so-called ‘technical recession’ as raging inflation and higher interest rates weighed on spending.
Two-quarters of negative GDP growth is a traditional, rule-of-thumb signal that the economy has gone into recession. But the National Bureau of Economic Research (NBER) is the official arbiter of when recessions begin and end, and it probably won’t make a judgment on the period in question for months.
The negative growth rate in Q2 follows a declining annualized rate of -1.6% from January to March. It stands in marked contrast to the robust 6.9% annual increase in GDP recorded in the final quarter of 2021 when the economy roared back from Covid shutdowns.
Multiple factors weighed on growth during Q2, including declines in private inventories, residential and nonresidential investment, and government spending at the federal, state, and local levels. Those decreases were offset by increases in net exports – the difference between what the U.S. exports and what it imports – as well as consumer spending, which accounts for two-thirds of GDP.
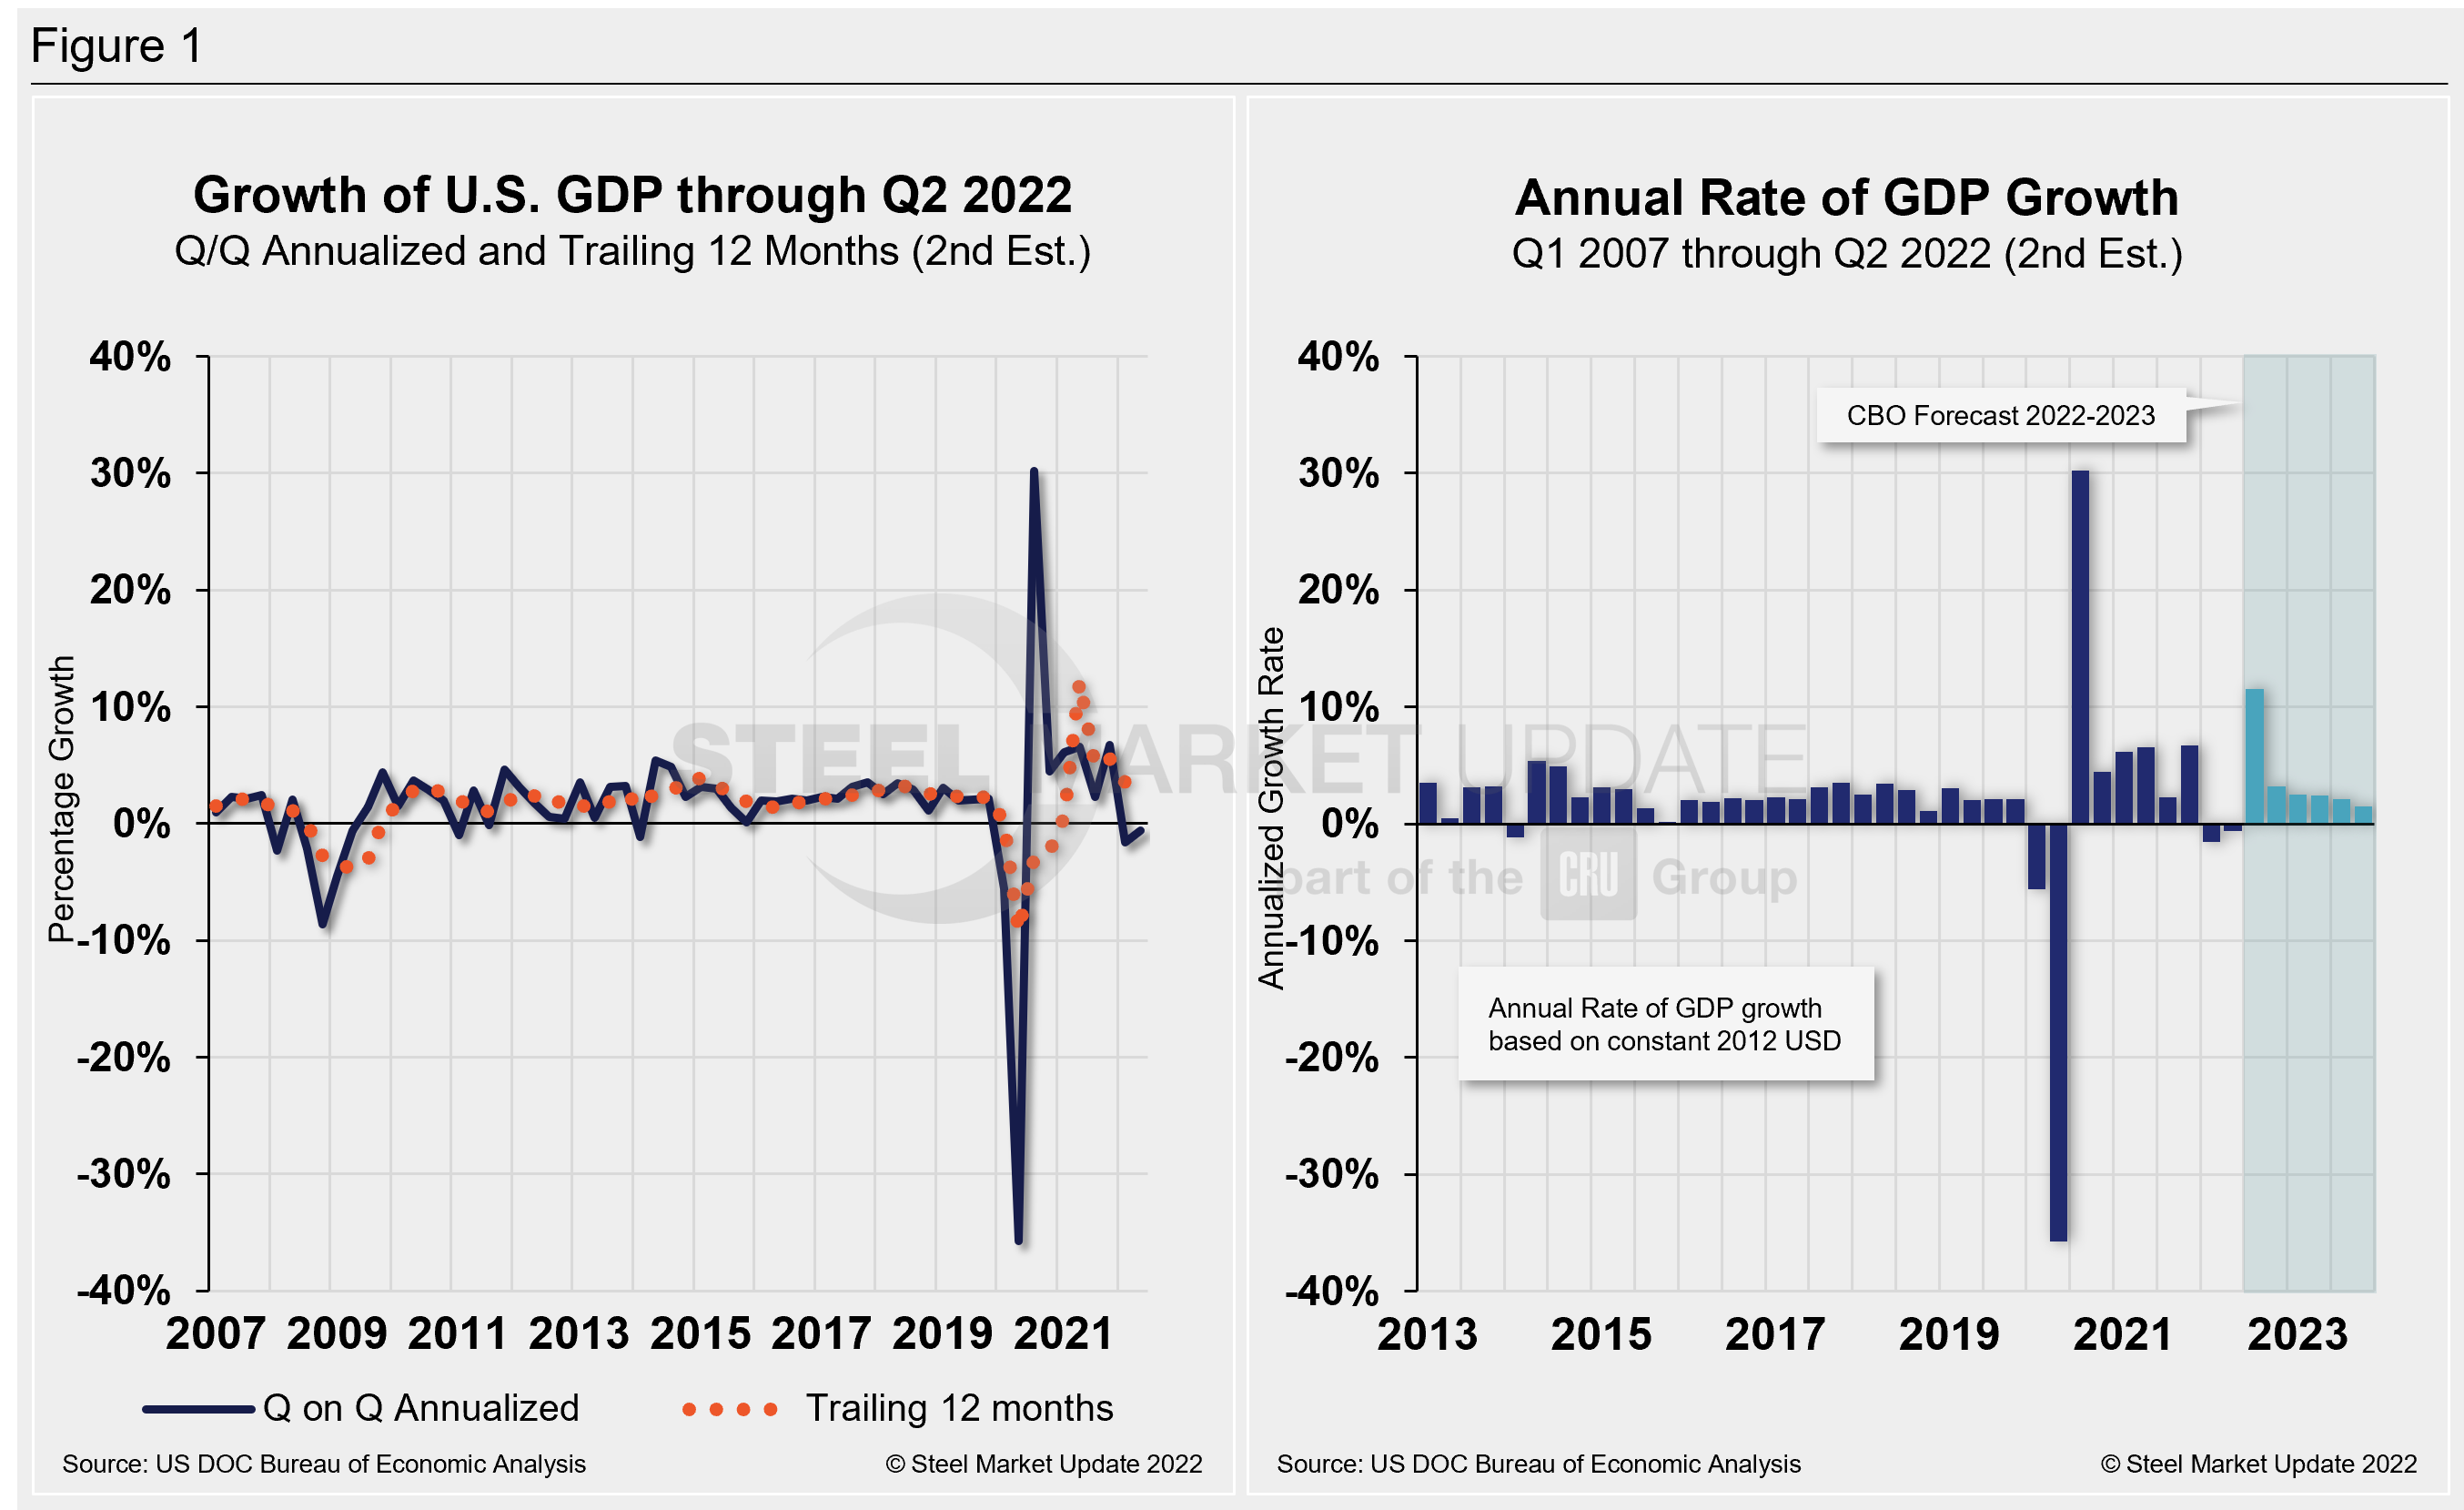
Commerce’s second look put total US GDP in Q2 at $24.88 trillion, a 8.4% increase, or $496.2 billion, over the previous quarter. Below in Figure 1 is a side-by-side comparison of US GDP growth and the annual rate of GDP, both through Q2 2022. In the first chart, you’ll see the contrast between the trailing 12-month growth and the headline quarterly result. The chart on the right details the headline quarterly results since Q1 2007, including the Congressional Budget Office’s GDP projection through 2023.
On a trailing 12-month basis, GDP accelerated by just 1.71% in the second quarter, down from 3.53% in the prior quarter but still well behind 12.23% growth in Q2. Yet, it’s a vast improvement from -9.27% in Q2 2020 at the height of the pandemic. For comparison, the average in 50 quarters since Q1 2010 has been a growth rate of 2.11%.
The latest GDP figures come as the Fed has signaled that another benchmark interest rate increase like the three-quarter of a percentage point increase seen in June and July is possible in September.
Inflation remains at the root of much of the economy’s troubles. The consumer price index rose 8.6% in the quarter, the fastest pace since Q4 of 1981. And supply chain issues, brought about initially by outsized demand for goods over services during the pandemic, are still at the core of the problem.
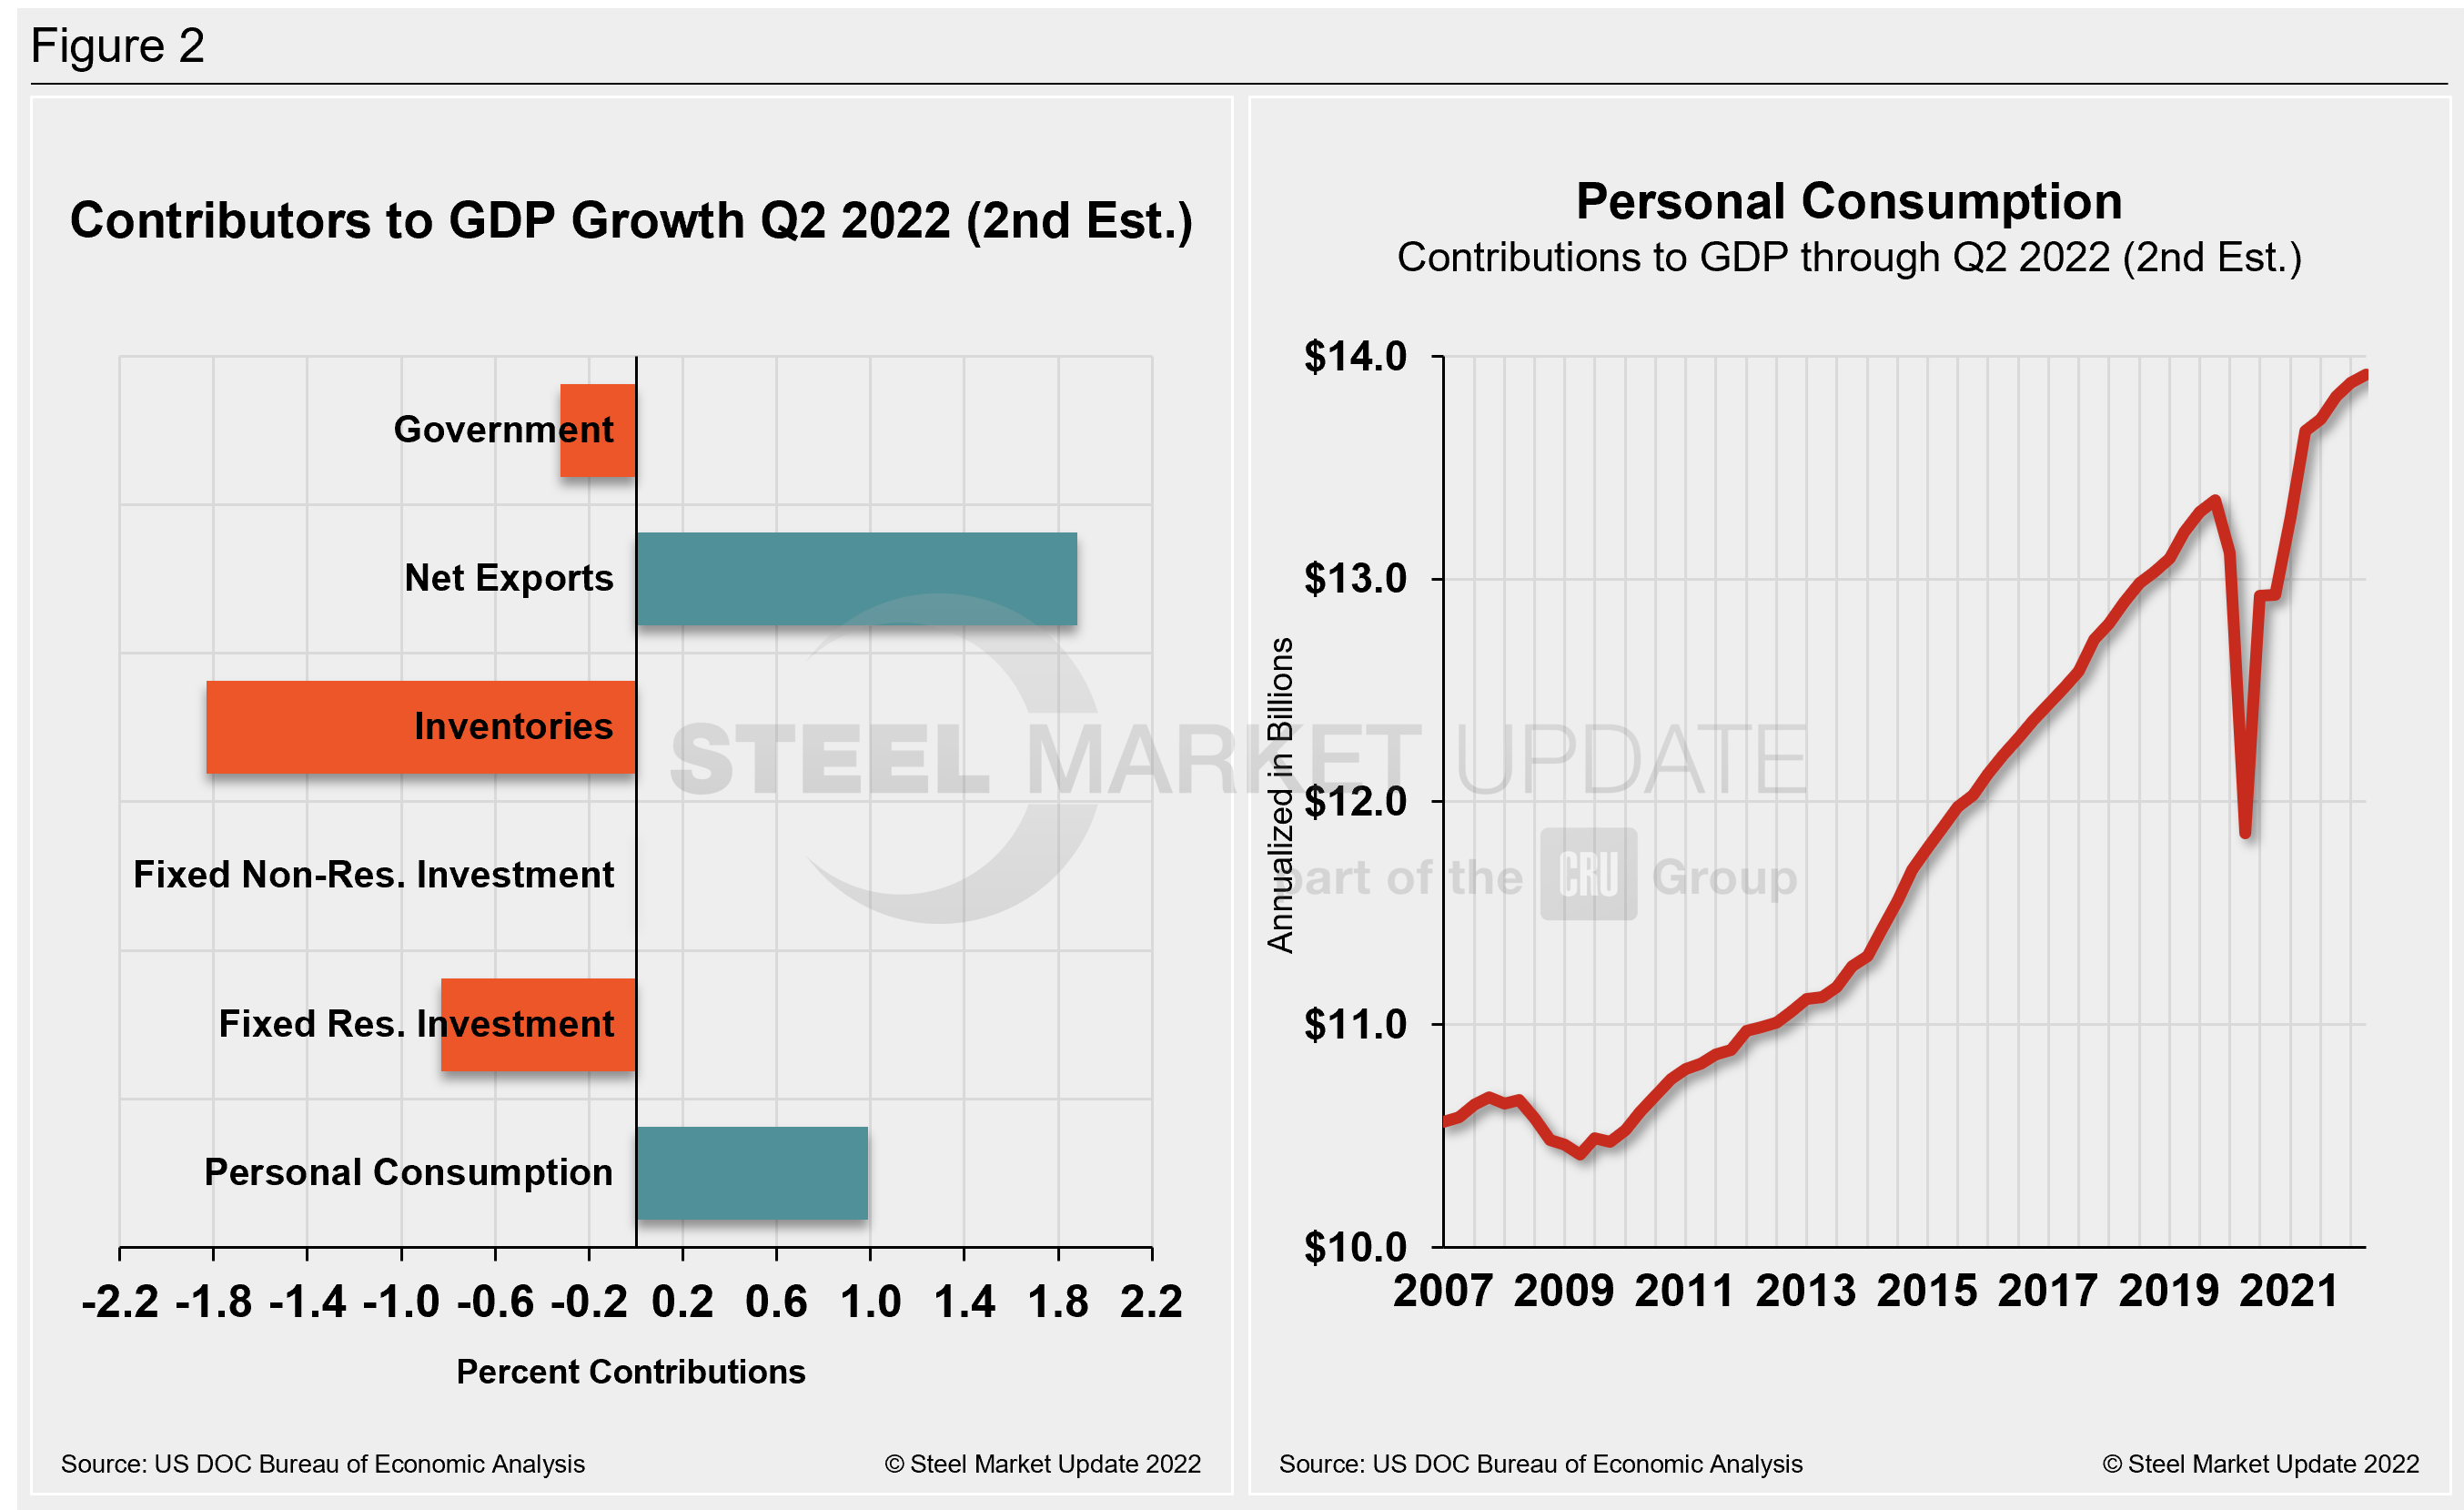
Shown below in Figure 2 is a side-by-side comparison of two charts. The mix of the six major components in the GDP growth calculation is on the left. The chart on the right puts a spotlight on personal consumption, a measure of consumer confidence and spending engagement.
The most notable change and a major source of GDP fluctuation is personal consumption, which has seen extreme swings since the onset of Covid. It has been resilient more recently but is no longer a bright spot after slipping from 1.24 to 0.99 quarter-on-quarter, slightly improved in the initial estimate. It is now at its lowest mark in two years.
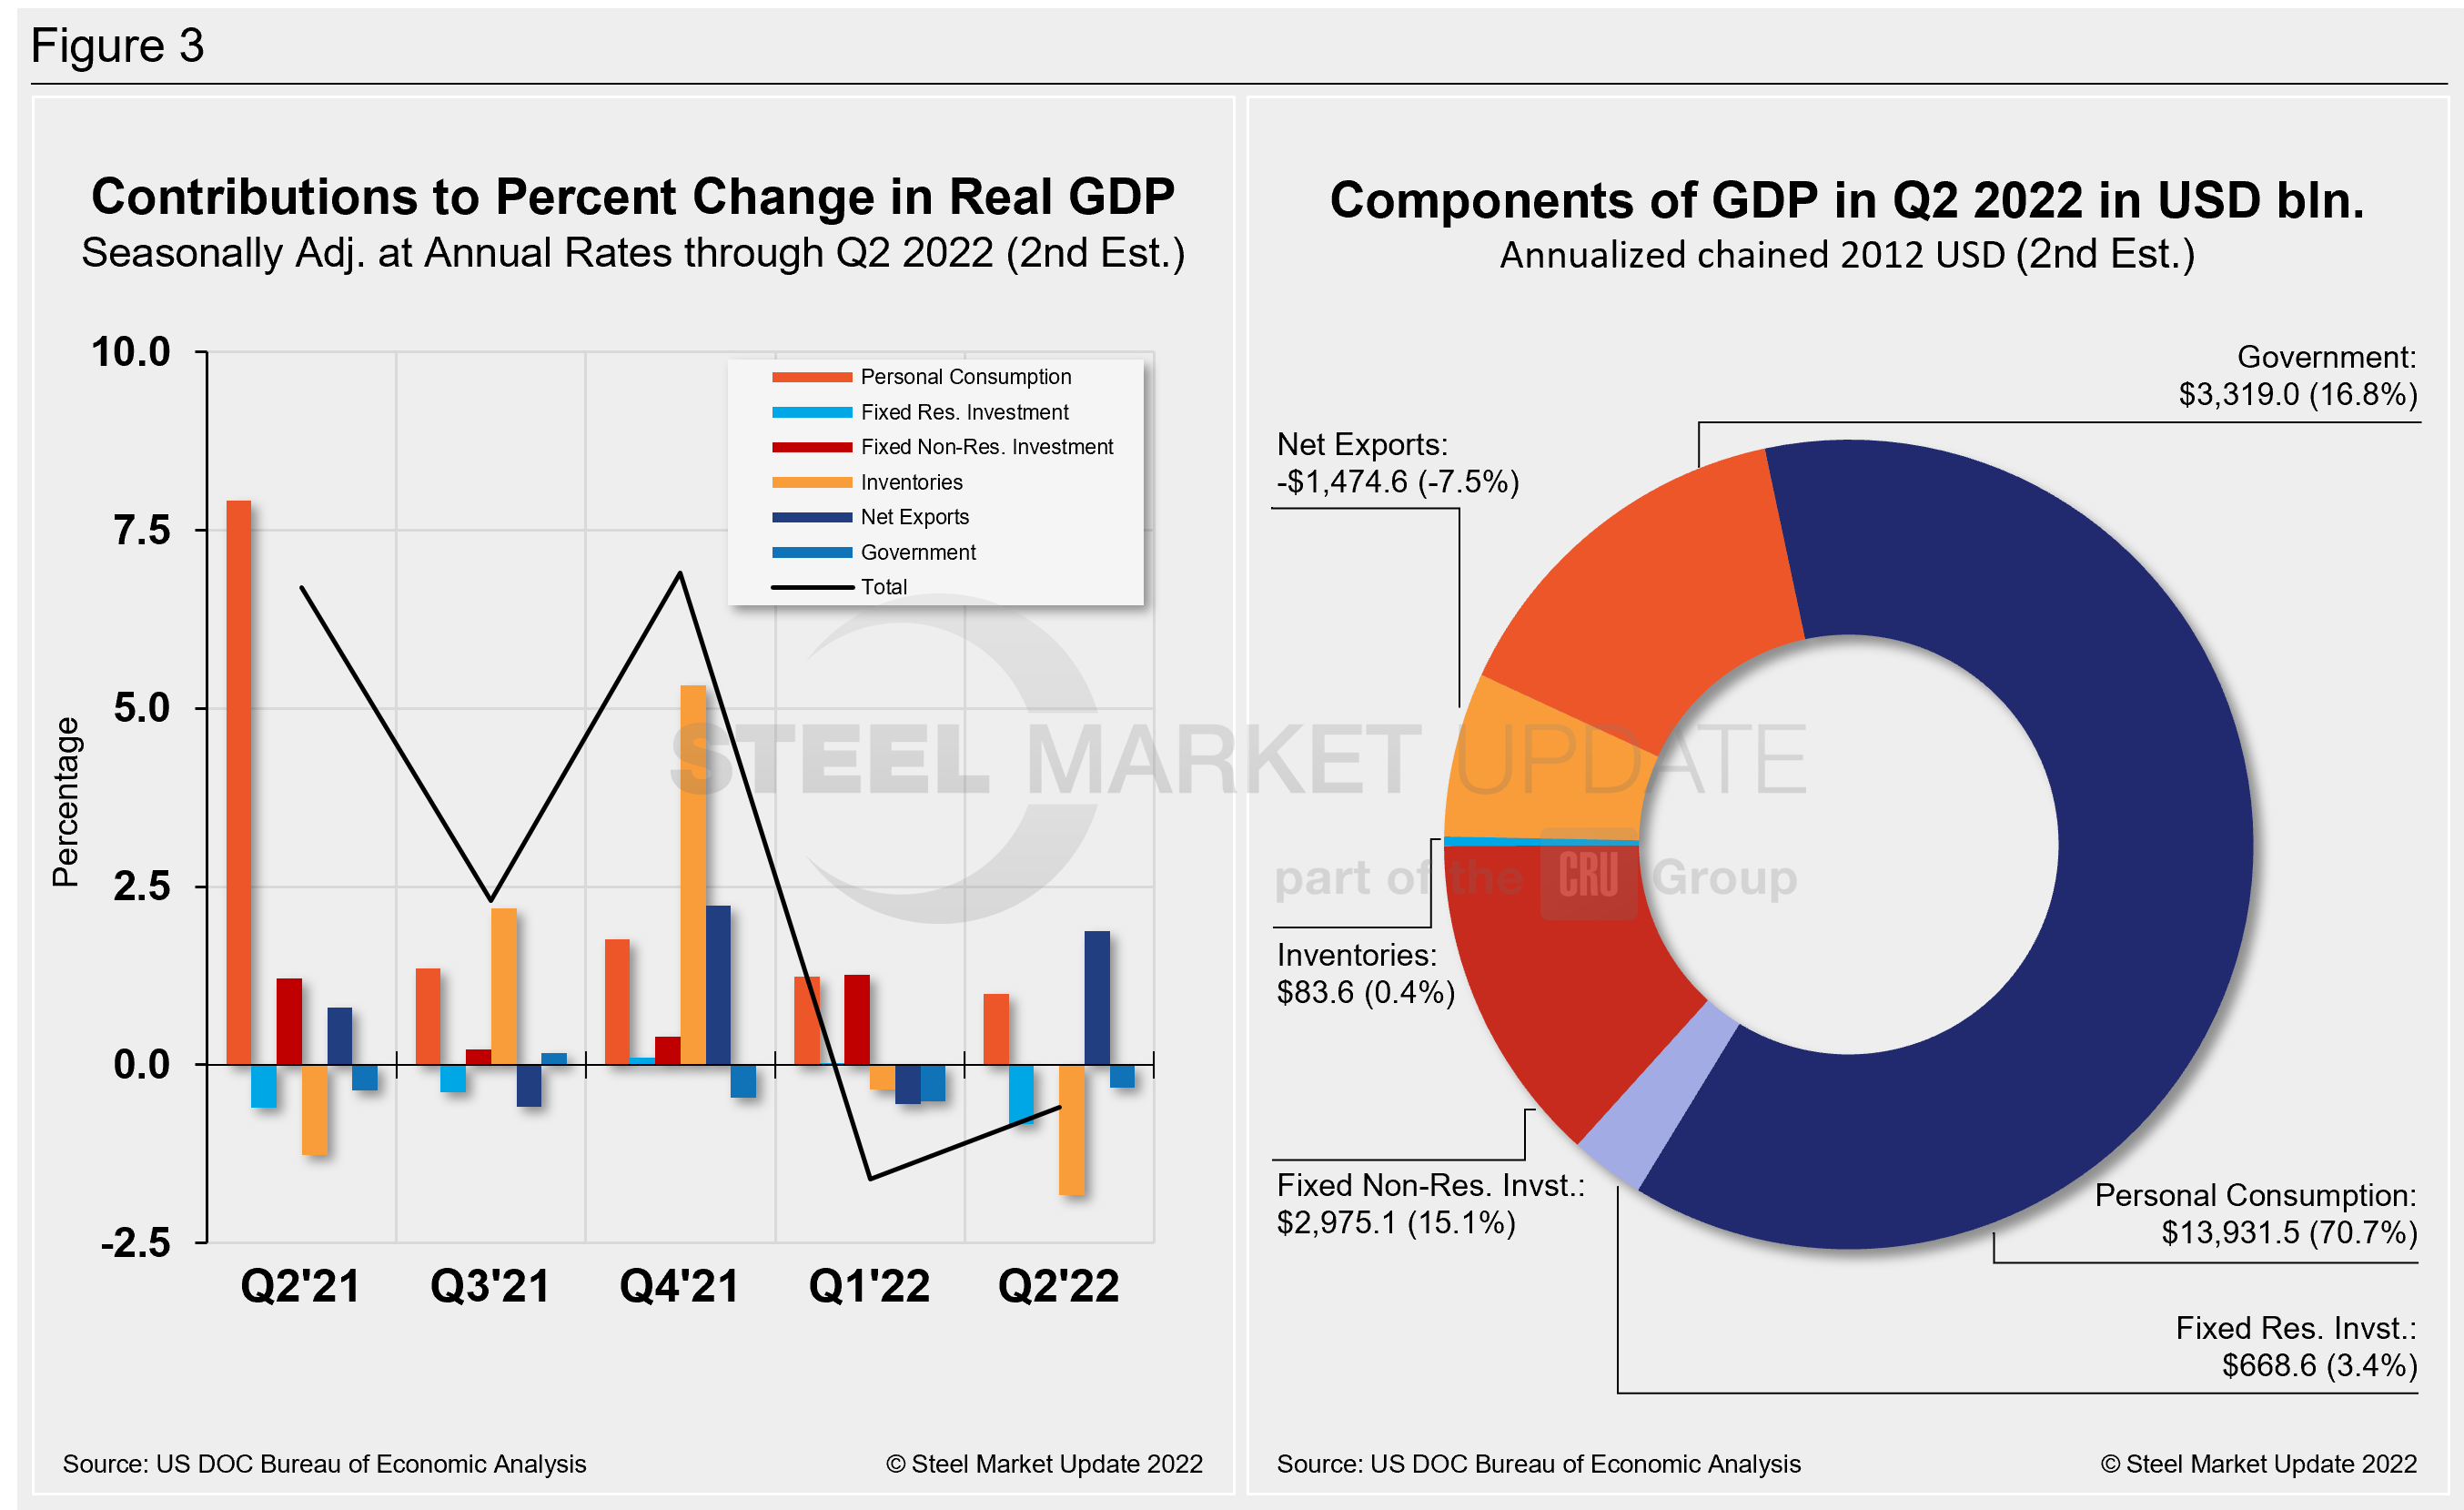
The quarterly contributions of the six major subcomponents of GDP since Q2 2021 and the breakdown of the $24.88 trillion economy in BEA’s third and final review of Q1 GDP are both shown in Figure 3. The chart on the left is for cross-comparison with Figure 1 above. The right chart shows the other components’ size relative to personal consumption.
By David Schollaert, David@SteelMarketUpdate.com


