

Market Data

October 28, 2022
US Economic Growth Surprises in Q3’s Early Review
Written by David Schollaert
The US economy posted its first period of growth for 2022 in the third quarter. Gross domestic production (GDP) accelerated to a 2.6% annualized pace for the period, temporarily stymying recession fears, according to the advanced estimate from the US Commerce Department’s Bureau of Economic Analysis (BEA).
The latest GDP reading follows two consecutive negative growth quarters to start the year, meeting a commonly accepted definition of recession, though the National Bureau of Economic Research (NBER), generally considered the arbiter of downturns and expansions, is likely to postpone a judgment for the time being.
While GDP gains came from increases in consumer spending, nonresidential fixed investment, and government spending, the growth came in large part due to a narrowing trade deficit — and that’s likely to be a one-off occurrence, according to economists.
The report reflected an ongoing shift to services spending over goods, with spending on the former increasing by 2.8% while goods spending dropped by 1.2%. Declines in residential fixed investment and private inventories offset the gains, the BEA said.
The underlying picture from the BEA report showed an economy slowing in key areas, particularly consumer and private investment.
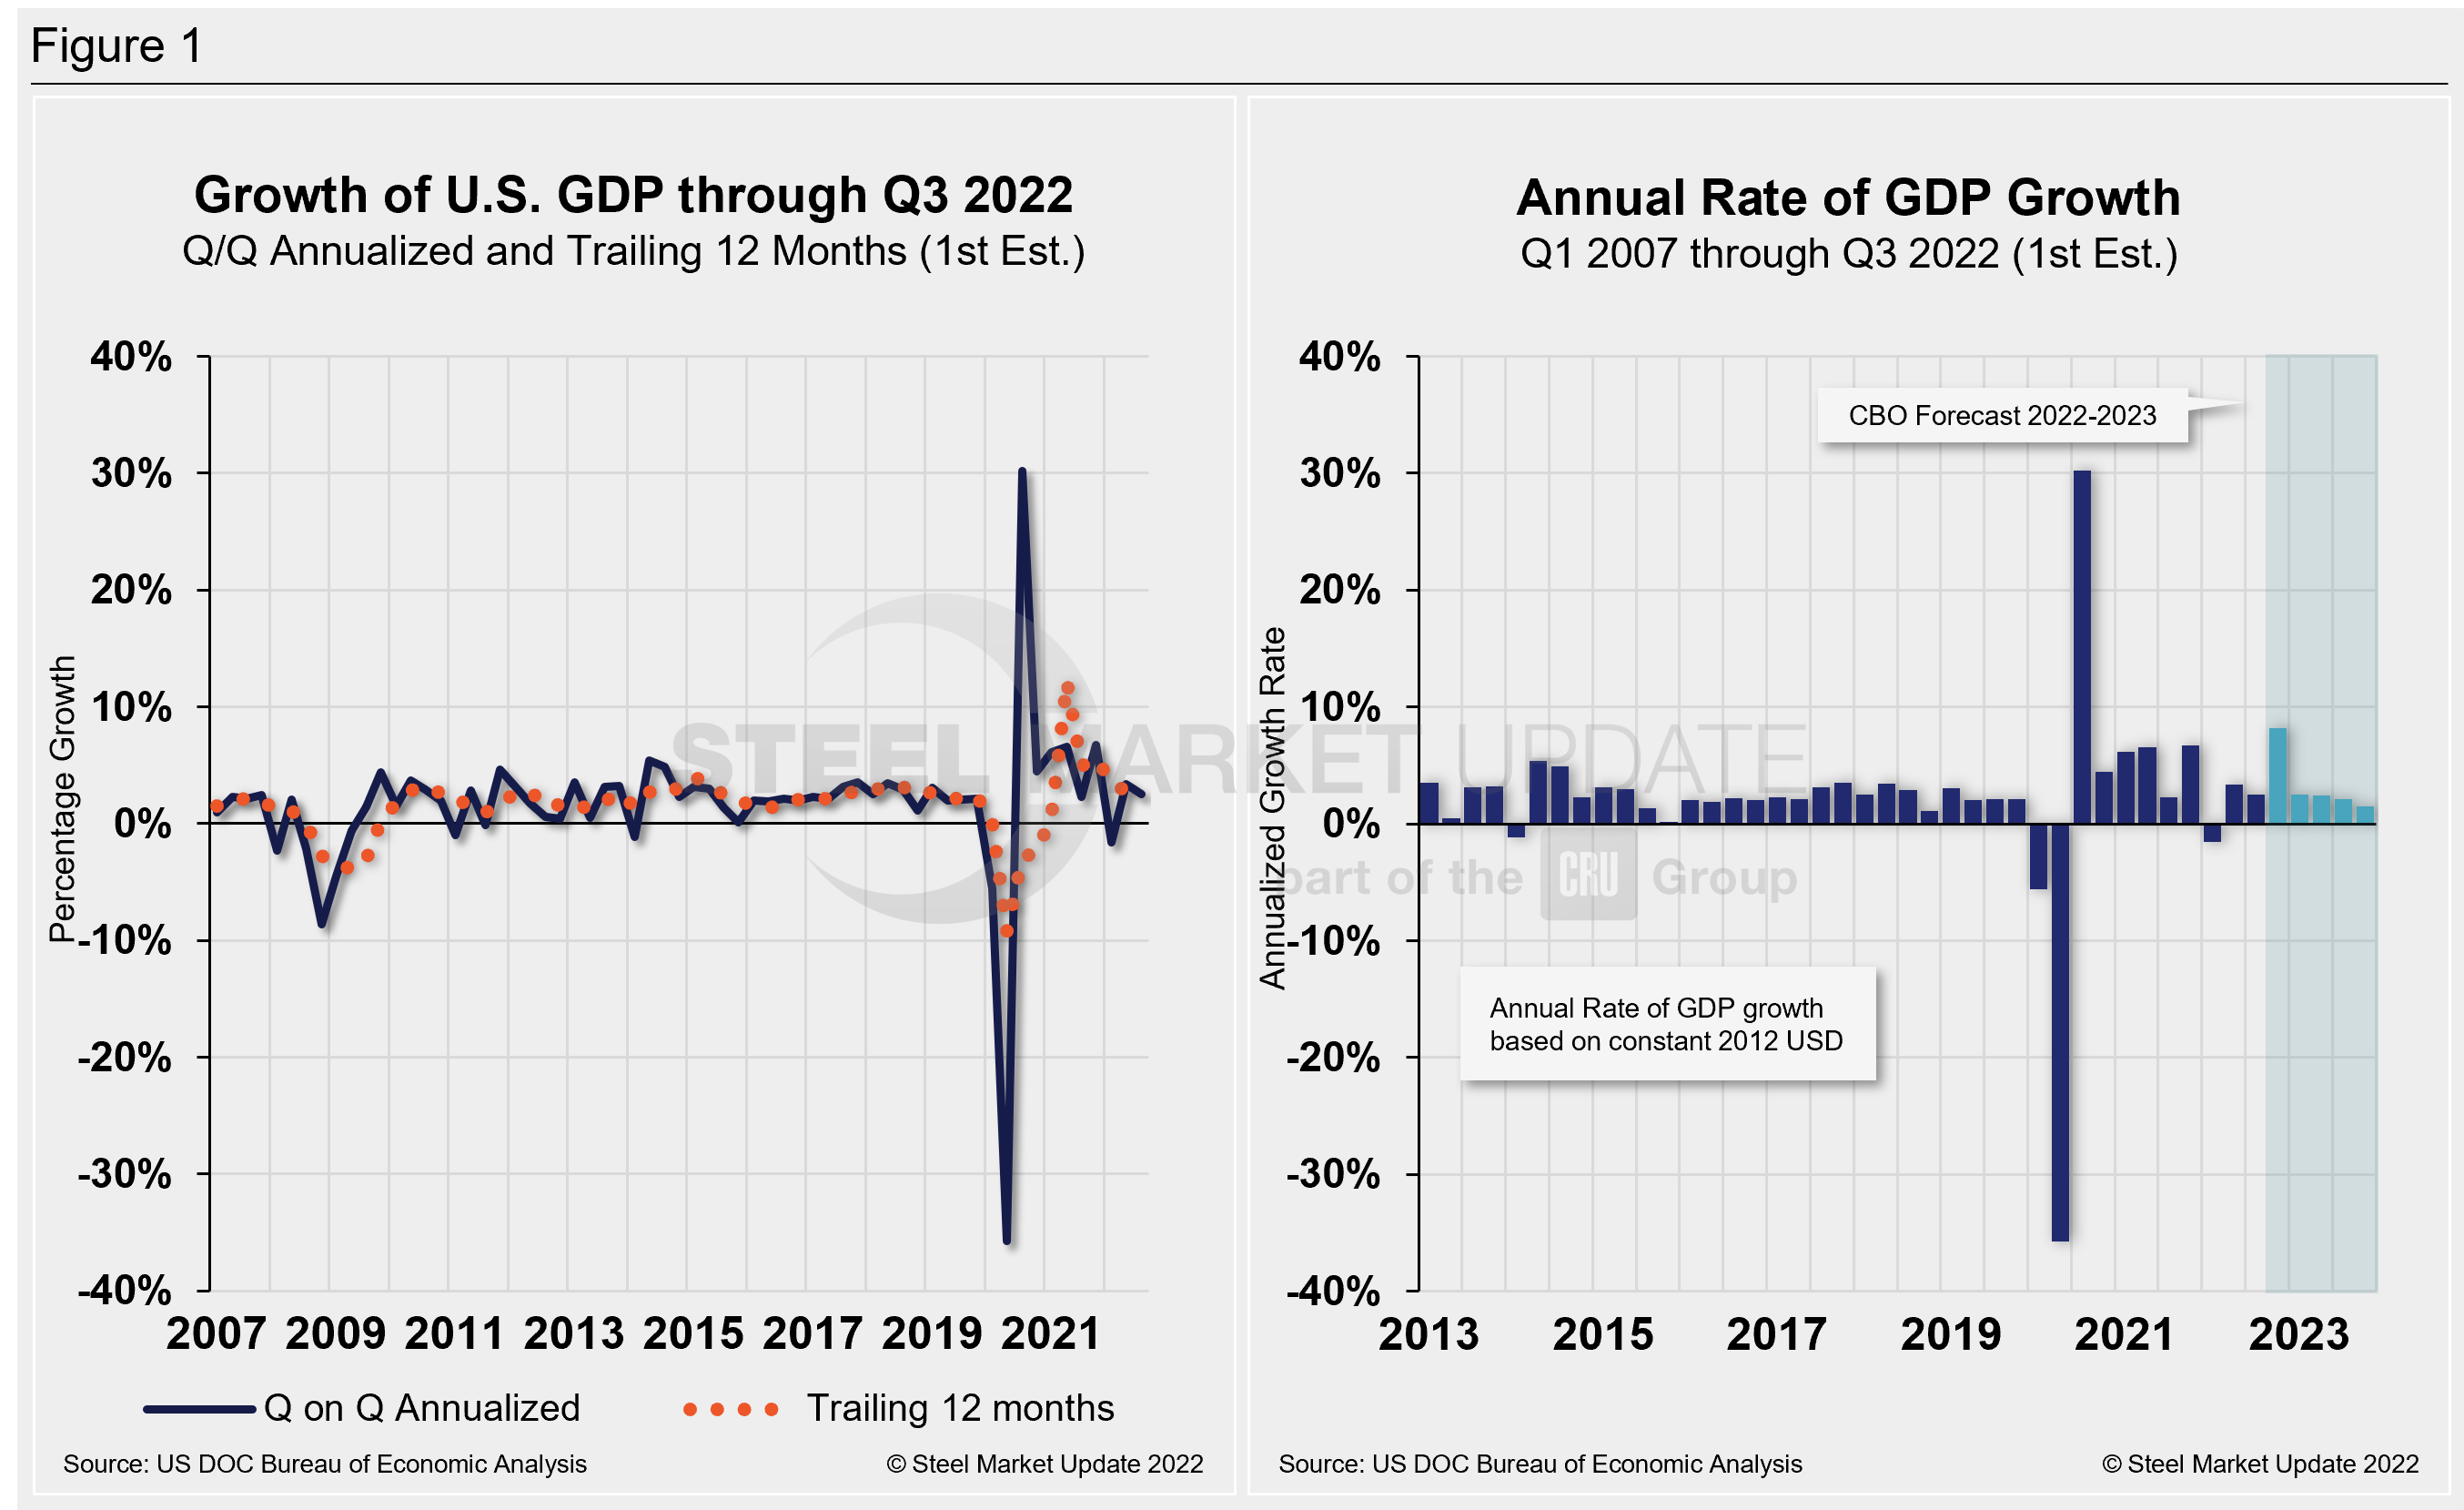
Commerce’s first look put the total US GDP in Q3 at $25.66 trillion, a 6.7% annual rate increase or $414.8 billion, over the previous quarter. Below in Figure 1 is a side-by-side comparison of US GDP growth and the annual rate of GDP, both through Q3 2022. In the first chart, you’ll see the contrast between the trailing 12-month growth and the headline quarterly result. The chart on the right details the headline quarterly results since Q1 2007, including the Congressional Budget Office’s GDP projection through 2023.
On a trailing 12-month basis, GDP accelerated by just 2.79% in Q3, up from 2.72% in the prior quarter but still well behind 12.23% growth in Q2 of 2021. Yet, it’s a vast improvement from -9.27% in Q2 2020 at the height of the pandemic. For comparison, the average in 51 quarters since Q1 2010 has been a growth rate of 2.15%.
The latest GDP figures come as policymakers fight a heavy battle against inflation, which is running at its highest levels in more than 40 years. Price surges have come due to several factors, many related to the pandemic but also pushed by an unprecedented fiscal and monetary stimulus that is still working its way through the financial system.
Consumer spending, as measured through personal consumption expenditures, rose by just a 1.4% pace in the quarter, down from 2% in Q2. Gross private domestic investment fell 8.5%, continuing a downward trend after falling 14.1% last quarter. Residential investment, a gauge of homebuilding, tumbled 26.4% after falling 17.8% in Q2, reflecting a sharp slowdown in the real estate market.
But it wasn’t all bad. Exports, which add to GDP, rose 14.4%, while imports, which subtract, dropped 6.9%. Net exports of goods and services added nearly three percentage points to the headline total, meaning GDP essentially would have been flat otherwise.
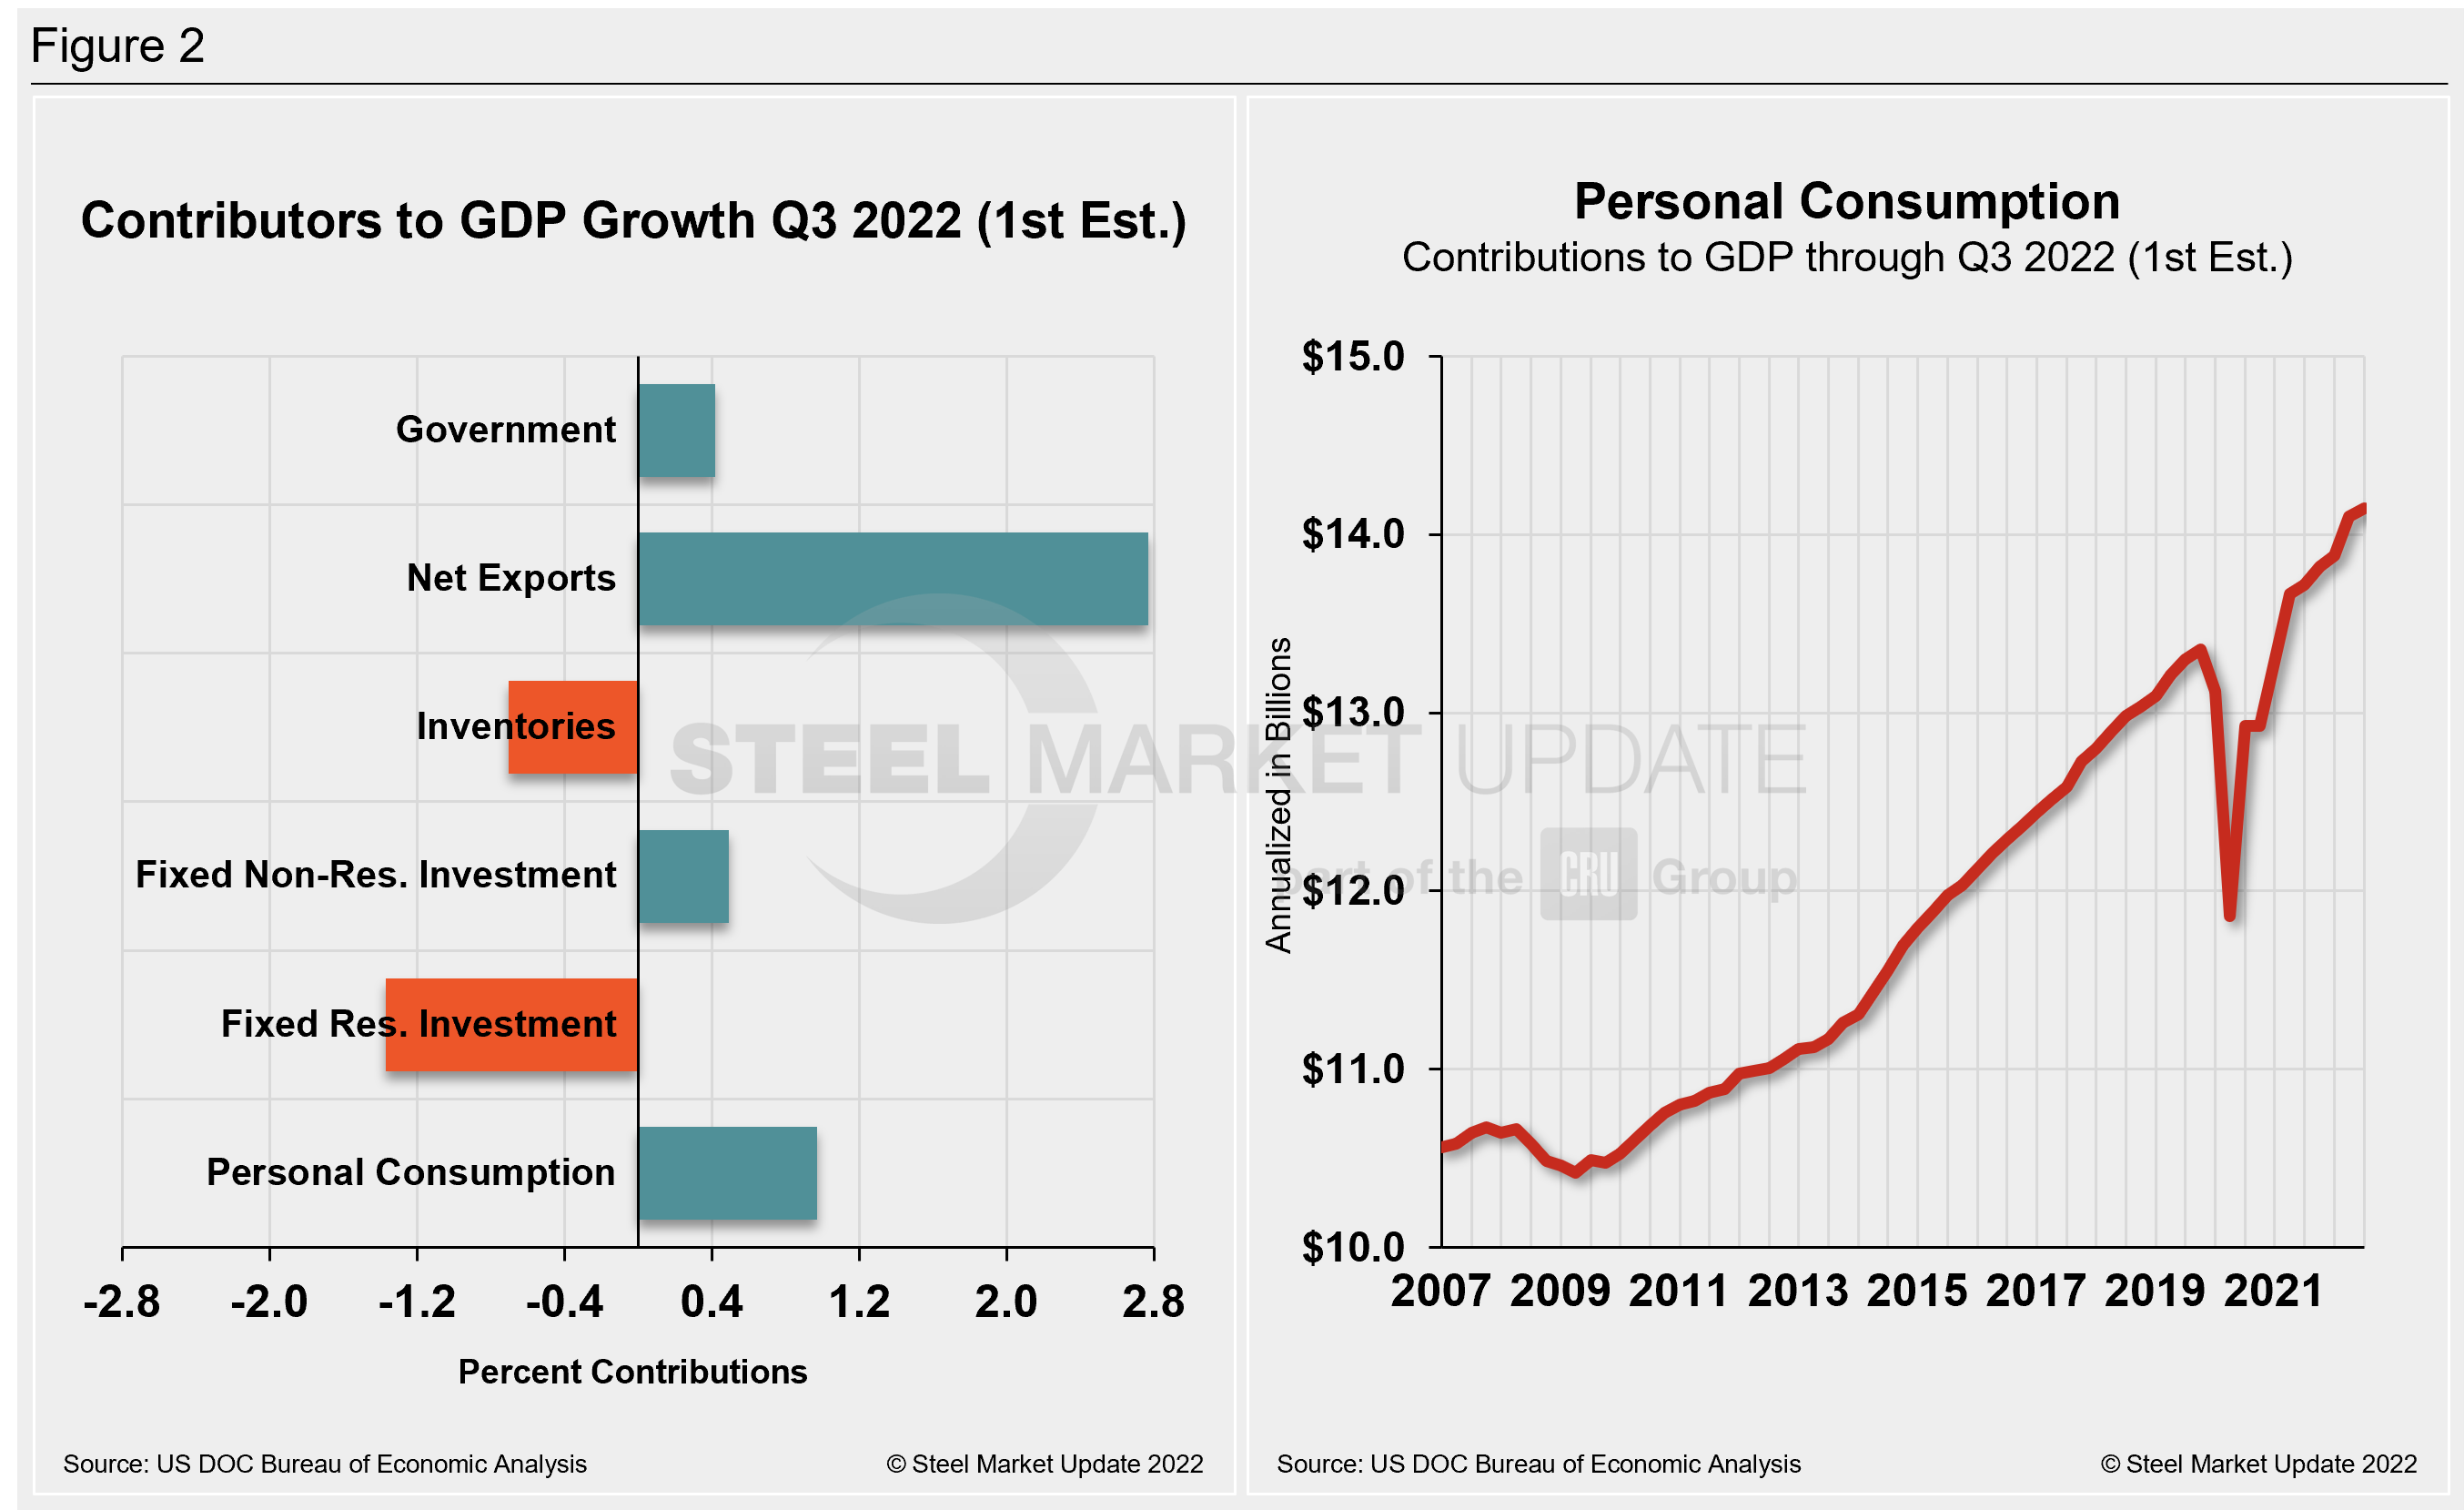
Shown below in Figure 2 is a side-by-side comparison of two charts. The mix of the six major components in the GDP growth calculation is on the left. The chart on the right puts a spotlight on personal consumption, a measure of consumer confidence and spending engagement.
The most notable change and a major source of GDP fluctuation is personal consumption, which has seen extreme swings since the onset of Covid. It has been resilient more recently but is no longer a bright spot, and is at its lowest mark in two years.
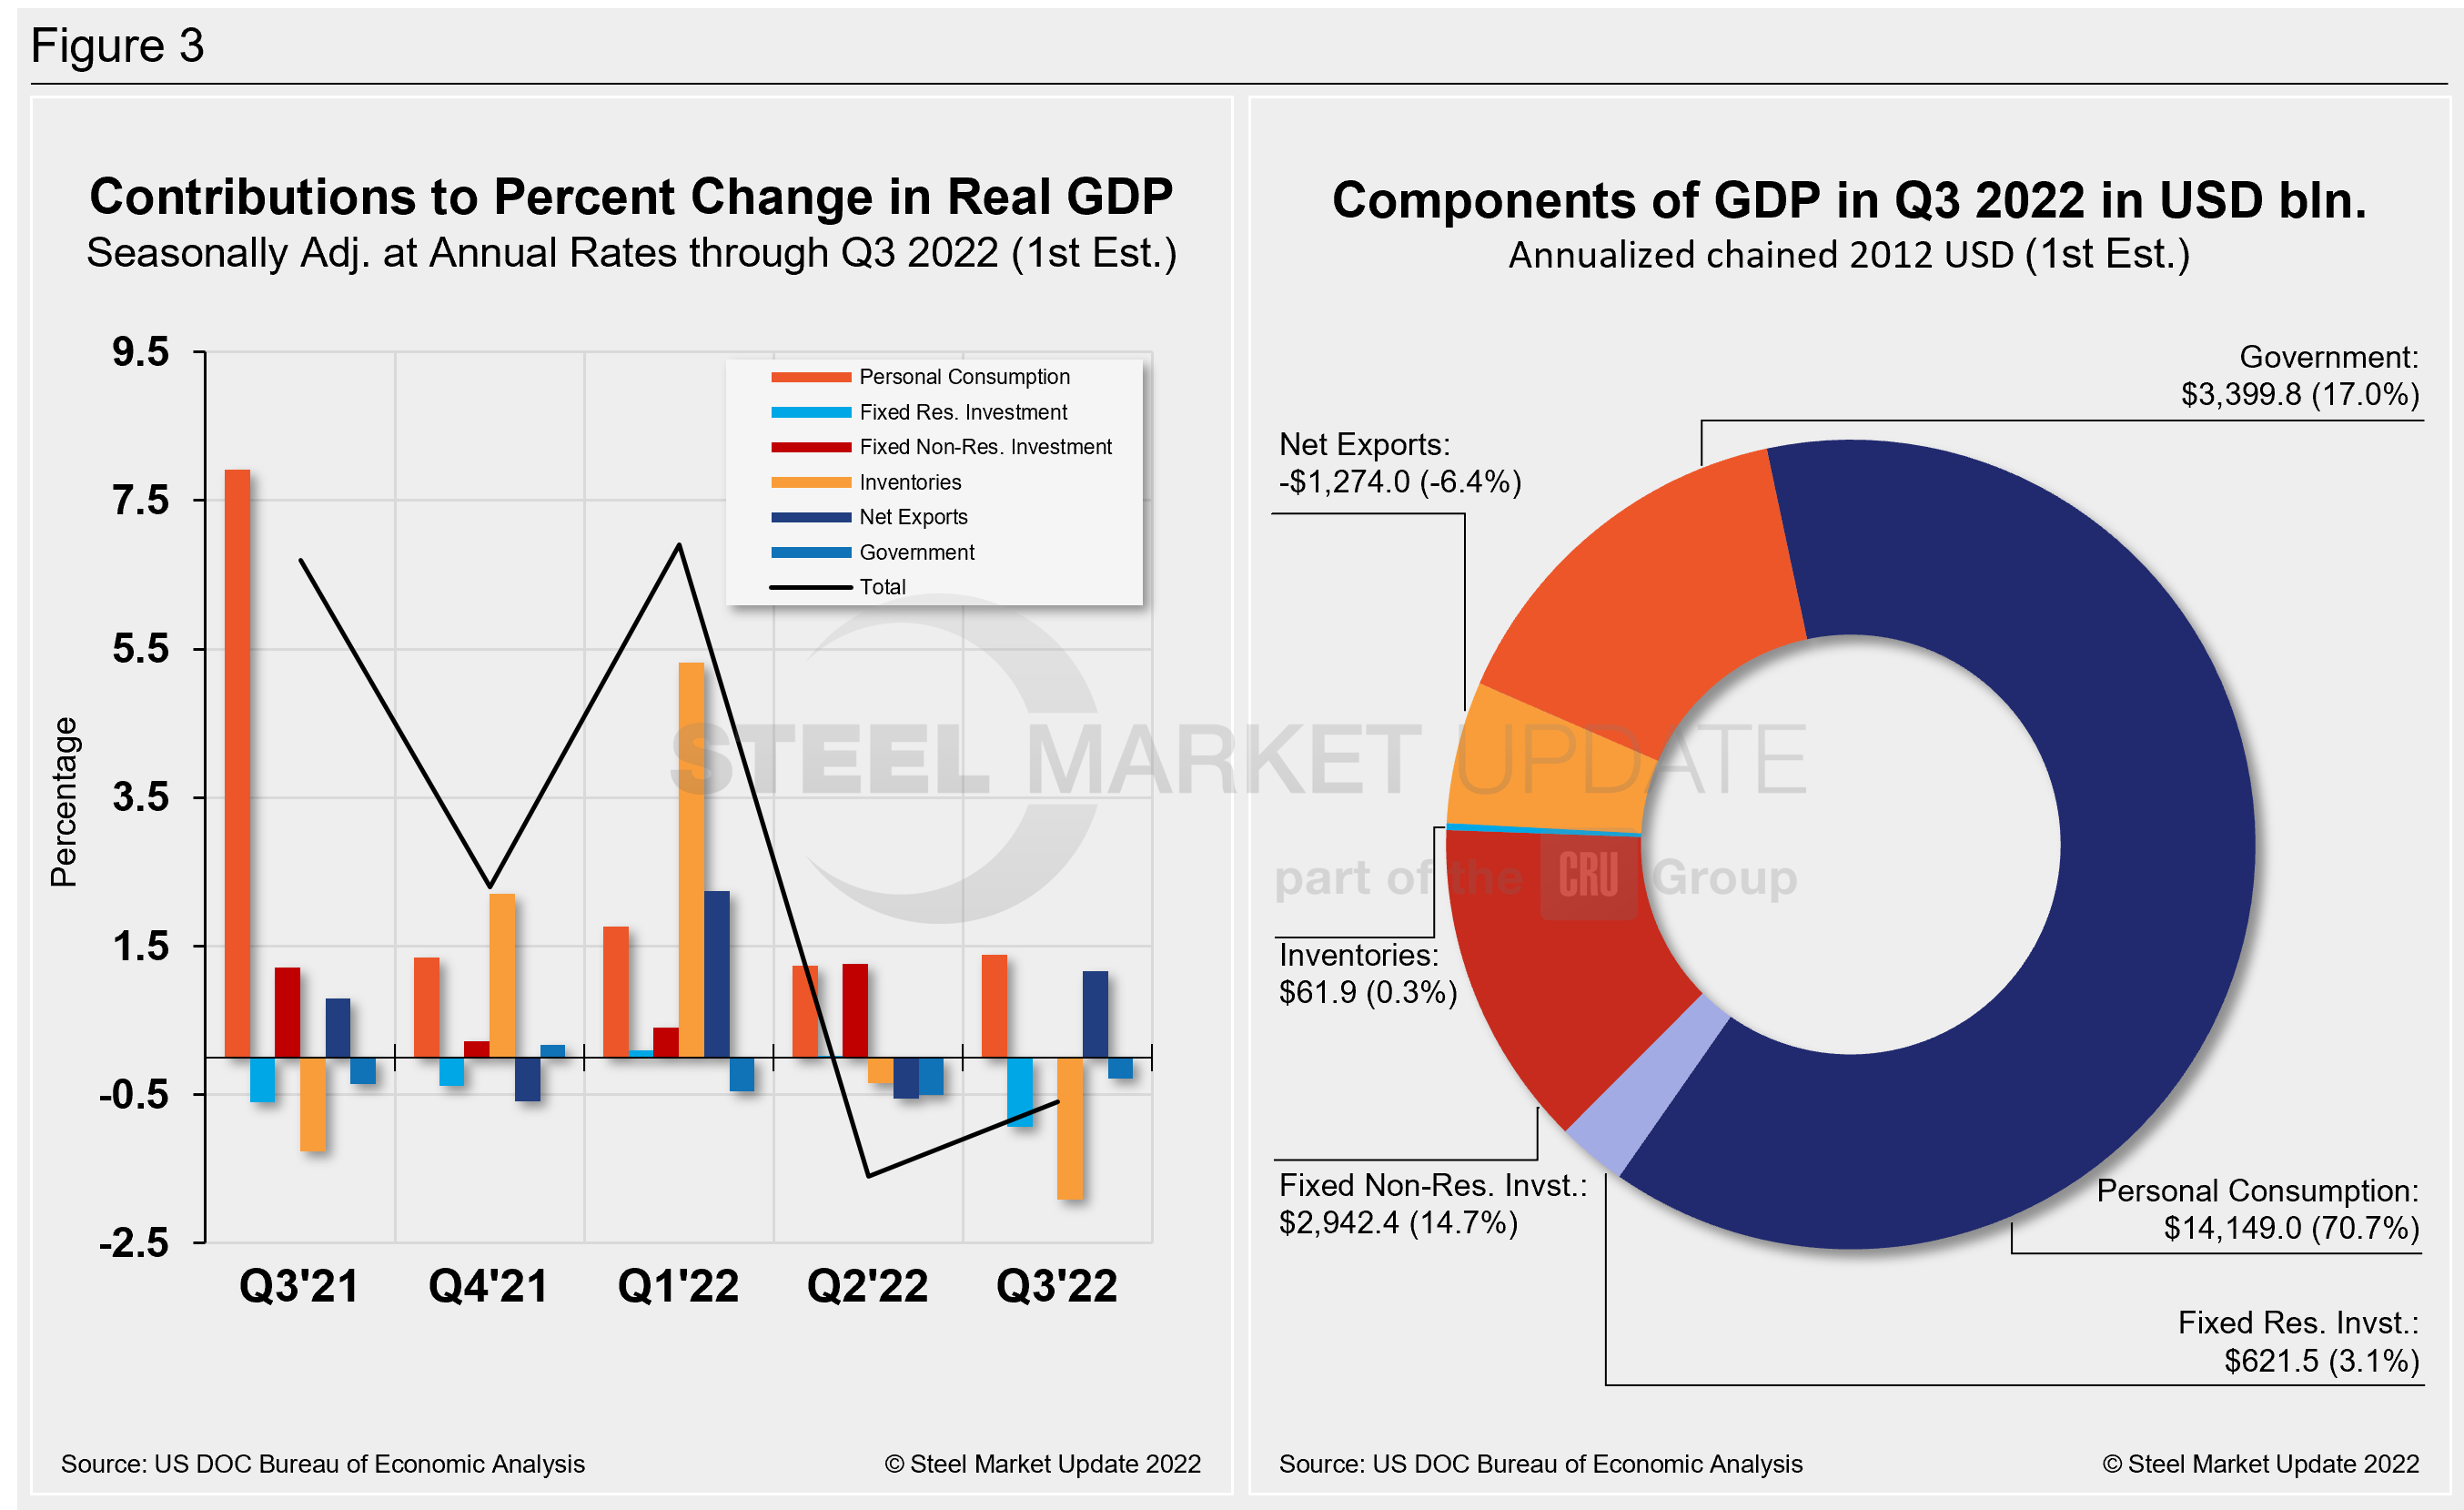
The quarterly contributions of the six major subcomponents of GDP since Q2 2021 and the breakdown of the $25.66 trillion economy in BEA’s first review of Q3 GDP are both shown in Figure 3. The chart on the left is for cross-comparison with Figure 1 above. The right chart shows the other components’ size relative to personal consumption.
By David Schollaert, David@SteelMarketUpdate.com


