

December 22, 2022
Hot Rolled Futures: Could Winter Storms Scramble Prices?
Written by David Feldstein
Editor’s note: SMU Contributor David Feldstein is president of Rock Trading Advisors. Rock provides customers attached to the steel industry with commodity price risk management services and market intelligence. RTA is registered with the National Futures Association as a Commodity Trade Advisor. David has over 20 years of professional trading experience and has been active in the ferrous derivatives space since 2012.
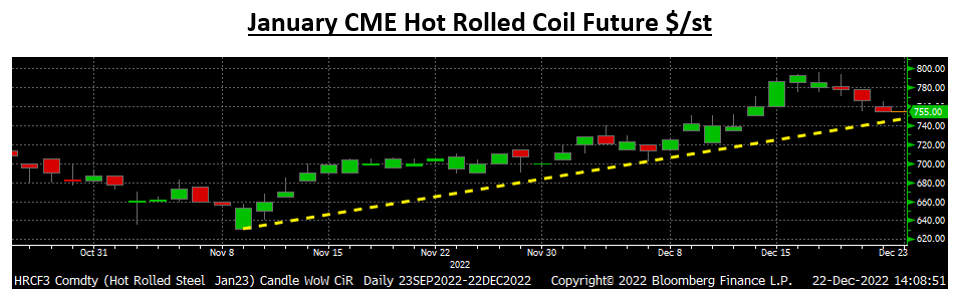
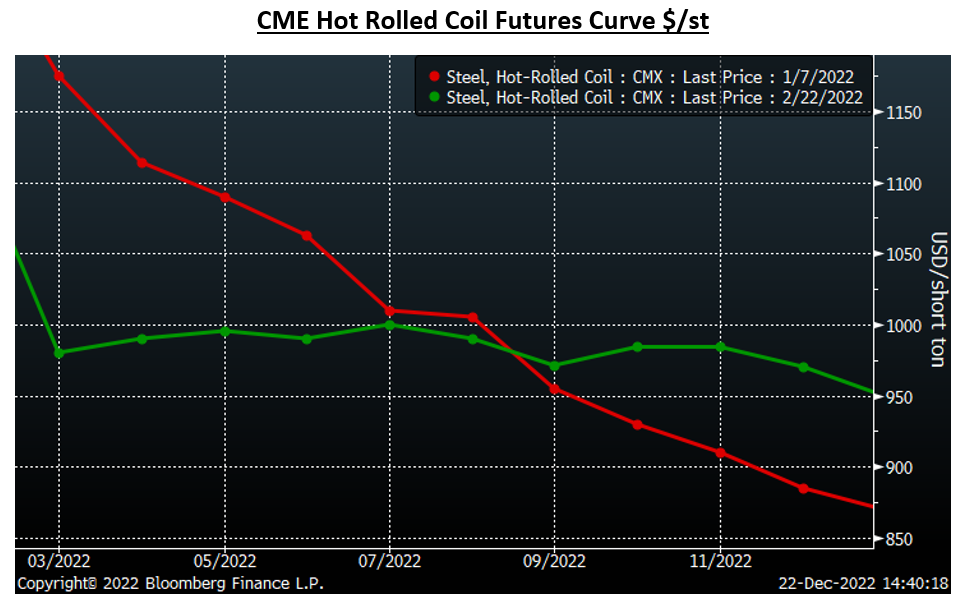
The winds of change have blown through the Midwest, with hot-rolled (HR) futures having bottomed on Nov. 9. That day, the January future traded as low as $631, while the December future’s low was $621. The January future has since rallied to an intraday high of $796 on Monday, a $165 jump from low to high. The January future has broken above its downtrend that started in mid-August during the rally off Nucor’s price increase announcement.
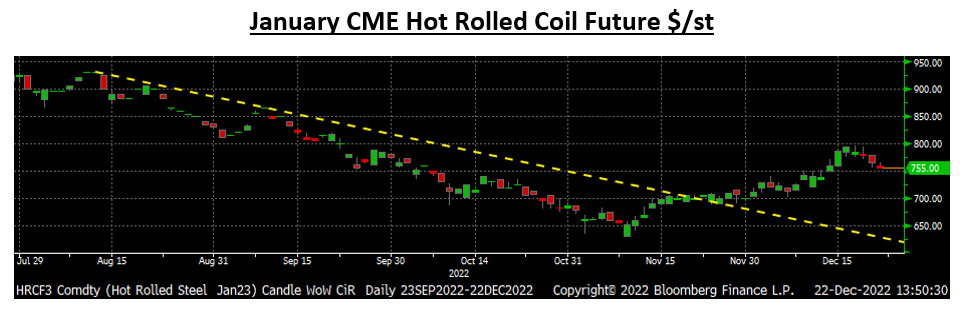
At $796, the January future had gained 26% off its low of Nov. 9. The rule of thumb for determining a bear or bull market is 20%, so is Midwest hot-rolled (HRC) in a new bull market? Does this rally have legs, or is this a head fake, a dead cat bounce?
Before there were Covid lockdowns, 232 tariffs, chip shortages, Russian invasions, and 6% inflation, winter weather rivaled unplanned disruptions as the top catalyst for price spikes. The winds of change have been replaced with Winter Storm Elliott’s bomb cyclone 50 mph winds. We saw some storm hedge buying in busheling yesterday and today, but otherwise the threat of the storm appears to have been mostly ignored. In fact, the HRC curve has been under pressure since peaking earlier this week.
An aggressive seller or sellers appeared mid-day on Tuesday, flipping the screen from green to red. When the dust cleared, 55,000 tons traded that day, the most since September and second-highest trading volume of the back half of the year. Since Monday’s settlements, the curve has given back $20-$27 depending on the month. However, this storm is on a path to ravage the Midwest, Northeast, and into Canada. At best it will disrupt scrap flows for a few days, and at worst it could shut down a mill or multiple mills like it did in February 2021.
For some time we have seen flat rolled and imports in sharp decline. November ‘s HR imports were down 50%, or 163,000 short tons, year on year (YoY), while slab imports fell 246,000 tons, or 62%, YoY. Year to date, slab imports are down 2.5 million short tons, or 44%, YoY. The service center (distribution) channel is also running low on supply, leaving a dearth of domestic iron units heading into Q1. These two supply channels have been flashing empty for months and have followed their respective trends to their lowest levels yet in November.
The one new development has been a shift in expectations from prices will be lower tomorrow, next week, or next month, to prices will be higher next week, next month, etc. We see this shift in expectations in the rebound in physical indices and rallies in the HRC and busheling futures curves. The HRC curve has shifted from contango (upward sloping) to about flat following its $80-$120 rally since Nov. 9 when using today’s settlements.
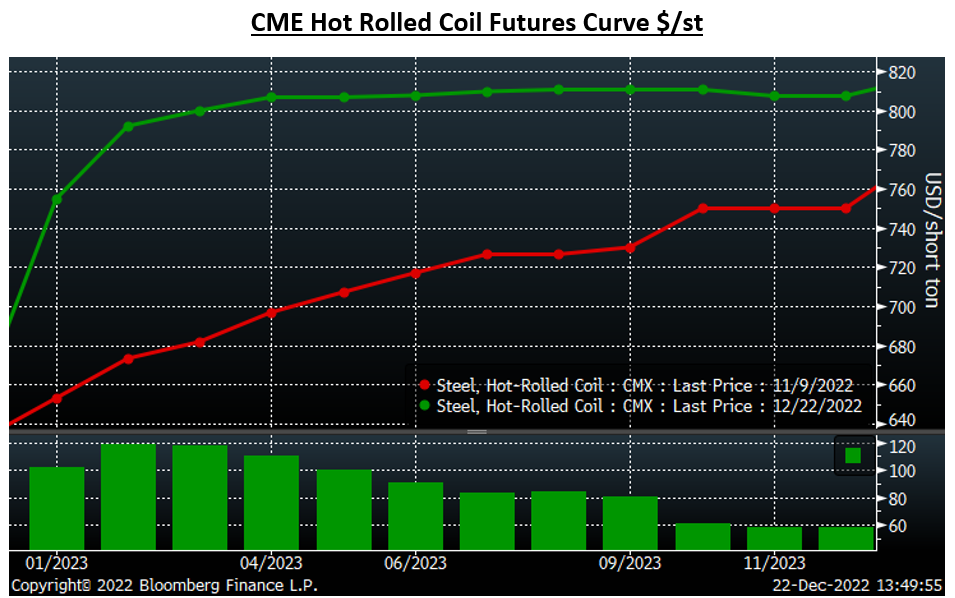
I can’t help being reminded of a similar shift in the HRC futures curve 10 months ago when the curve shifted from being steeply backwardated to flat just before that little rally that happened in late February and into March.
Earlier today, a Bloomberg article titled Traders’ $129 Billion Commodities Exodus Marks a Historic Shift stated “clearing houses boosting collateral requirements…higher interest rates raising borrowing costs…the liquidity crunch threatens to disrupt already stressed supply chains, fuel inflation and trigger bankruptcies and bailouts.”
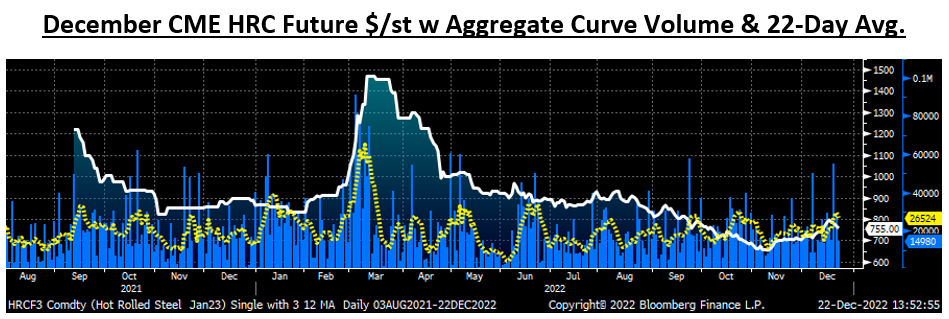
Volume and open interest (open interest is the number of outstanding futures contracts, or tons in this case, across a product’s curve) are areas I watch closely as metrics for liquidity, and ones I have been noting for some time are also flashing yellow. Both have declined since the spring, leaving the futures market vulnerable to a serious bout of volatility if an unexpected event, like a bad storm knocking a steel mill(s) offline, or dramatic shift in sentiment, expectations, demand, etc., creates an extreme imbalance between buyers and sellers.
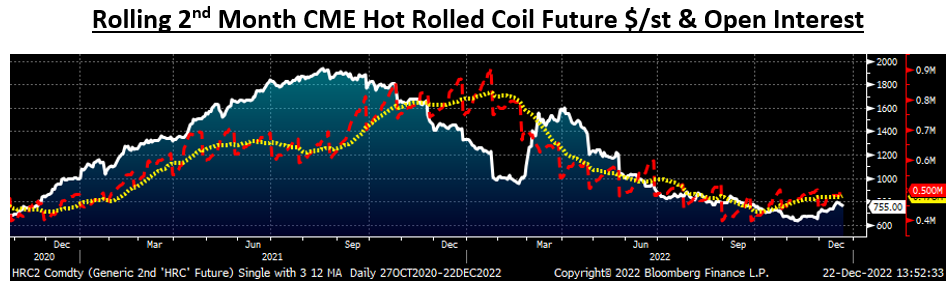
In the chart above, you will see open interest climbing starting in February 2021, as I believe forward buying by original equipment manufacturers (OEMs) flooded into the market. At the moment, open interest remains just off its lows, but by no means is seeing an influx of orders. That is likely because the spot market remains well below the futures curve trading around $800. However, as we move into January, that spread quickly goes away. If the rally continues, then perhaps the curve shifts into backwardation, and another wave of forward buying arrives lifting HR futures higher.
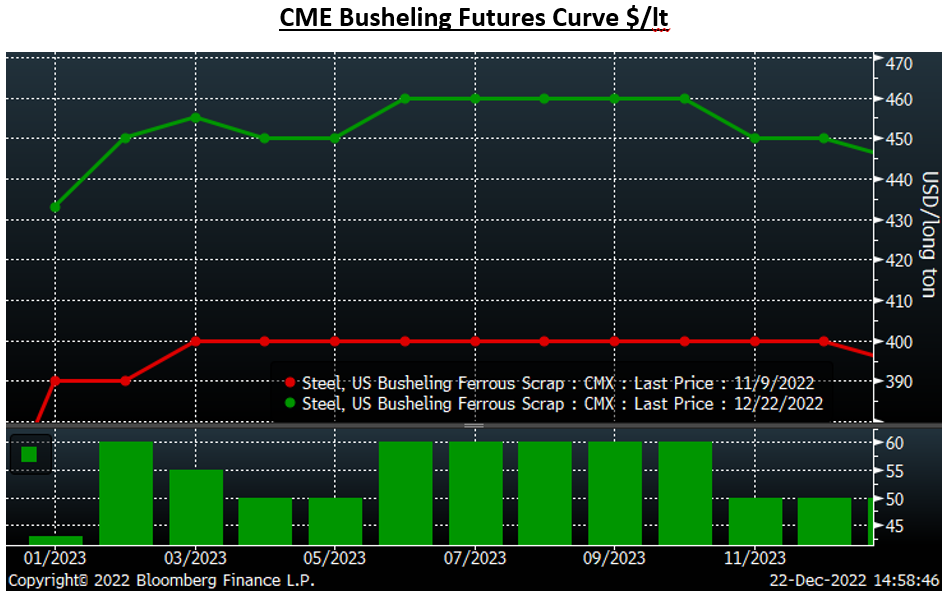
The December busheling future expired last week at $389.61, up $29.89, or 8.3% month on month (MoM), snapping a very painful seven-month losing streak. The January future settled at $433, implying another $43-MoM increase, while February closed above January at $450. Since Nov. 9, the busheling futures curve has gained $50 – $60, depending on the month.
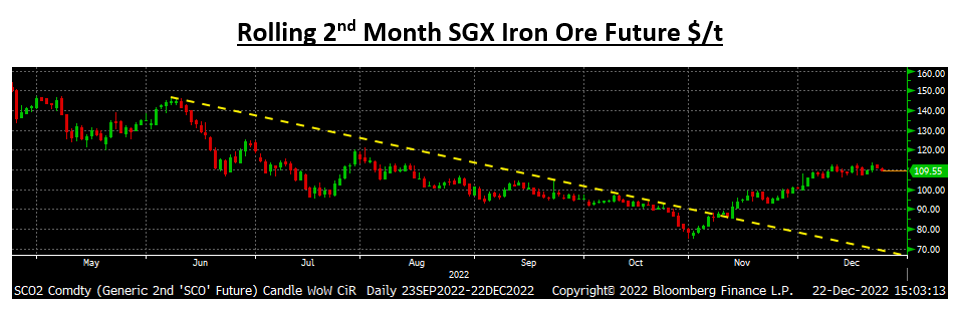
Flat-rolled prices are rallying globally, with China’s reopening and flood of stimulus set to hit their economy in 1H 2023. Iron ore bounced off its low of $75 on Halloween to then break above its multi-month downtrend. Iron ore has consolidated around $110/t over the past 15 trading sessions, posting a 45% gain off its low.
The shift in Midwest flat-rolled price expectations could be the catalyst that carries the market higher in Q1. When buyers expect prices to be higher tomorrow, etc., they rush in their orders and increase tonnage, i.e., double or over buy. Also, speculators burst into the market like Kramer into Jerry’s apartment on Festivus on Seinfeld. If these two factors manifest themselves, they will rapidly fill the mills’ order books and push lead times out. This could present a nasty situation for those betting on the status quo and holding lean inventory levels.
Has the general assumption in recent months been that flat rolled will be oversupplied and readily available in 2023? If so, have a majority of buyers refrained from locking in contract tons, instead choosing to buy tons in the spot market? What happens if their assumption proves to be not only incorrect, but also that the opposite occurs: that the spot market abruptly tightens up? What happens if demand comes back faster than supply, or if there is an unplanned disruption due to say a winter storm? A big old crazy HR rally is what will happen, so buckle your chinstrap and wait for the holiday dust to clear. Kickoff 2023 starts on Jan. 9.
Happy Holidays!! Happy New Year!!!
Disclaimer: The content of this article is for informational purposes only. The views in this article do not represent financial services or advice. Any opinion expressed by Feldstein should not be treated as a specific inducement to make a particular investment or follow a particular strategy, but only as an expression of his opinion. Views and forecasts expressed are as of date indicated, are subject to change without notice, may not come to be and do not represent a recommendation or offer of any particular security, strategy or investment. Strategies mentioned may not be suitable for you. You must make an independent decision regarding investments or strategies mentioned in this article. It is recommended you consider your own particular circumstances and seek the advice from a financial professional before taking action in financial markets.
By David Feldstein, Rock Trading Advisors
