

Market Data
August 20, 2023
SMU Steel Demand Index Down Marginally, Again
Written by David Schollaert
Editor’s note: Steel Market Update is pleased to share this Premium content with Executive members. For information on upgrading to a Premium-level subscription, contact Lindsey Fox at lindsey@steelmarketupdate.com.
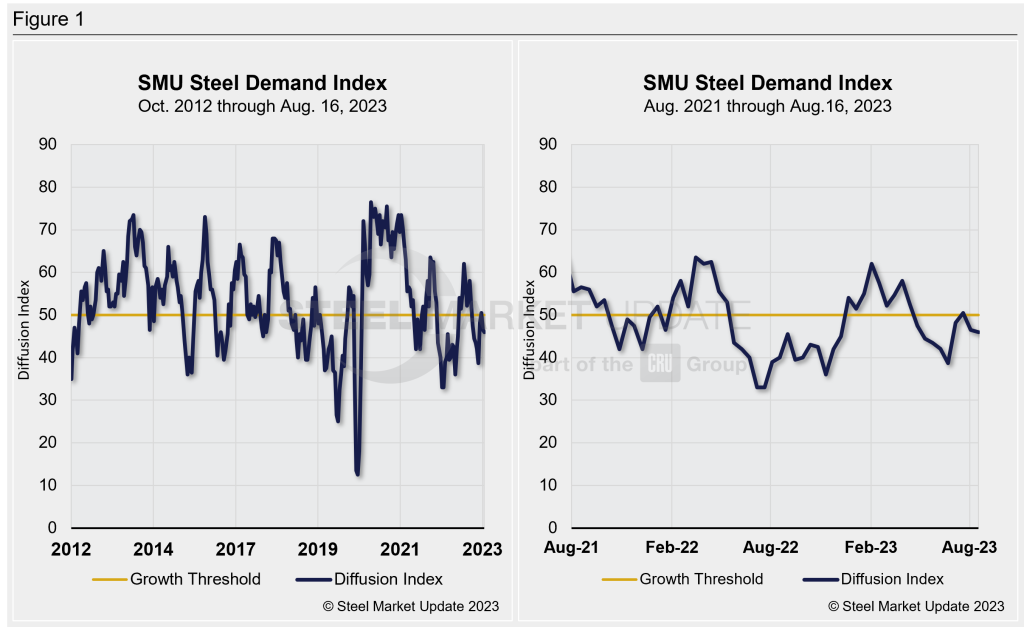
Steel Market Update’s Demand Index remains in contracting territory, where it has been for most of the last four months, according to the latest survey data. While the market did react temporarily in response to mill price hikes in mid-June, apparent demand for flat-rolled steel in the US continues to trend down.
SMU’s Steel Demand Index now stands at 46, down half a point from a reading of 46.5 in early August. The measure was also down 16 points from the recent high of 62 reached in February. It has now been mostly on a downtrend since early April.
The index, which compares lead times and demand, is a diffusion index derived from the market surveys we conduct every two weeks. This index has historically preceded lead times, which is remarkable given that lead times are often seen as a leading indicator of steel price moves.
An index score higher than 50 indicates an increase in demand and a score below 50 suggests a decrease. Detailed side-by-side in Figure 1 are both the historical views and the latest Steel Demand Index.
Overall market sentiment is still very much mixed when it comes to demand. Most agree that demand is down, especially for hot-rolled coil, but coated products are bucking that trend. Despite the general consensus, what continues to be a polarizing theme and source of concern amongst many, are the labor contract negotiations between the United Auto Workers (UAW) union and Detroit’s “Big Three” automakers. Still, demand is ahead of last summer, a positive sign for others.
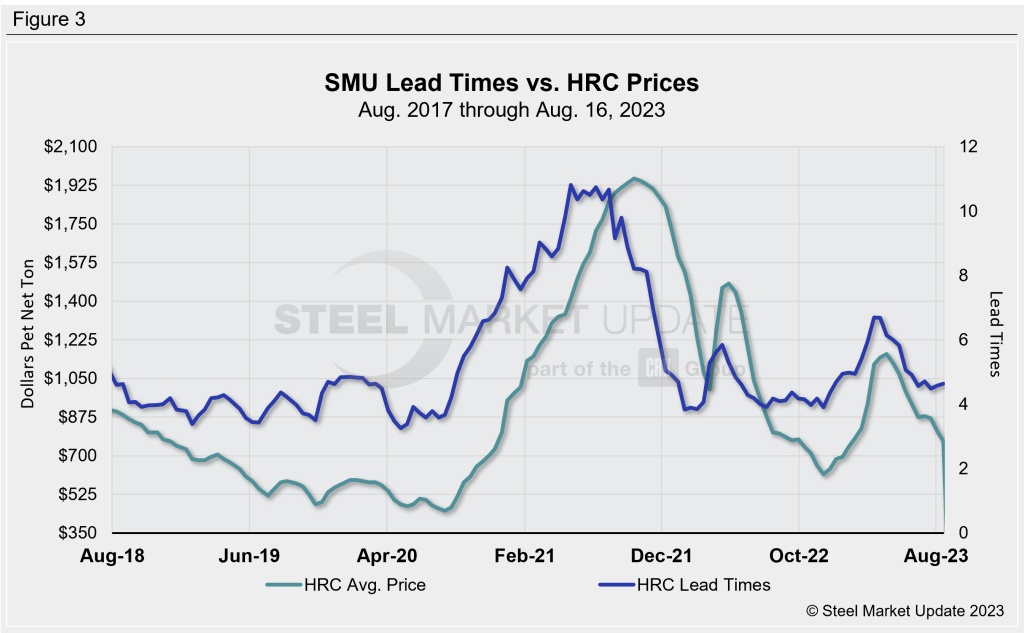
SMU’s latest check of the market on Aug. 15 placed HRC at $765 per ton ($38.25 per cwt) on average FOB mill, east of the Rockies, down $30 per ton vs. the prior week. Hot band is now down $395 per ton since reaching the recent high of $1,160 per ton in mid-April.
There are still questions regarding upcoming outages, a potential reason for the rise of material on order, even as service center inventories saw a boost in July. Post-summer seasonality will provide more clarity on whether weaker demand is nearing a bottom or if are headed for a quiet Q4.
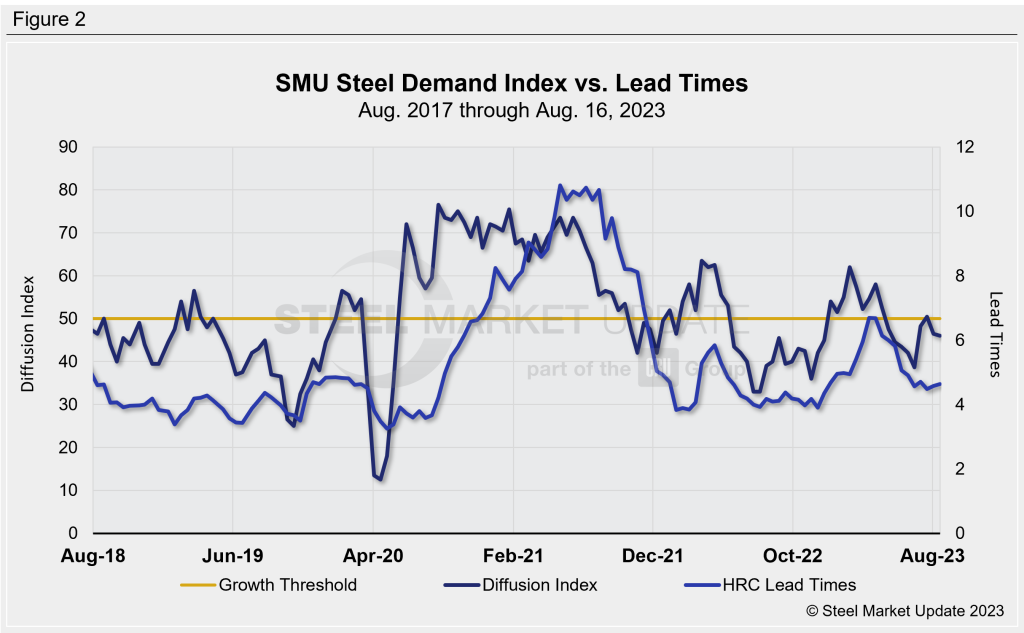
SMU’s demand diffusion index has, for nearly a decade, preceded moves in steel mill lead times. (Figure 2 shows the past five years.) Historically, SMU’s lead times have also been a leading indicator for flat-rolled steel prices, particularly HRC prices. (Figure 3 features the past five years.)
A positive trend to keep an eye on are lead times. The latest results seem to indicate a holding pattern after a bit a drop in mid-July. Lead times are roughly sideways but edging up, according to our latest check of the market. And mostly sideways scrap prices in August were also of note after repeated declines in prior months.
Our hot-rolled lead times average approximately 4.64 weeks, up marginally from 4.58 weeks in early August. They remain far from a recent high of 6.69 weeks in mid-March. Lead times have been hovering around the 4.5-week mark since roughly mid-June.
Note: Demand, lead times and prices are based on the average data from manufacturers and steel service centers who participate in SMU market trends analysis surveys. Our demand and lead times do not predict prices but are leading indicators of overall market dynamics and potential pricing dynamics. Look to your mill rep for actual lead times and prices.


