Market Data
February 2, 2024
SMU survey: Current Buyers' Sentiment dips, Future Sentiment level
Written by Ethan Bernard
SMU’s Current Steel Buyers’ Sentiment Index edged down this week, while the Future Sentiment Index remained flat, according to our most recent survey data.
Every other week, we poll steel buyers about sentiment. The indices measure how steel buyers feel about their companies’ chances of success in the current market as well as three to six months down the road. (We have historical data dating to 2008. You can find that here.)
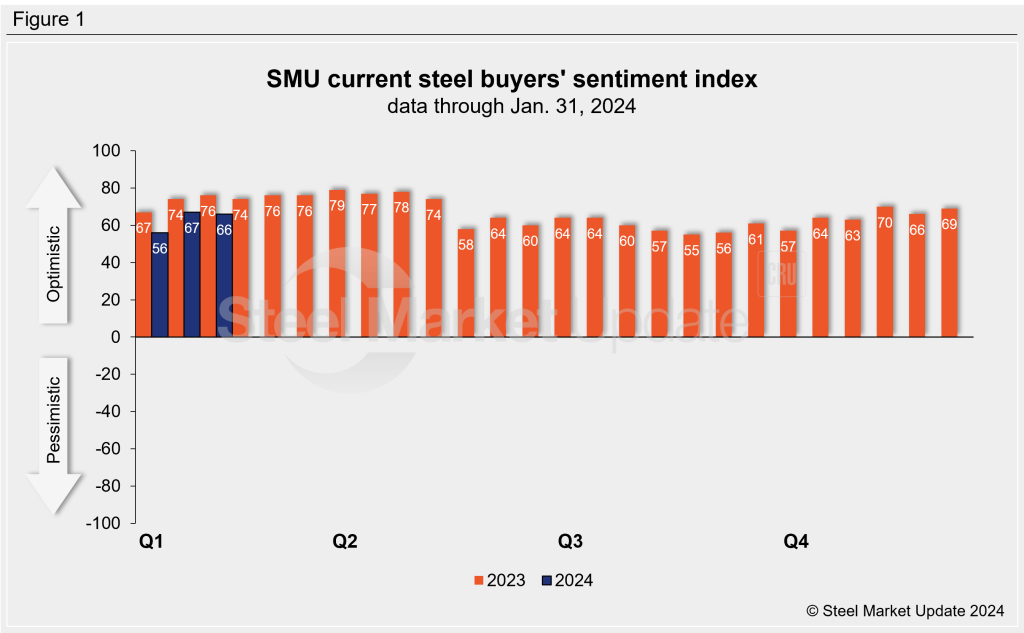
SMU’s Current Buyers’ Sentiment Index stood at +66 this week, off one point from +67 two weeks earlier (Figure 1). The data suggest the 11-point jump in sentiment noted in our previous survey has leveled off.
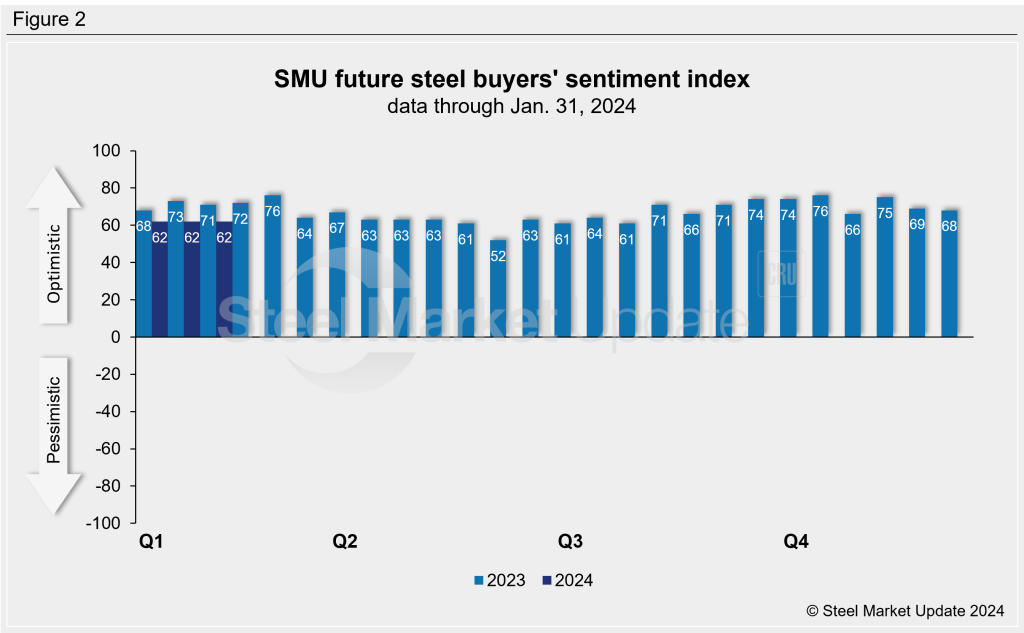
SMU’s Future Buyers’ Sentiment Index measures buyers’ feelings about business conditions three to six months in the future. This week, the index remained flat at +62 (Figure 2), where it has been for the previous two surveys. It has not touched +70 since the end of November.
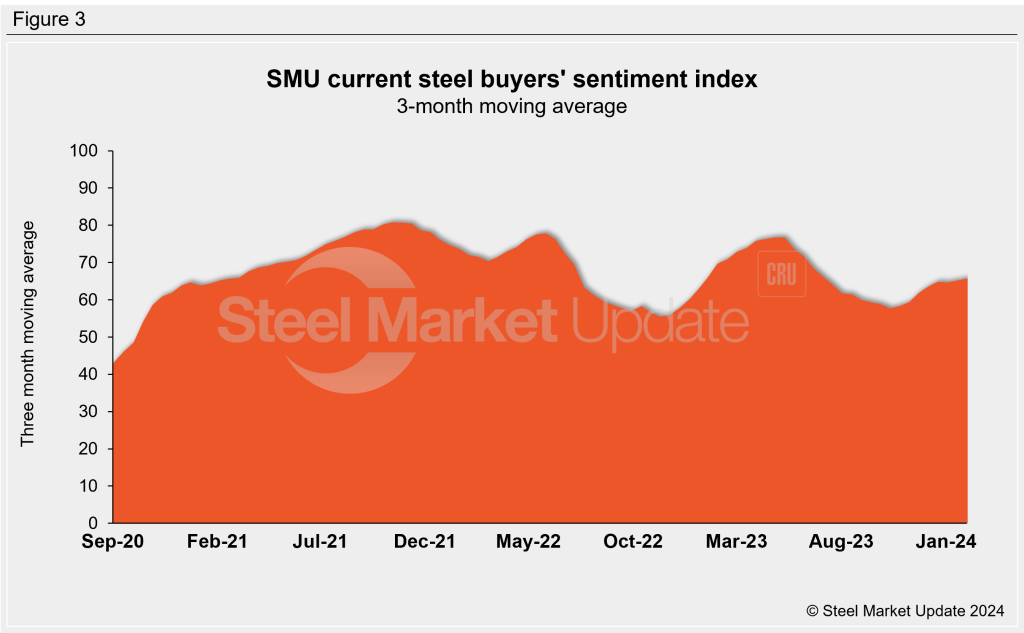
Measured as a three-month moving average, the Current Sentiment 3MMA inched up to +65.67 from +65.17 two weeks earlier. (Figure 3).
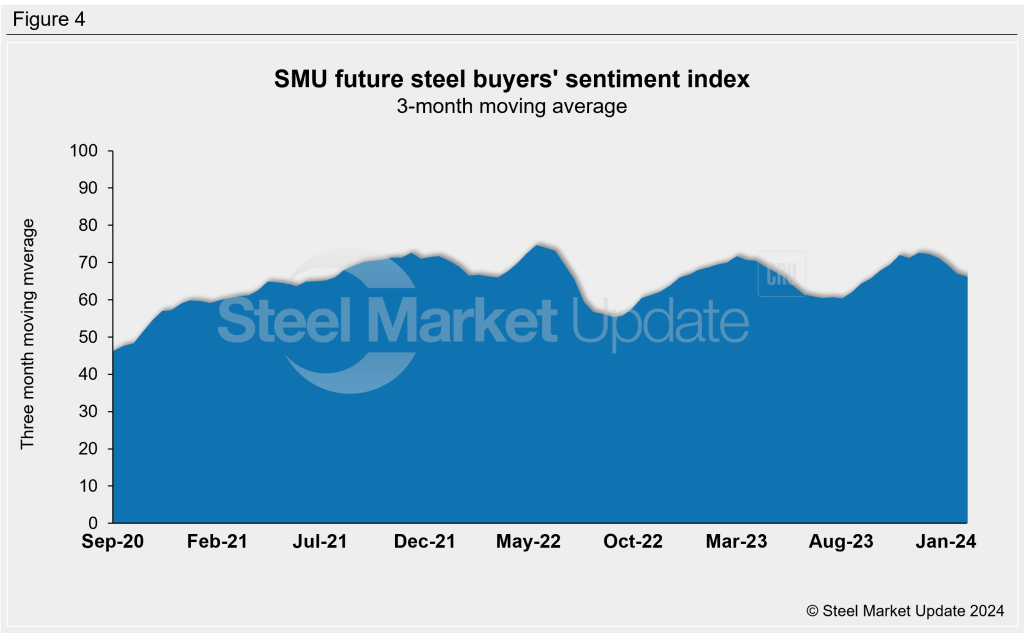
This week’s Future Sentiment 3MMA dropped to +66.33 vs. +67.00 at the previous market check (Figure 4).
What SMU respondents had to say:
“As an OEM consuming mostly carbon products, we love seeing the indices dip back below $1,000/ton.”
“We believe it is a complicated year; there is not enough demand.”
“Our value streams are a combination of manufacturing, fabrication, and distribution, so we’re seeing a nice profitable mix currently.”
“Demand hasn’t changed much since October.”
“Good sales on the contract side of business, slow on spot side.”
About the SMU Steel Buyers’ Sentiment Index
The SMU Steel Buyers Sentiment Index measures the attitude of buyers and sellers of flat-rolled steel products in North America. It is a proprietary product developed by Steel Market Update for the North American steel industry. Tracking steel buyers’ sentiment is helpful in predicting their future behavior.
Positive readings run from +10 to +100. A positive reading means the meter on the right-hand side of our home page will fall in the green area, indicating optimistic sentiment. Negative readings run from -10 to -100. They result in the meter on our homepage trending into the red, indicating pessimistic sentiment. A reading of “0” (+/- 10) indicates a neutral sentiment (or slightly optimistic or pessimistic), which is most likely an indicator of a shift occurring in the marketplace. Sentiment is measured twice per month via SMU surveys. If you would like to participate in our survey, please contact us at info@steelmarketupdate.com.