

Prices

April 18, 2024
HRC futures: Consolidation ahead of a big move?
Written by Dave Feldstein
It has been a crazy 2024 so far for hot-rolled coil (HRC) futures!!!
“It’s not crazy, it’s hot rolled.”
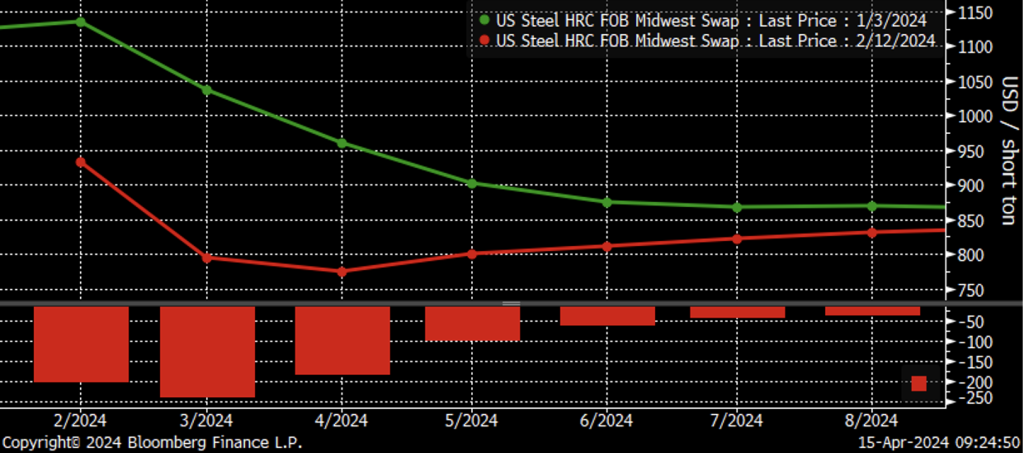
This chart shows the steeply backwardated Midwest HRC futures curve on Jan. 3 plummeting between $186 to $241 in the front three months, evolving into the curve six weeks later on Feb. 12.
CME hot-rolled coil futures curve $/st
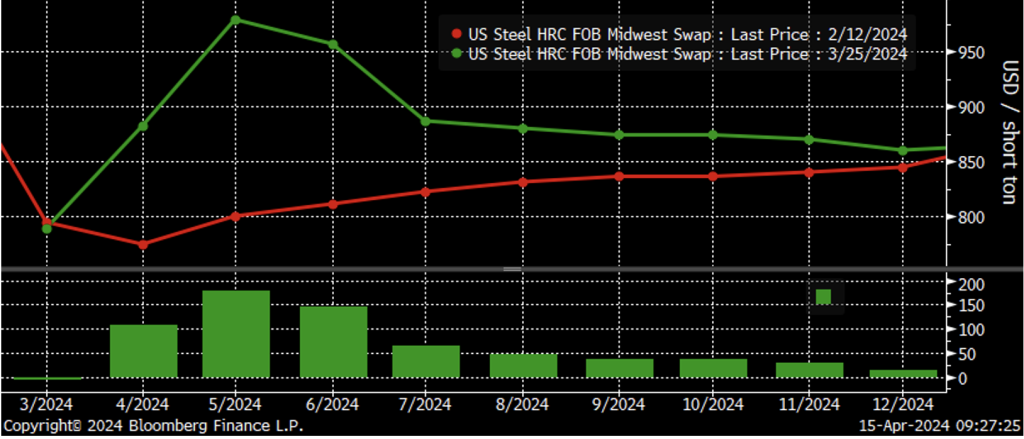
Six weeks after that, from Feb. 12 to March 25, the April, May, and June futures rocketed higher to the tune of $108, $179 and $145, respectively.
CME hot-rolled coil futures curve $/st
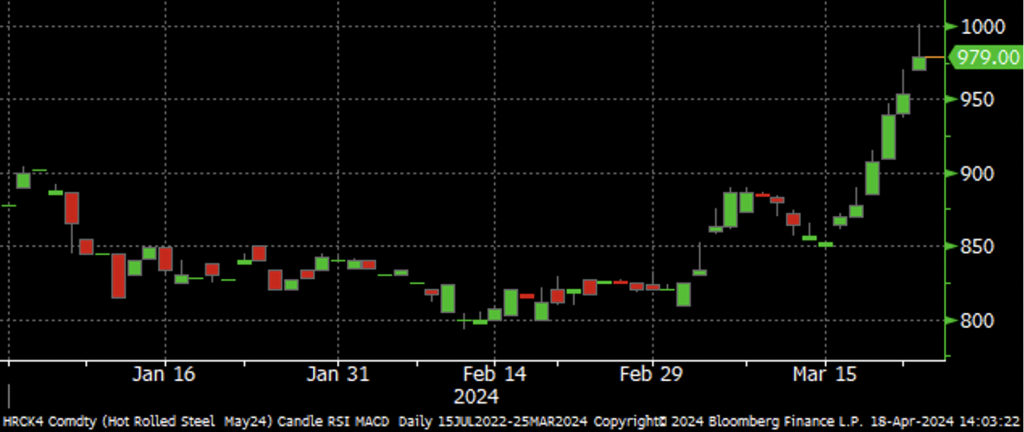
March 25 was the peak for the most recent breakneck rally with the May future ticking $1,001 intraday before settling at $979. I had a strong intuition March 25 was going to be a wild day and most likely the top for the most recent rally. How arrogant of me to say such a thing? How could I possibly know? Was it fundamental analysis or technical analysis? Did I have some kind of inside scoop or was I using a mathematical theorem or a scientific law?
May CME hot-rolled coil future $/st
Fundamentals, no. Technicals, no. Mathematical theorem, no. Scientific law, definitely no. Murphy’s law, YES! You see, I had tickets to take my kid to Disney World on March 25 and since it was the first weeks-long vacation taken since starting Rock Trading Advisors in 2019, of course March 25 would be a doozy of a day. In fact, here I am trading HRC futures on “It’s a Small World.”

More like “It’s a Small Rally.” Two weeks later, all of the March rally was erased in every month except April and May, with May completing its roundtrip this week. Based on my count, the entire roundtrip from $820 to $1,001 and back to $820 took 24 trading days.
May CME hot-rolled coil future $/st
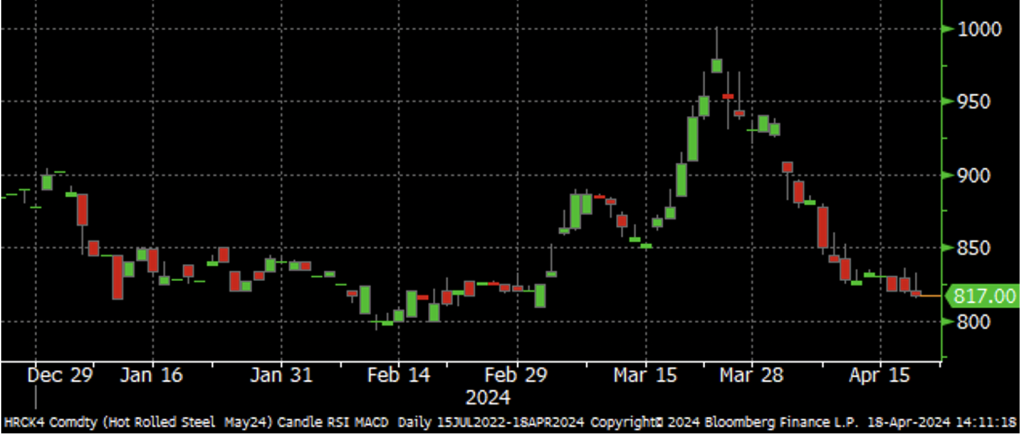
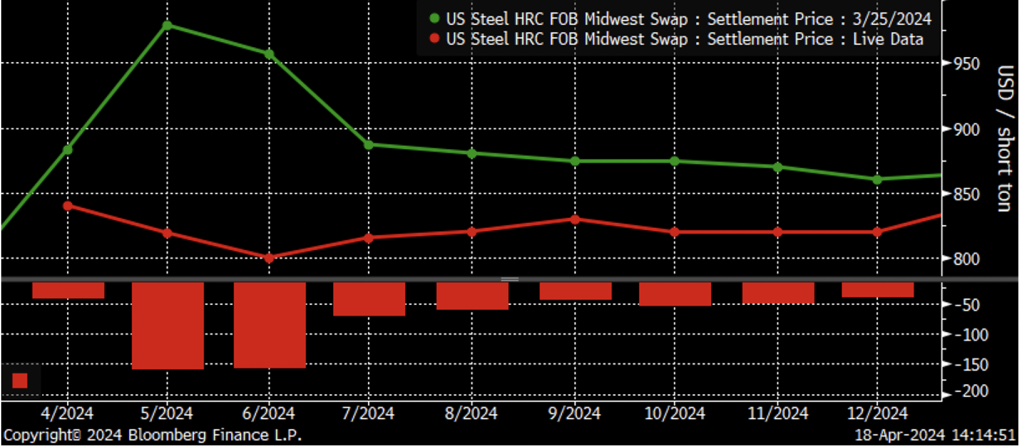
Since March 25, the Midwest HRC futures curve has flipped from steeply backwardated to flat, with declines of roughly $160 in both the May and June futures.
CME hot-rolled coil futures curve $/st
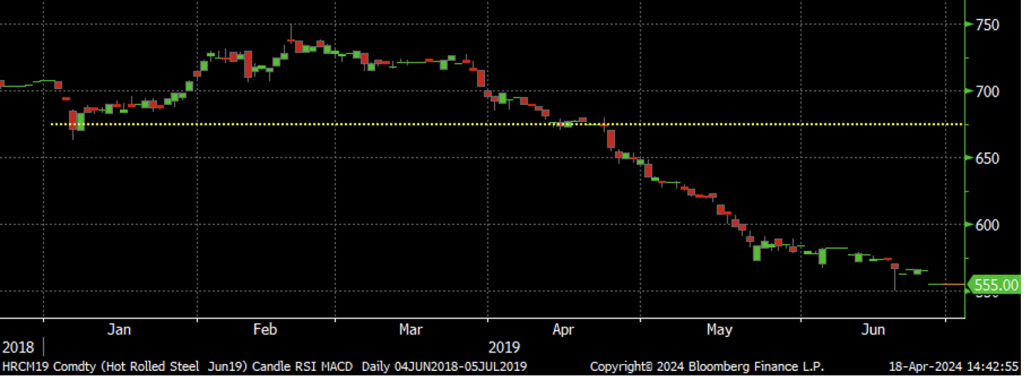
Speaking of intuition (I was completely kidding above, by the way), the current market reminds me a lot of the futures market from this time five years ago. The spring of 2019 is a time I remember vividly. The futures caught a little bid in late January of that year. Then Nucor announced a price increase in mid-February. The futures market reacted to the announcement by bidding up the futures and for a couple of days traded above $740 to as high as $750.
The market then receded to $720-725 where it sat in a tight range for about two weeks. Then the market fell below $700 in the final days of March. In early April 2019, I wrote a futures article for SMU discussing the importance of the $675-685 support level (indicated by the dotted yellow line). I pointed out that if HRC futures break below this support level, look out below. Indeed, futures did fail to find support there. The June future broke quickly to $650 on its way to $625 to eventually settle at $555. Five years have flown by (sort of), and here we are once again. It’s early April with a similar set-up in the June 2024 future.
June 2019 CME hot-rolled coil future $/st
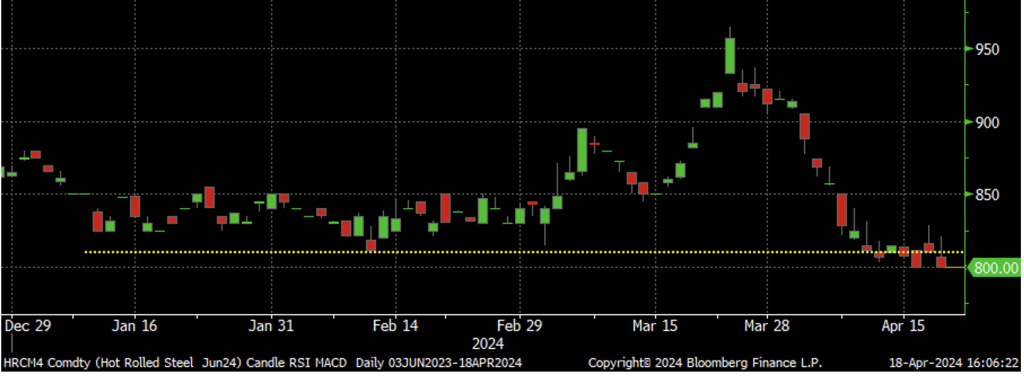
First, a quick recap. The June future started its most recent rally in March, gained steam throughout March, shot higher (on anticipation of a price increase), peaked on an upside blow-off reversal day on March 25 (it’s a small world), held near the highs for five more trading sessions, before correcting sharply lower to complete its roundtrip back to where it started.
After completing its round trip in April 2019, the June 2019 future traded sideways, holding right at its $675 support level. The June 2024 future is currently trading sideways and sitting at its support level in the $800-810 area.
June 2024 CME hot-rolled coil future $/st
Support levels provide traders with a line of demarcation. A solid support level indicates a big move is about to come. If the support level holds, the market can bounce aggressively higher off the support. Think of it like a trampoline. However, if the security breaks below its support level, as HRC did in 2019, then look out below. When support doesn’t hold, a vacuum occurs as the buyers sitting just above the support level bail. And then the price has to discount sharply in order to entice new buyers to step in and take the risk they are catching as the proverbial falling knife.
Disclaimer: The content of this article is for informational purposes only. The views in this article do not represent financial services or advice. Any opinion expressed by Mr. Feldstein should not be treated as a specific inducement to make a particular investment or follow a particular strategy, but only as an expression of his opinion. Views and forecasts expressed are as of date indicated, are subject to change without notice, may not come to be and do not represent a recommendation or offer of any particular security, strategy or investment. Strategies mentioned may not be suitable for you. You must make an independent decision regarding investments or strategies mentioned in this article. It is recommended you consider your own particular circumstances and seek the advice from a financial professional before taking action in financial markets.


