

Prices

May 22, 2025
HR Futures: Curve lower on weak 'soft' data. Will 'hard' data ride to the rescue?
Written by David Feldstein
David Feldstein is the president of Rock Trading Advisors. Rock Trading Advisors is a National Futures Association Member Commodity Trade Advisory. It provides commercial clients with price risk solutions in ferrous, energy, and interest rate derivatives markets.
After ripping higher following President Trump’s announcement of 25% tariffs on steel imports, Midwest HRC futures went on another round-trip. They ended March not far from where they started in early February.
Then, during the week of April 7, HR futures found a support level to bounce off. The May future found support in the $820-$825 area while the June and July future found support around $775-$780.
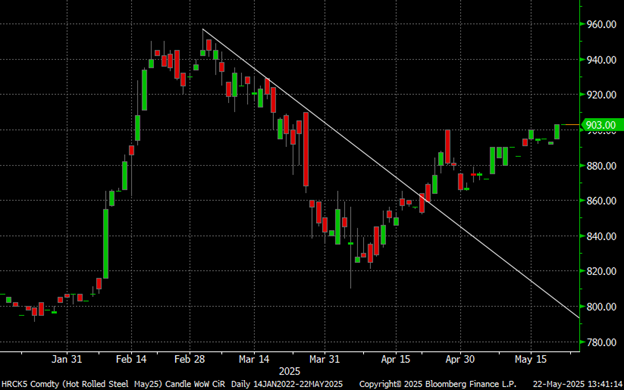
Then the May future started to rally, first breaking above its downtrend and then trading above $900 as the CRU Midwest HRC Index has remained buoyed above $900 – until just falling below it to $898 this week. But it’s been a different story for the other futures.
May CME Hot Rolled Coil Future $/st
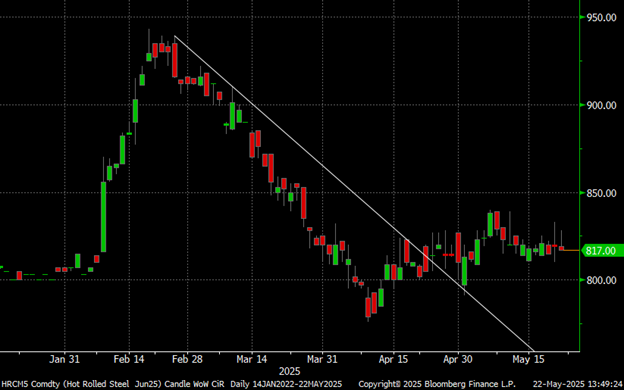
Instead of following May, the June future has been trading sideways after breaking through its downtrend. With its first print a week from next Wednesday, the June future currently priced at $817 is indicating a sharp decline in the price of physical Midwest HRC to something in the $750-$775 area by the end of June.
June CME Hot Rolled Coil Future $/st
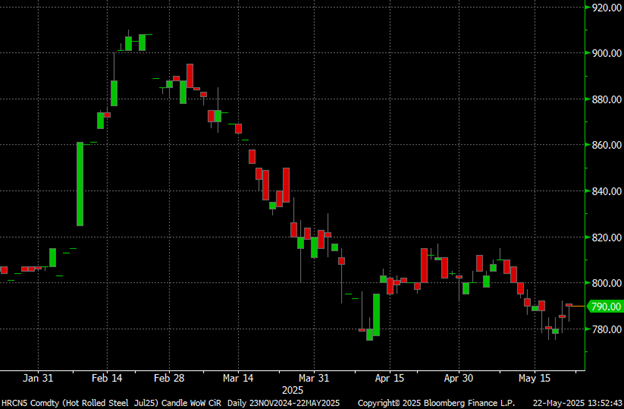
Meanwhile, the July future has not only failed to rally along with the May future but has also declined back to the $775-$780 level where it found support in early April. For the moment, the July future has formed a nice double bottom once again finding support at the $775-$780 level.
July CME Hot Rolled Coil Future $/st
Since peaking on March 5, the futures months of June, July, and August have been hammered – falling $88, $100, and $87, respectively.
CME Hot Rolled Coil Futures Curve $/st
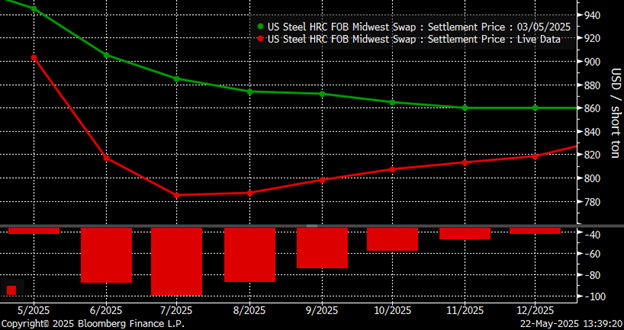
In fact, the futures curve is flat to lower in every month after May despite the news of 25% tariffs on imported steel. Perhaps that might seem puzzling.
CME Hot Rolled Coil Futures Curve $/st
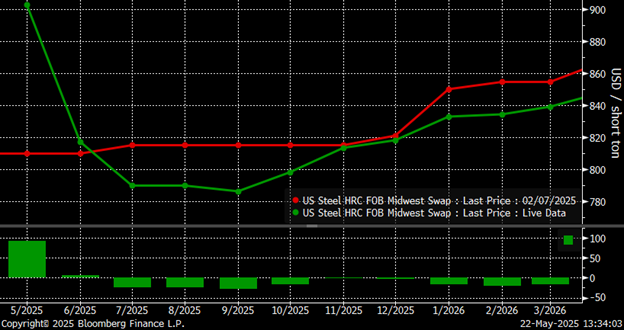
The best tariff-adjusted import deal I have seen is around $750. Given that information, it is not surprising the June and July futures found support in the $775-$780 area. What does surprise me is that there has not been more interest from the end-user crowd to lock up fixed-priced deals using the futures.
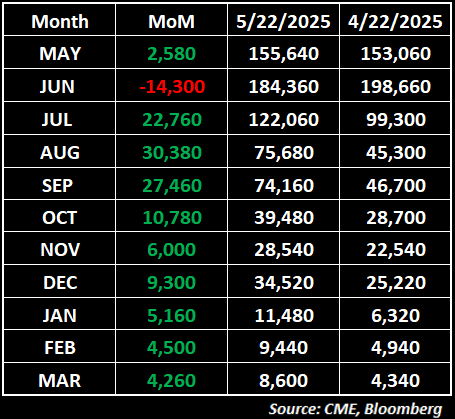
In my column for SMU last month, I showed the sharp drop in open interest (open interest is the number of outstanding futures contracts, or tons in this case, across a product’s curve) from June into July – and then into August and onward. I presented a number of explanations for why, with my favorite being the buying community has procrastinated placing orders, due to uncertainty and an overabundance of caution.
The table below has been updated, and there has been a sharp increase in the Q3 futures. But it is still not remarkable in nominal terms. Moreover, the Q3 futures have not reacted and have in fact moved lower since April 22.
CME Hot Rolled Coil Futures Curve w/ Open Interest
The battle lines are drawn. Will the HRC futures curve win the day correctly forecasting a sharp and rapid decline in the price of Midwest HRC? Or will we see physical prices hold firm with Cleveland-Cliffs throwing down the gauntlet earlier today with its $910 price announcement?
The tale of the tape is interesting. In one corner, we see weak sentiment, or soft data. For example, look at ISM Manufacturing PMI, consumer confidence readings, the Architectural Billings Index, and NAHB Home Builders Sentiment Index. Meanwhile, Steel Market Update’s steel mill negotiations and future sentiment index are flashing red. Does that indicate a dreadful recession ahead?
In the other corner, we see solid to strong hard data readings, such as March and April’s auto sales. March’s US construction spending is up 2.8% YoY. And March’s 724k new home sales SAAR are up 7.4% YoY. Also, the unemployment rate in April was at 4.2%. Meanwhile, we’ve got tight service center inventory coupled with extremely low April flat-rolled imports. Case in point: HRC sheet imports of ~87k tons are at their lowest for any month since June 2009.
Will the weak sentiment and the HR futures curve prove to be prescient? Or will the hard data prove to be the more reliable indicator? Hard versus soft? Data versus gut? Leading versus following? Supply versus demand? Which way will the herd move? Who will win the fight?
Disclaimer
The content of this article is for informational purposes only. The views in this article do not represent financial services or advice. Any opinion expressed by Mr. Feldstein should not be treated as a specific inducement to make a particular investment or follow a particular strategy, but only as an expression of his opinion. Views and forecasts expressed are as of date indicated, are subject to change without notice, may not come to be and do not represent a recommendation or offer of any particular security, strategy or investment. Strategies mentioned may not be suitable for you. You must make an independent decision regarding investments or strategies mentioned in this article. It is recommended you consider your own particular circumstances and seek the advice from a financial professional before taking action in financial markets.


