

Prices

October 9, 2022
Final August Steel Imports Down 6%, September Down 10%
Written by Brett Linton
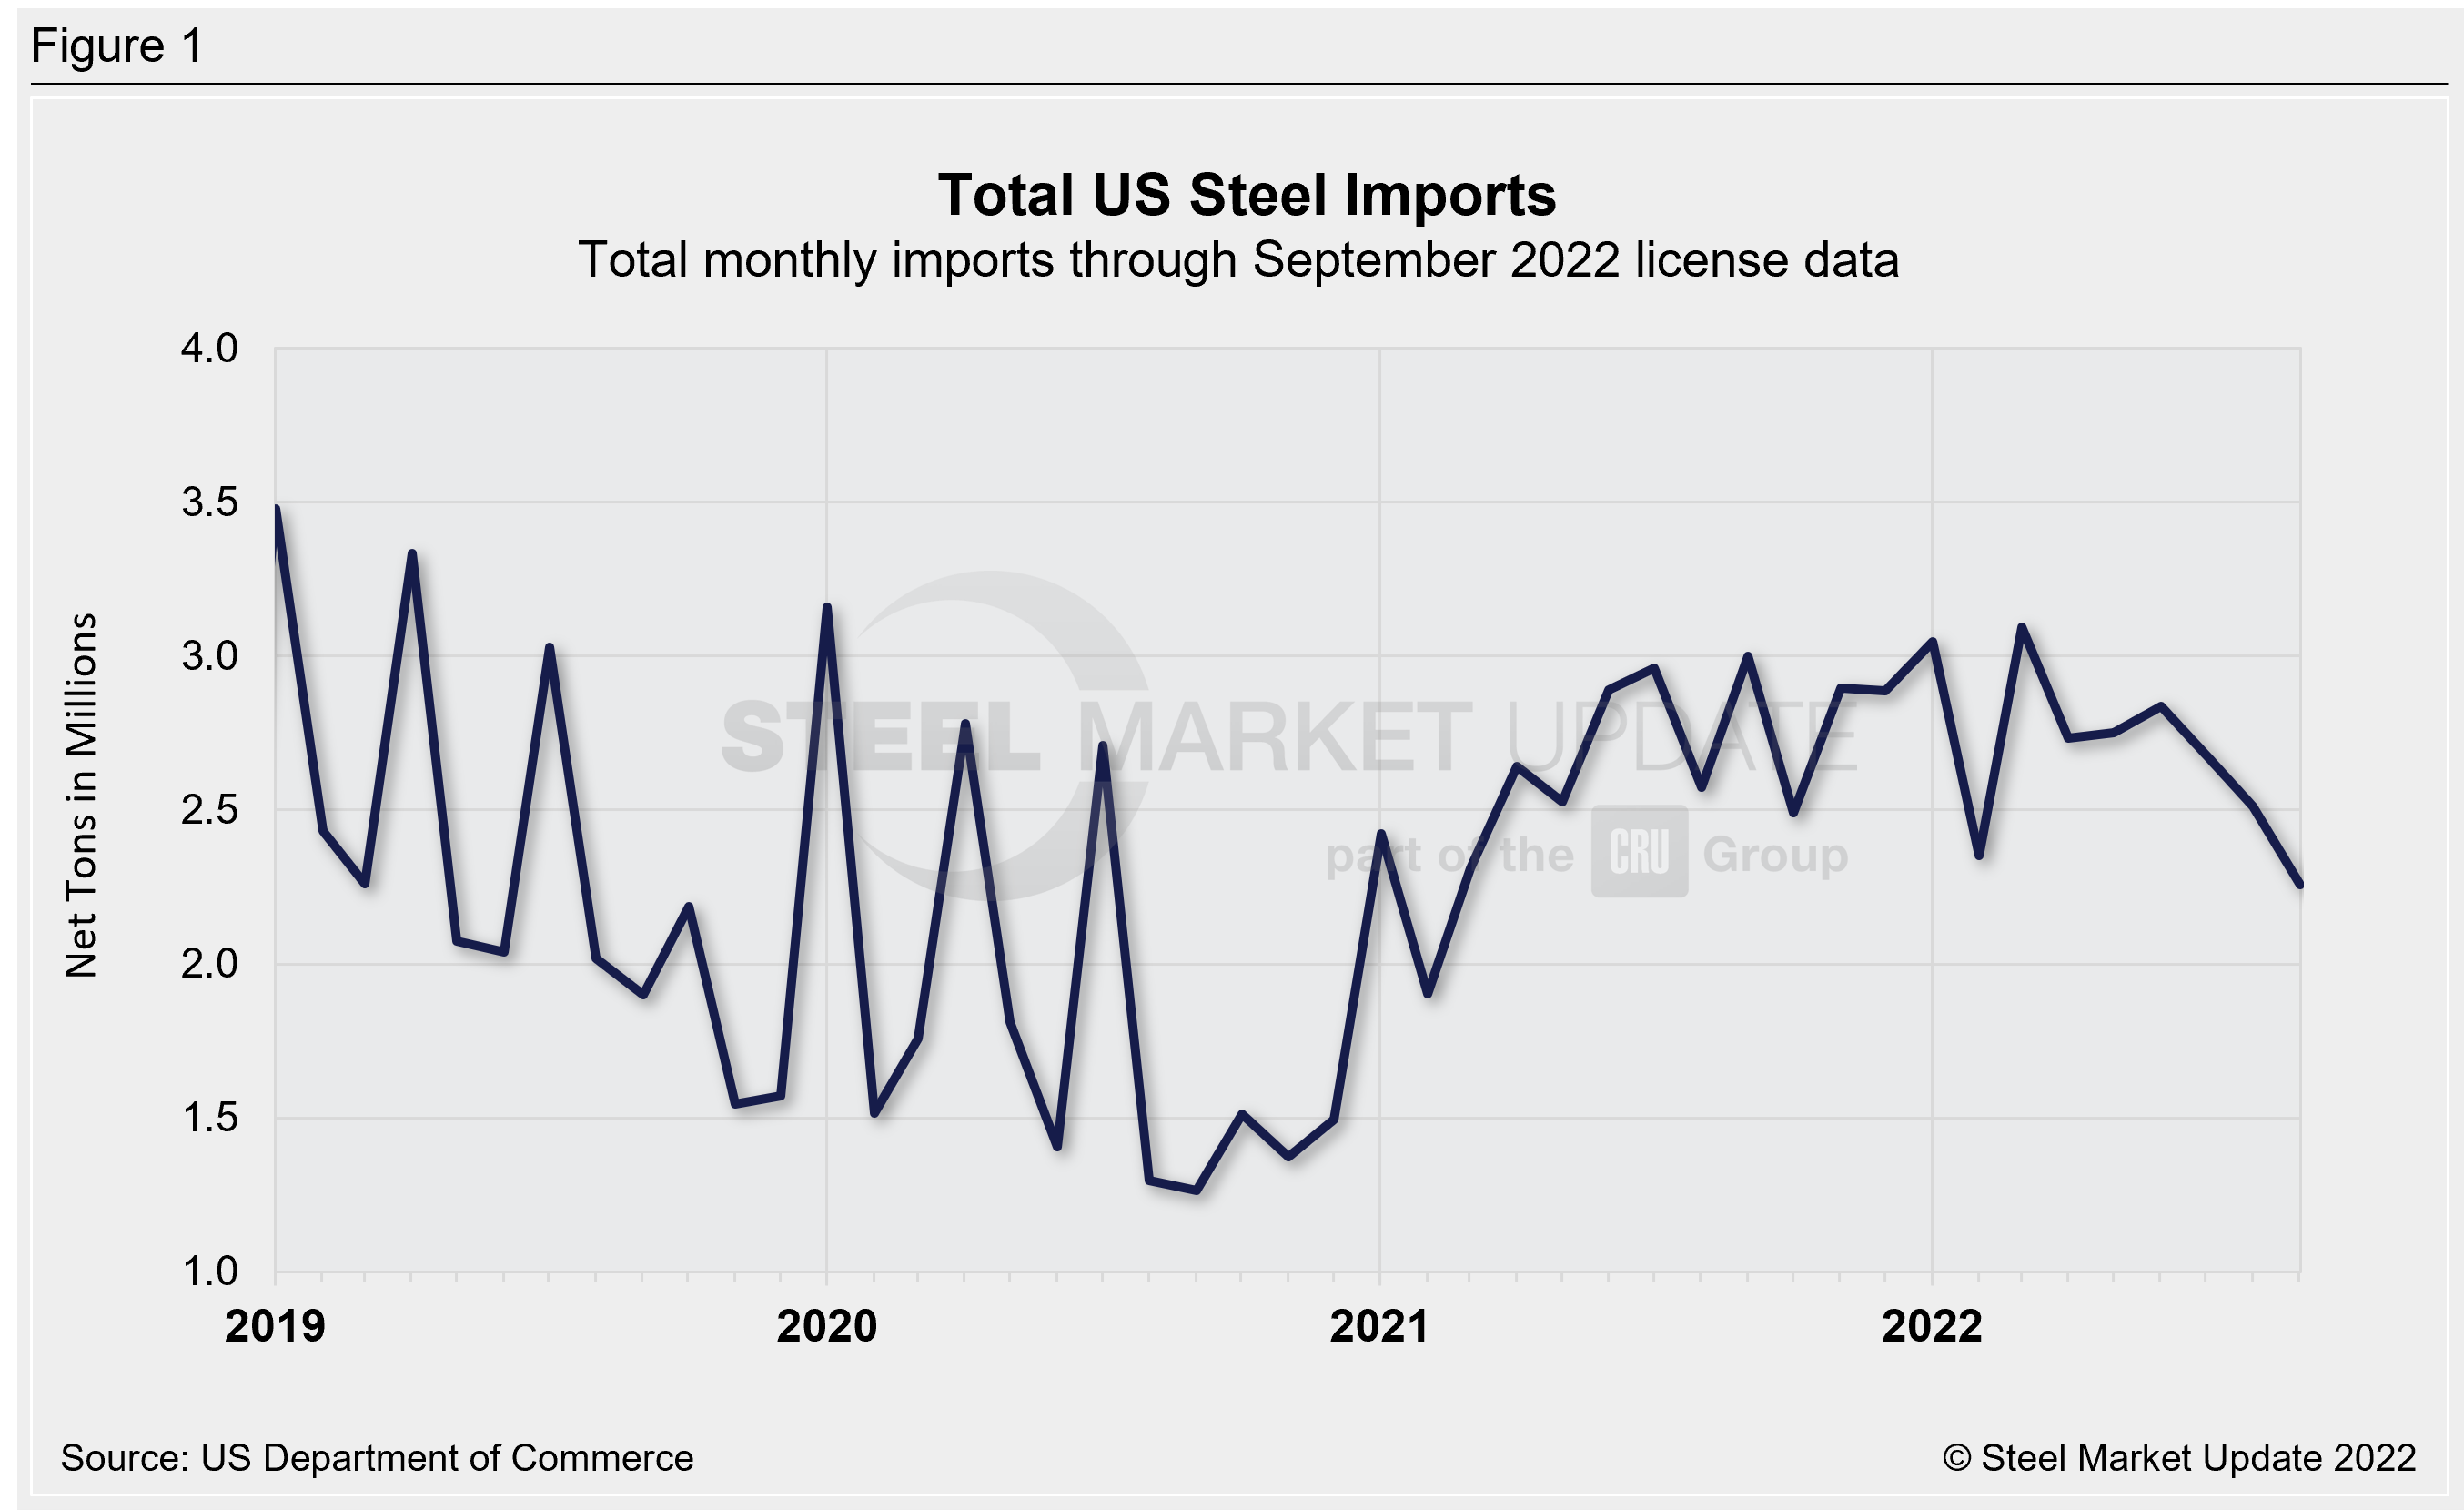
Final US Census Bureau data indicates that steel imports totaled 2.51 million net tons during the month of August, just 267 tons higher than the preliminary figures released in late September. This is down 6% from the prior month. It is also the third lowest monthly rate in the past year and a half (behind Feb. 2022 and Oct. 2021). Recall that monthly import levels also declined 6% from June to July. August figures are now down 19% compared to March’s 26-month high of 3.09 million tons.
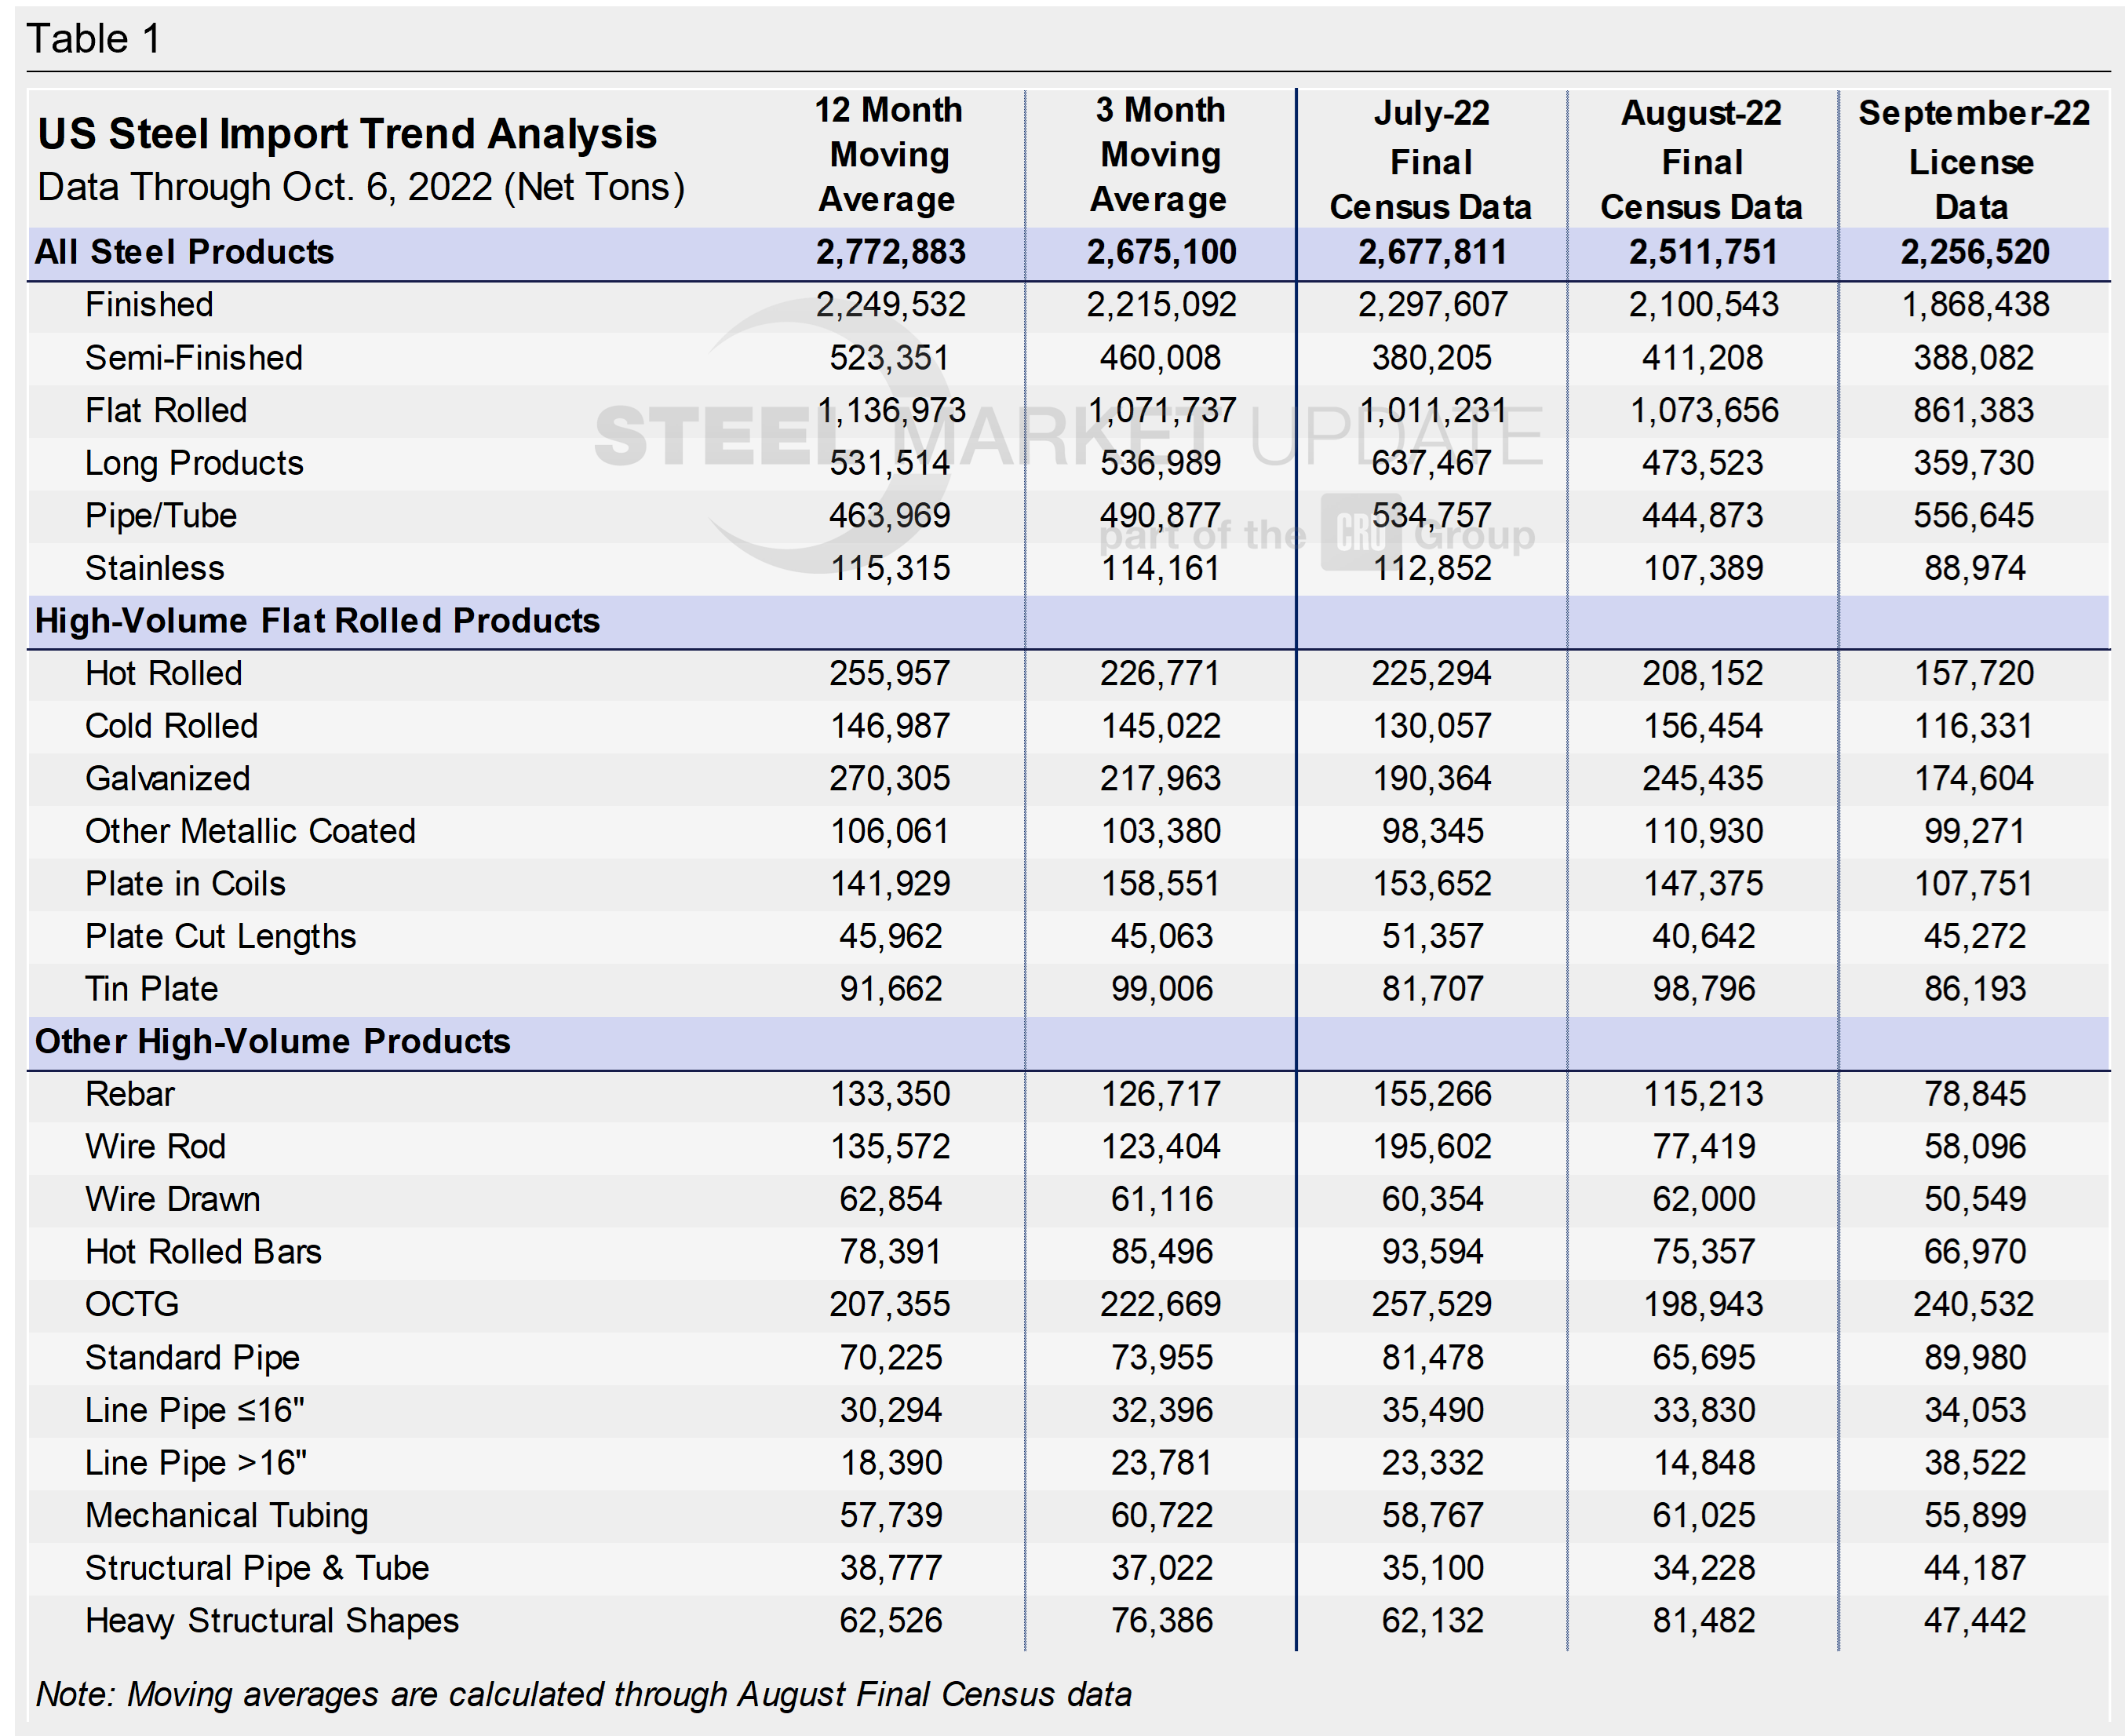
Broken down by product category, finished steel imports in August were down 9% from July, imports of semi-finished products increased 8%, flat rolled imports rose 6%, long product imports fell 26%, imports of pipe and tube declined 17%, and stainless imports eased 5%. These figures are all unchanged from preliminary figures.
Total September import licenses are currently at 2.26 million tons through Oct. 5th data, down 10% compared to August. This could potentially be the lowest monthly import level since 1.90 million tons in Feb. 2021. But the figure will probably increase as licenses continue to be collected over the next three to four weeks.
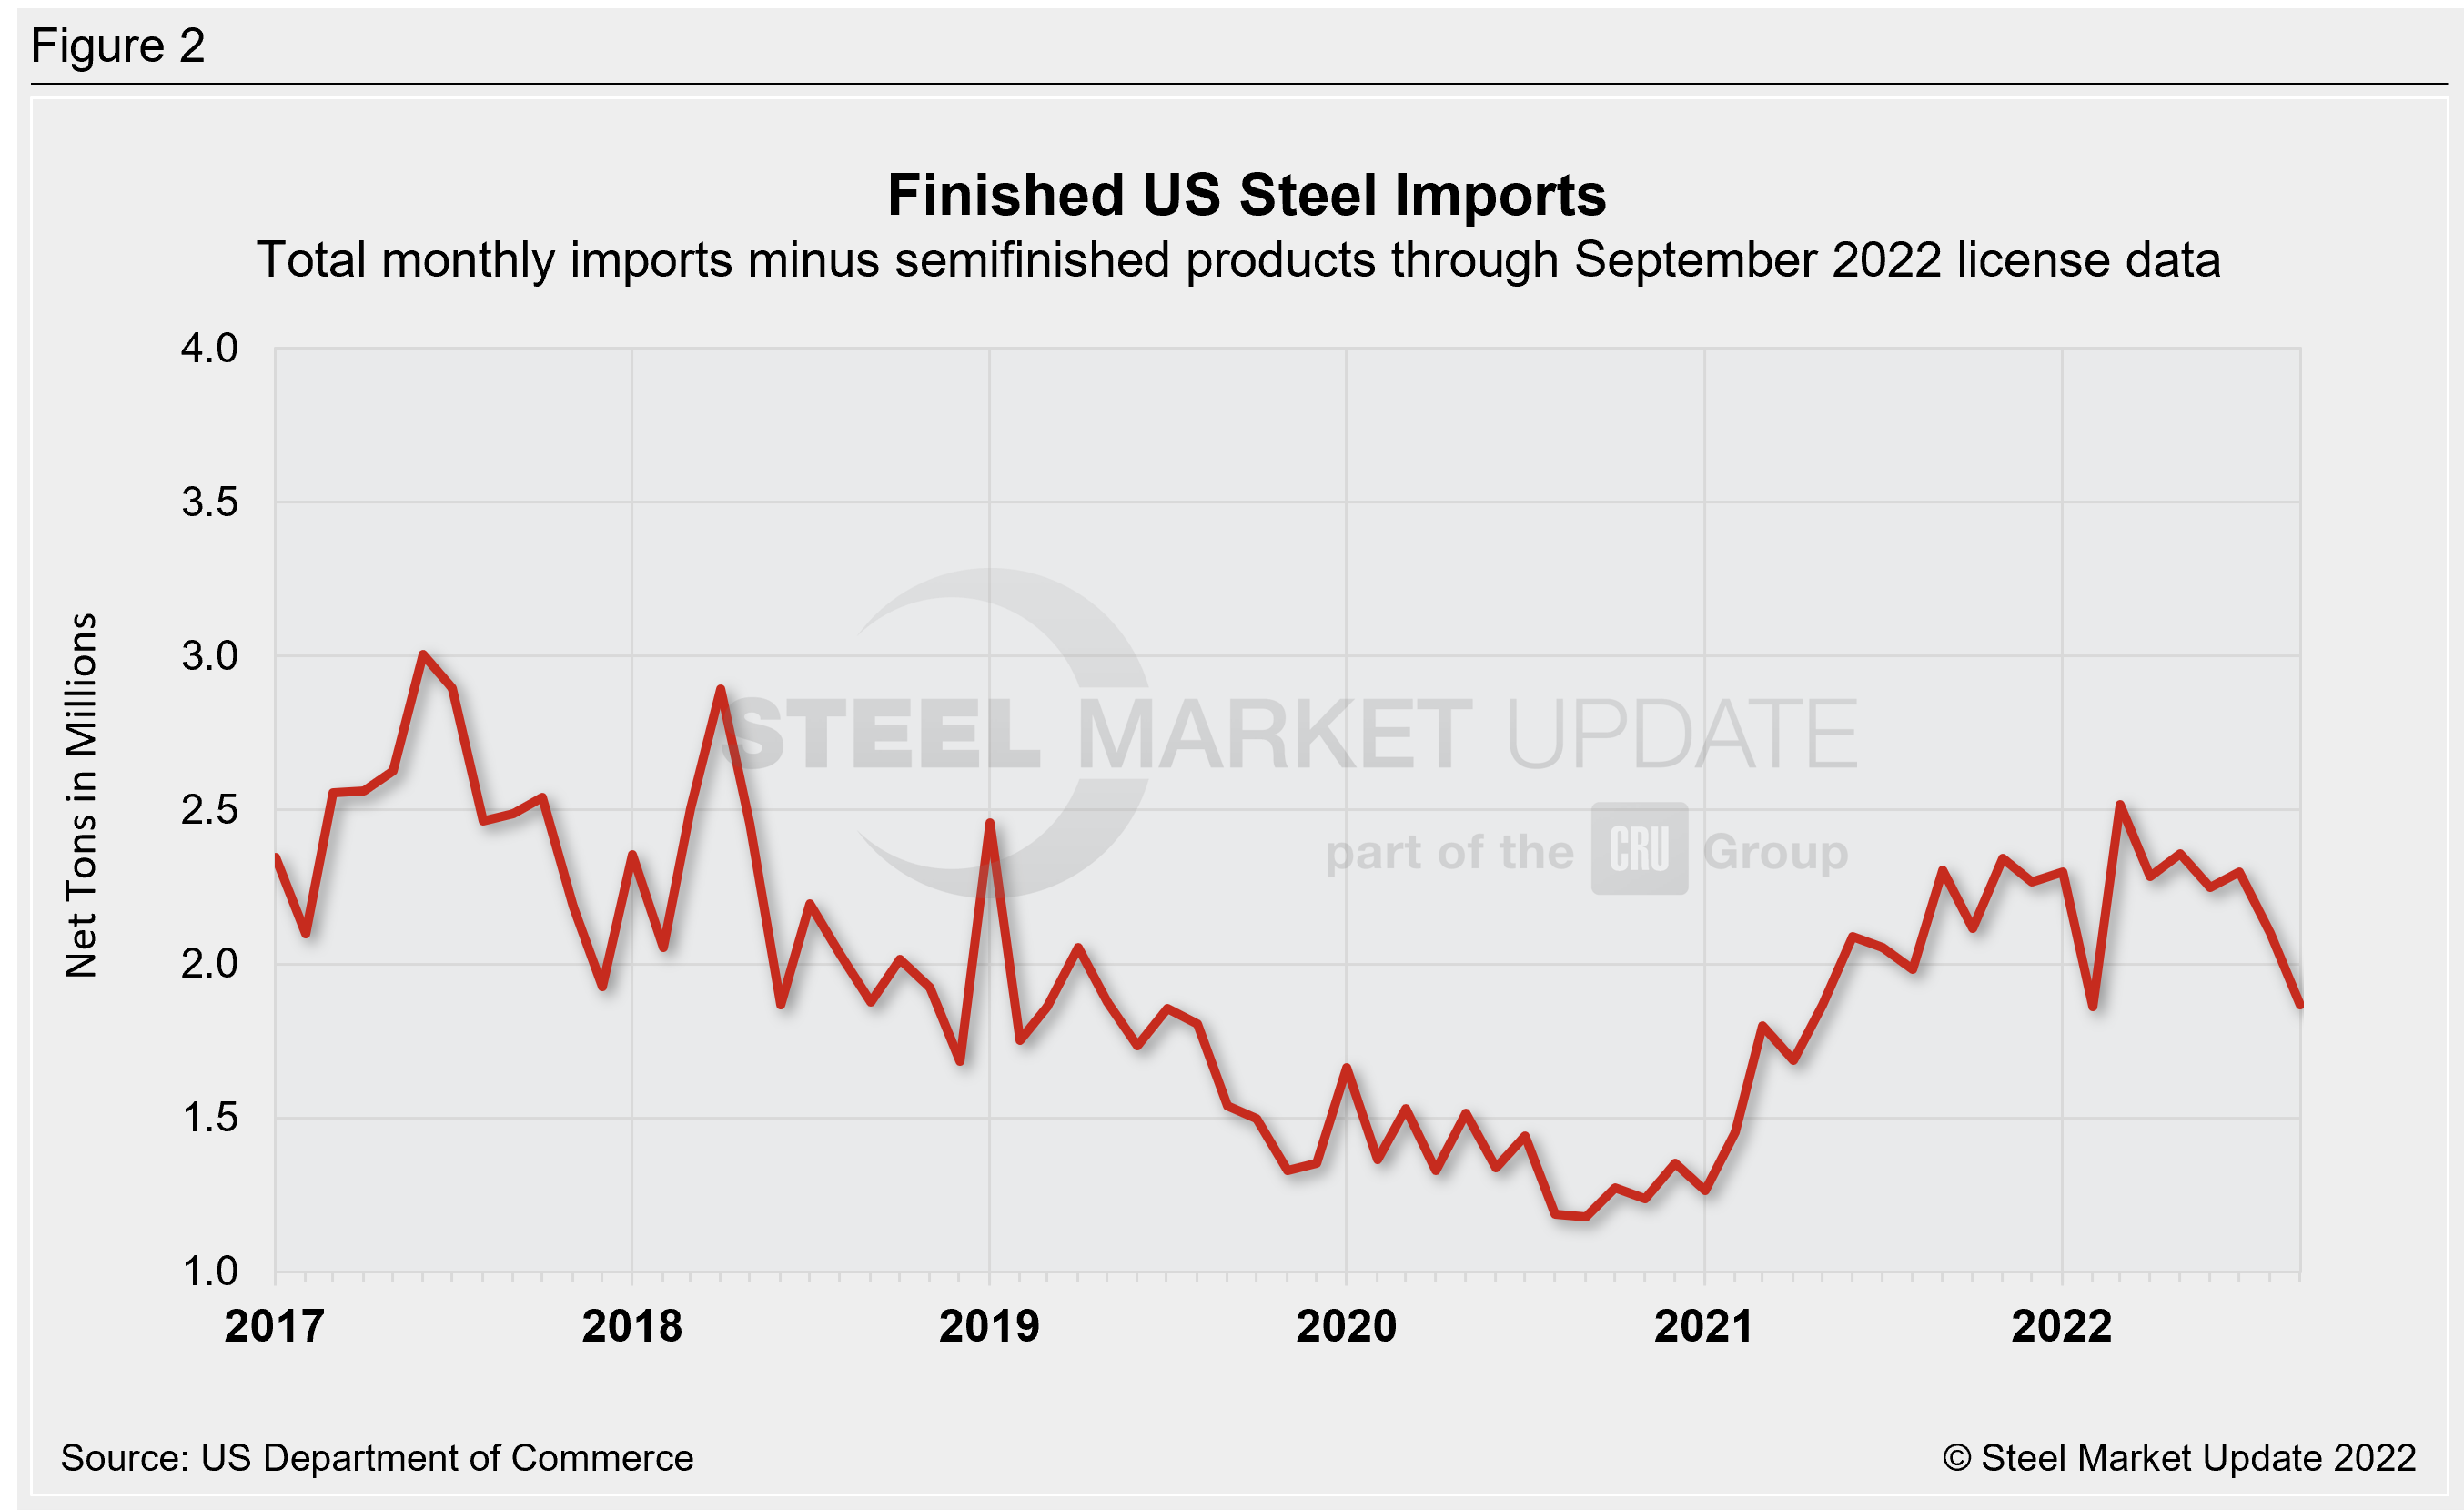
August imports of finished steels totaled 2.10 million tons, down 9% versus July and 17% less than a 46-month high in March. The latest license data shows finished steel imports down to 1.89 million tons in September, potentially the lowest level seen since February of this year.
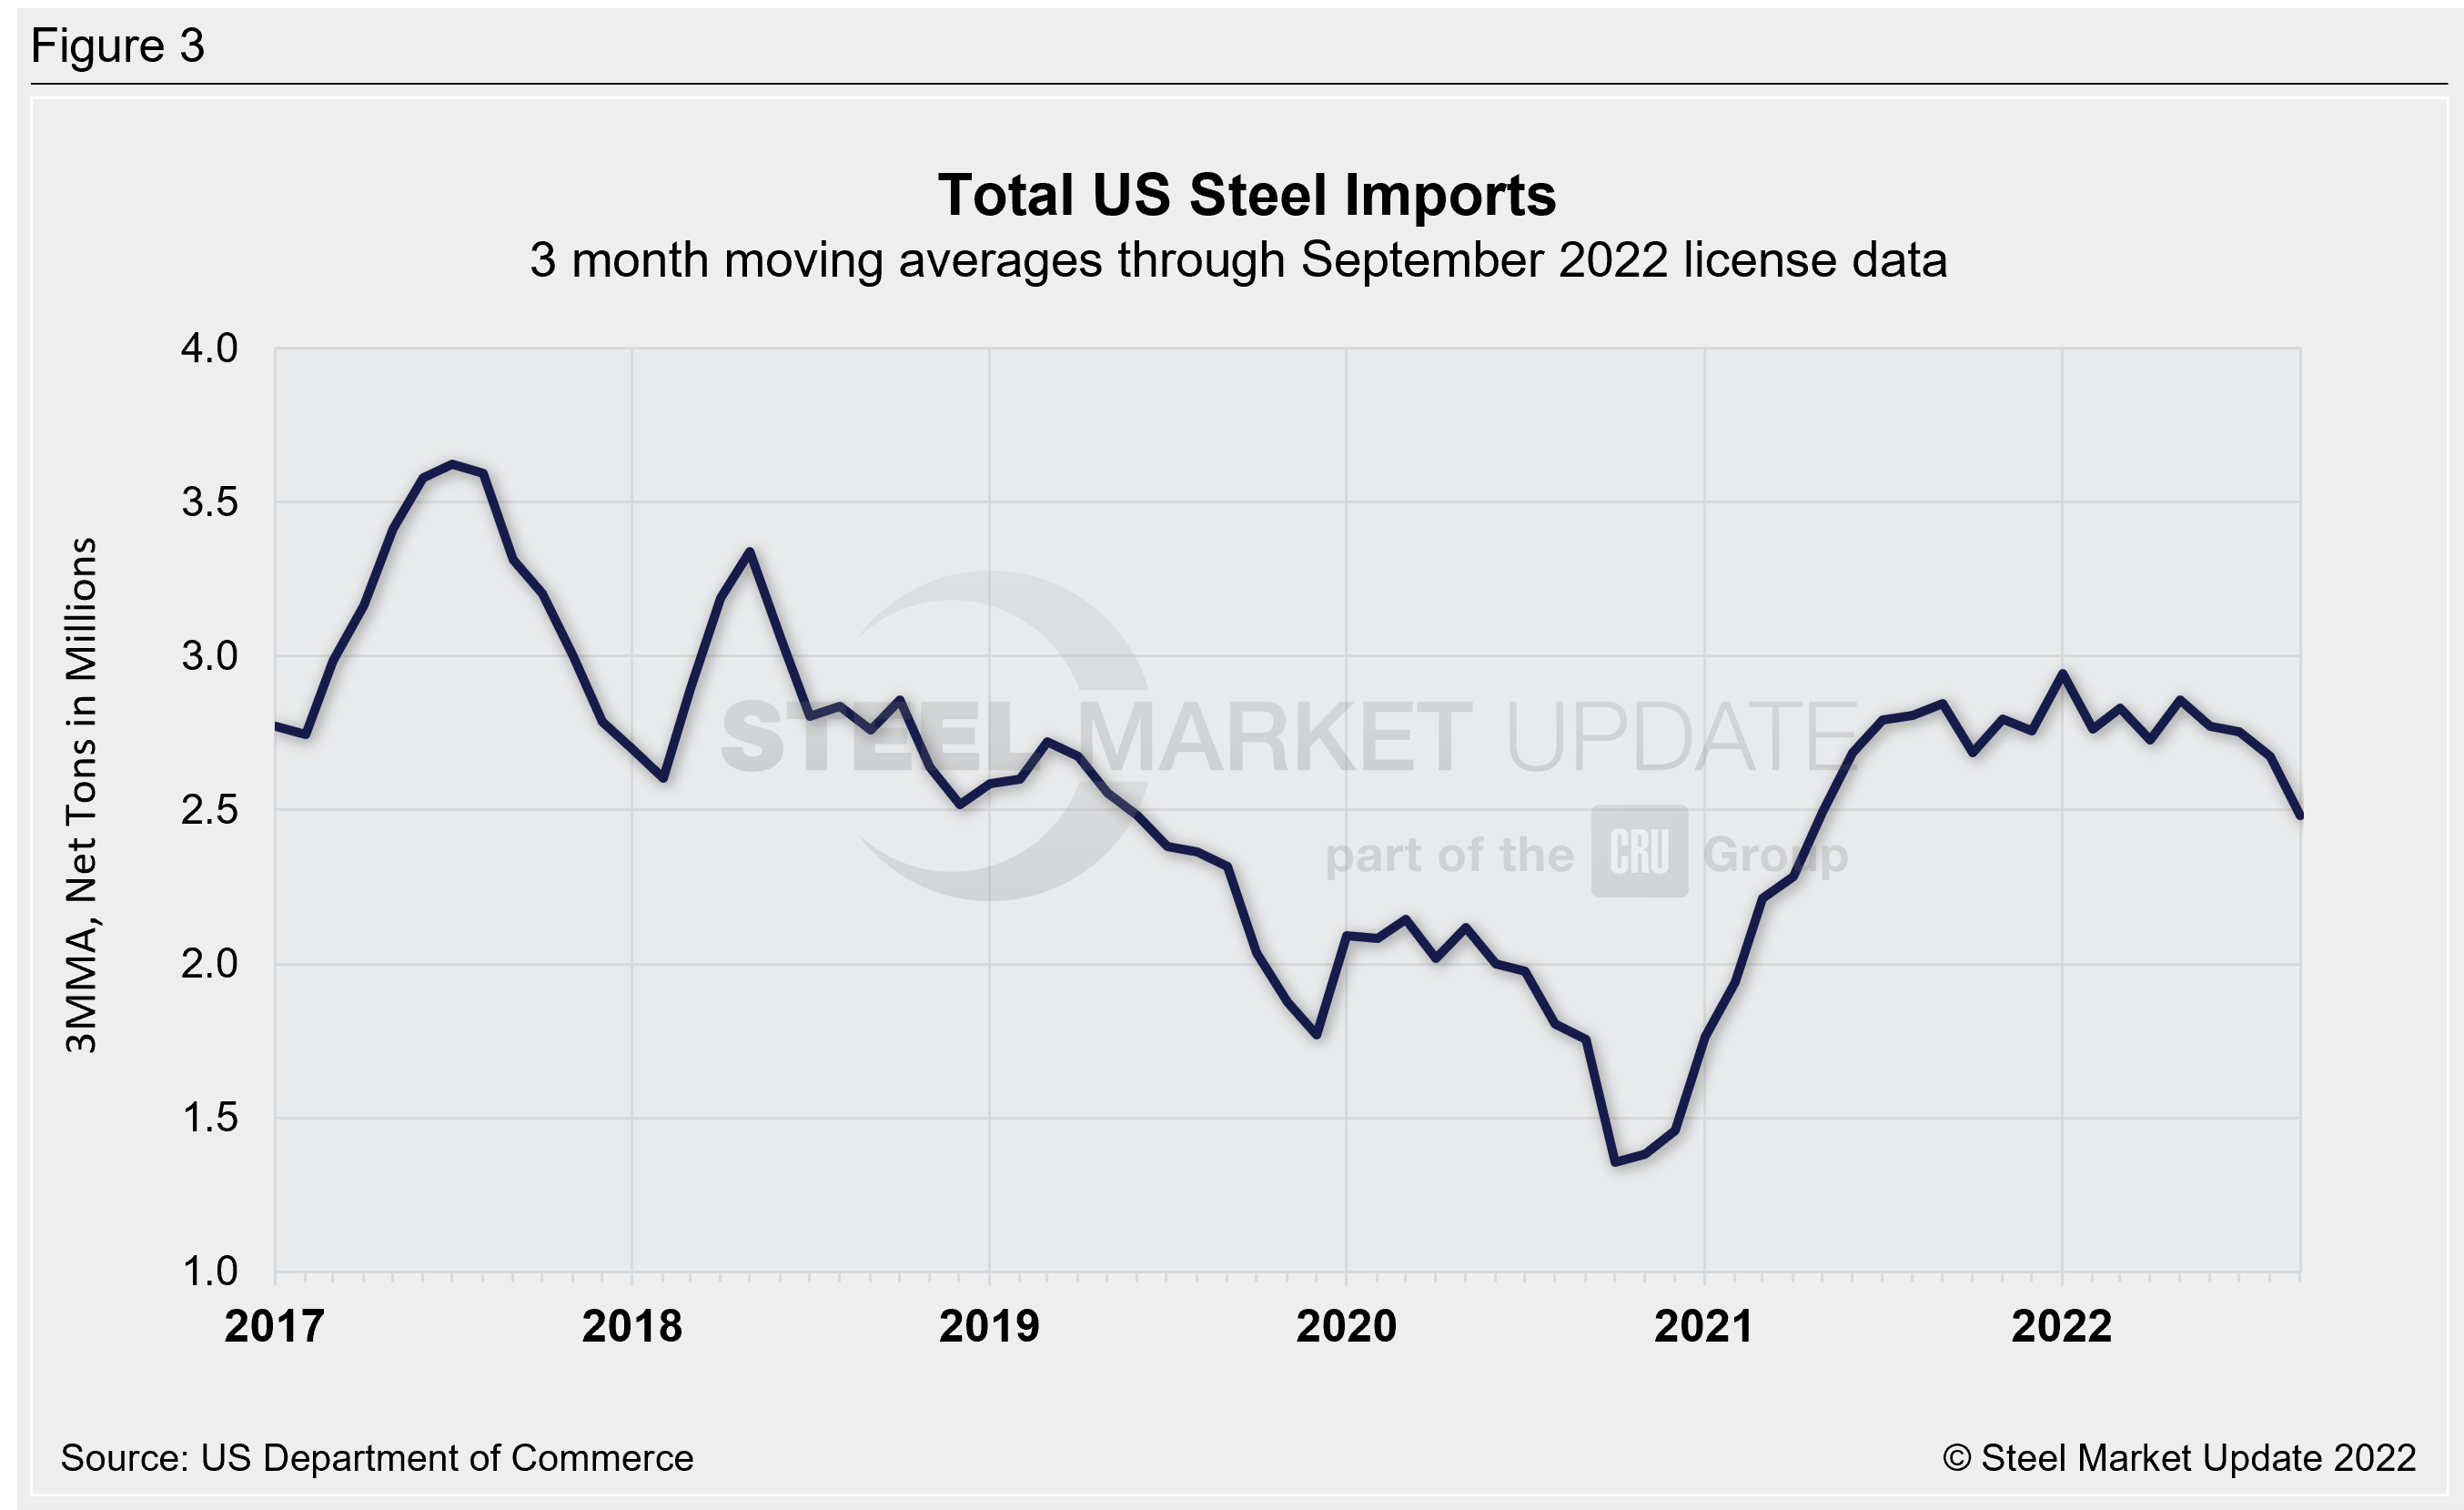
Due to large month-on-month swings in semifinished imports in recent years, the chart below shows total imports on a three-month moving average (3MMA) basis to more accurately display trends. The 3MMA is 2.68 million tons through final August data. This is down from 2.75 million tons the month prior and is now the lowest level seen since May 2021. September license data suggests that the 3MMA could decline to 2.48 million tons.
Although import levels have eased in recent months, trade remains strong compared to recent years. Recall 2021 averaged 2.63 million tons per month, 2020 averaged 1.84 million tons per month, and 2019 averaged 2.32 million tons per month. In January 2022, the 3MMA had reached a 42-month high of 2.94 million tons. The lowest 3MMA level in SMU’s recent history was 1.36 million tons in October 2020.
The table below displays flat-rolled product imports as well as other high-volume products, including rebar, tin plate, wire rod, structural pipe and tube, and other long products. We also provide data on imports divided into semifinished, finished, flat rolled, longs, pipe and tube, and stainless products.
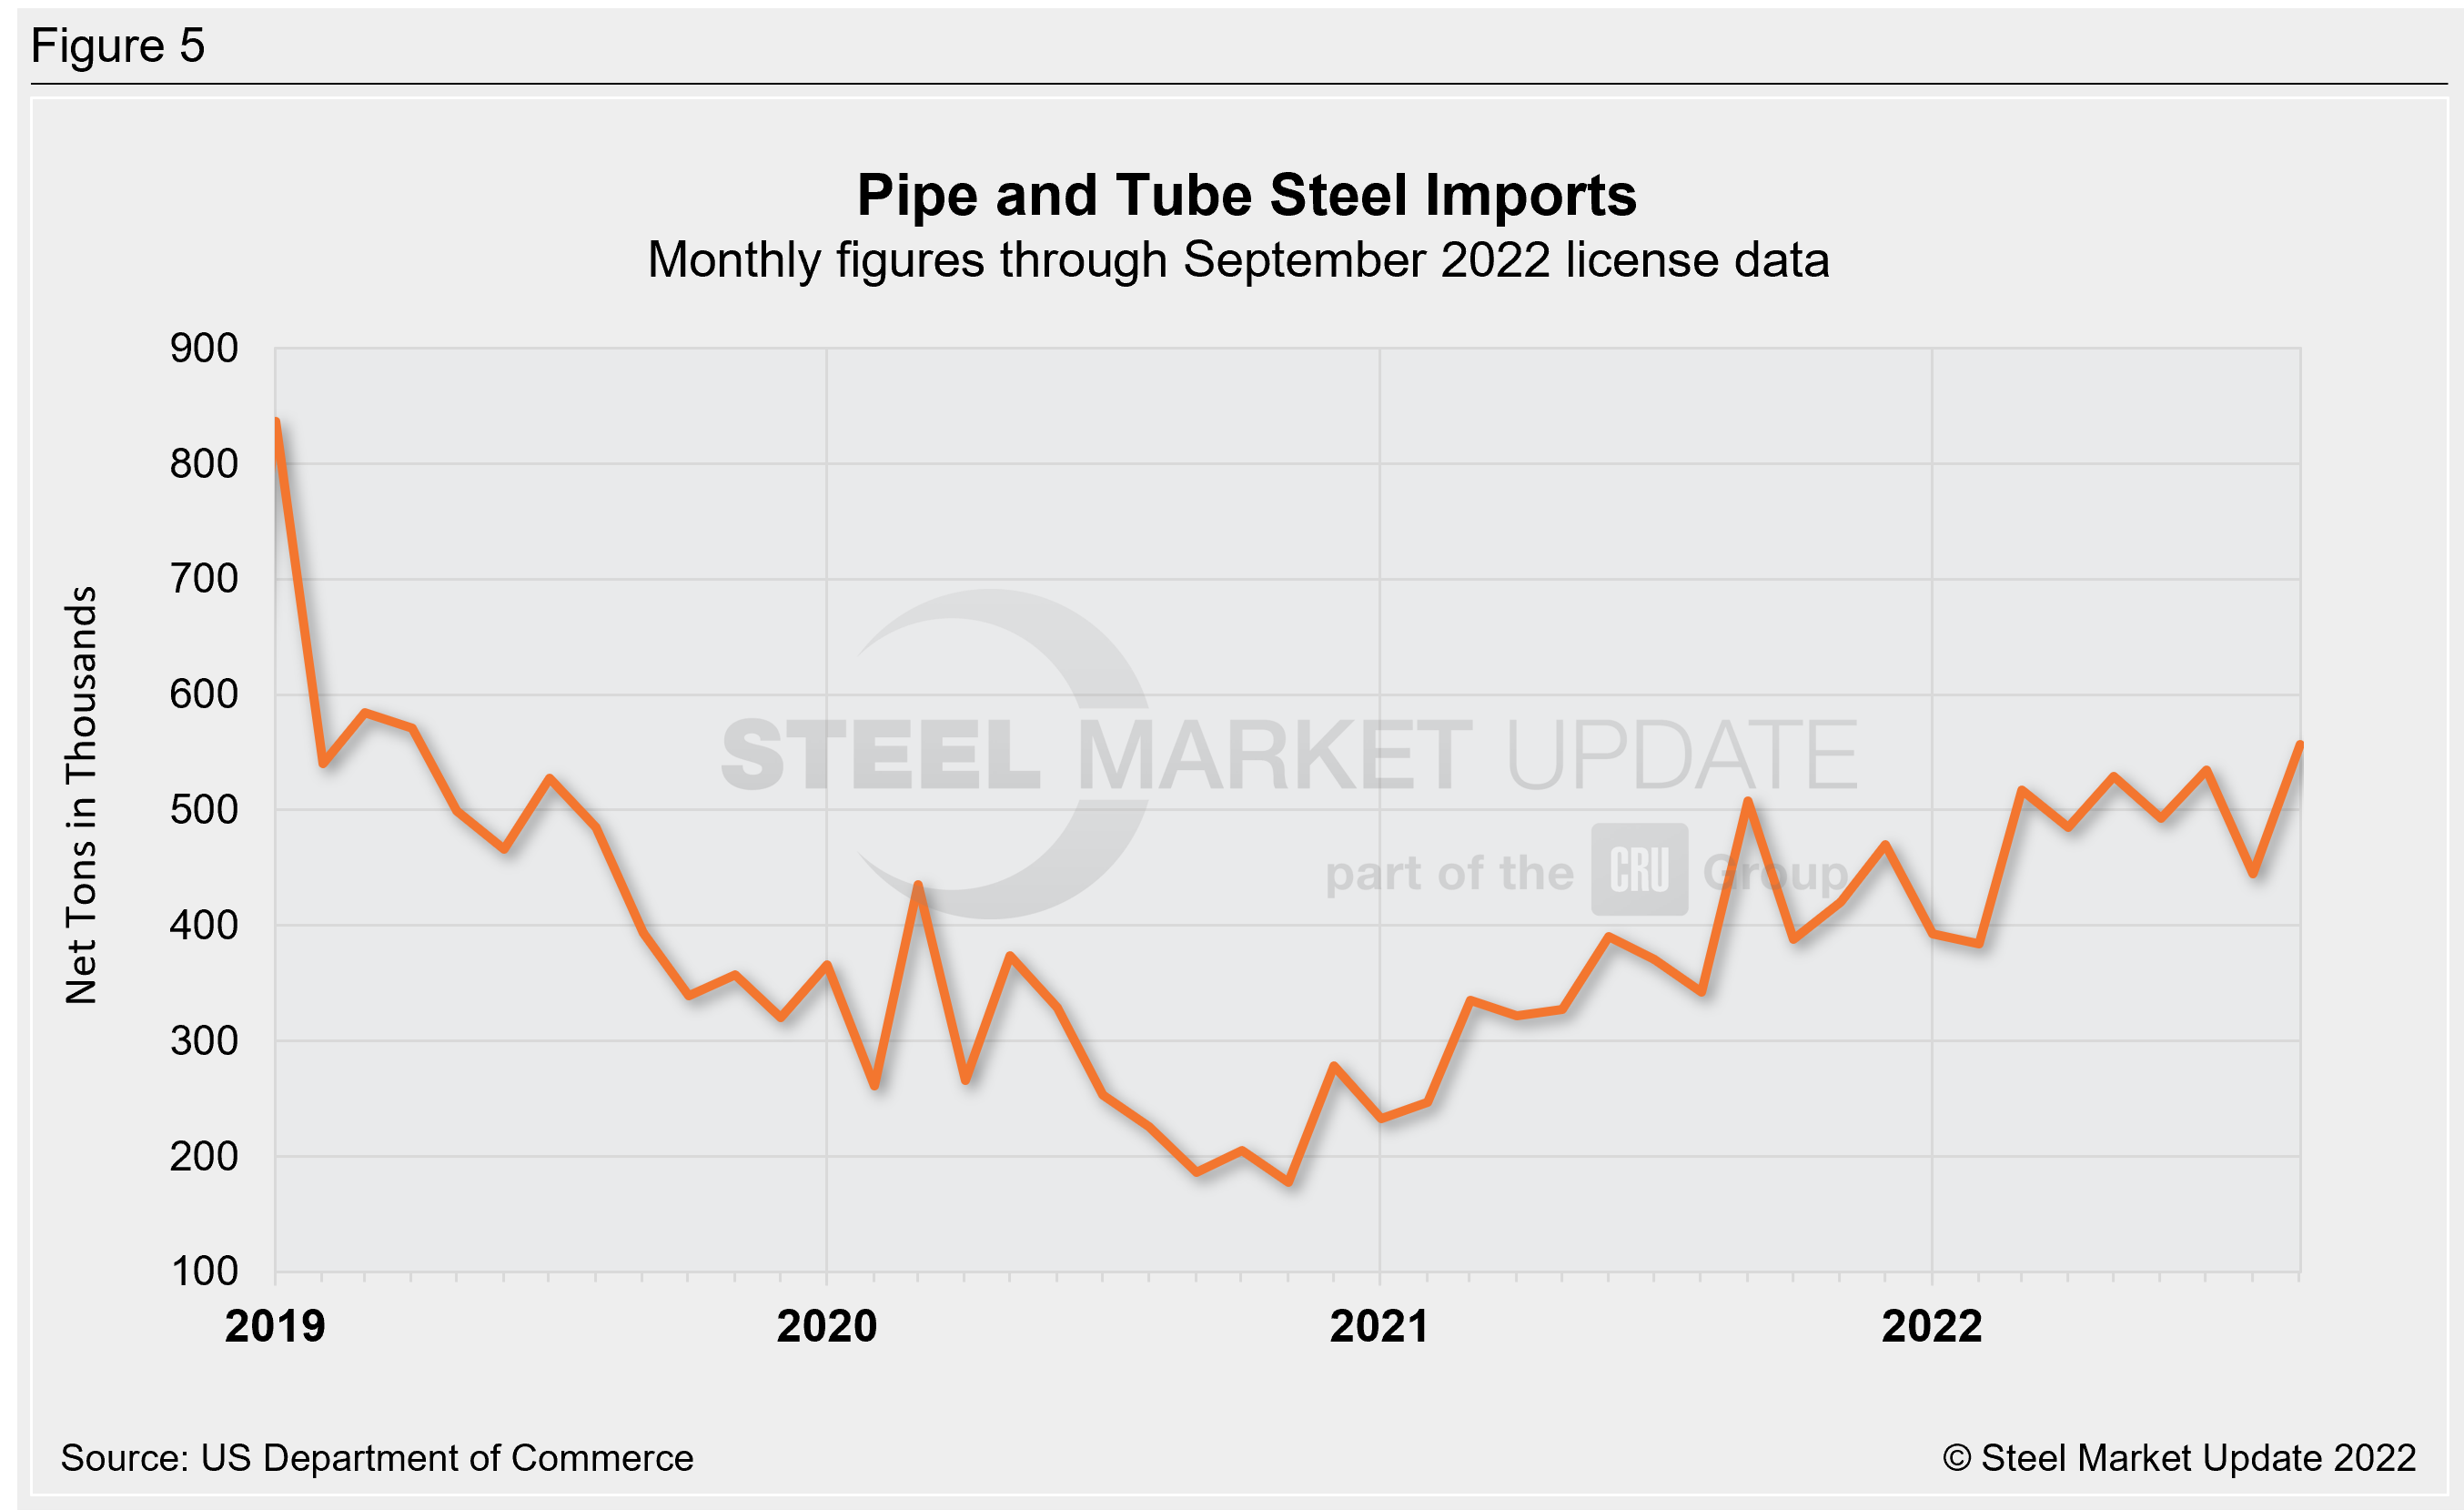
The two charts below show monthly imports grouped by product category: flat-rolled imports and pipe and tube imports. August flat-rolled imports totaled 1.07 million tons, up 6% from one month prior, but down 5% from June. September licenses are currently showing 861,000 tons of flat-rolled steel entering the country, 20% lower than August. Pipe and tube imports were 445,000 tons in August, down 17% from July’s 3+ year high. September pipe and tube imports have rebounded, with licenses currently up 25% to 557,000 tons.

We have an interactive graphing tool available on our website here. Readers can explore historical import data, in total and by product. If you need assistance logging into or navigating the website, contact us at Info@SteelMarketUpdate.com.
By Brett Linton, Brett@SteelMarketUpdate.com


