

Prices

March 3, 2016
Hot Rolled Futures: Here's David...
Written by John Packard
The following article on the hot rolled coil (HRC), busheling scrap (BUS), and financial futures markets was written by Dave Feldstein. As Flack Steel’s director of risk management, David Feldstein is an active participant in the hot rolled coil (HRC) futures market and we believe he will provide insightful commentary and trading ideas to our readers. Besides writing Futures articles for Steel Market Update, David produces articles that our readers may find interesting under the heading “The Feldstein” on the Flack Steel website.
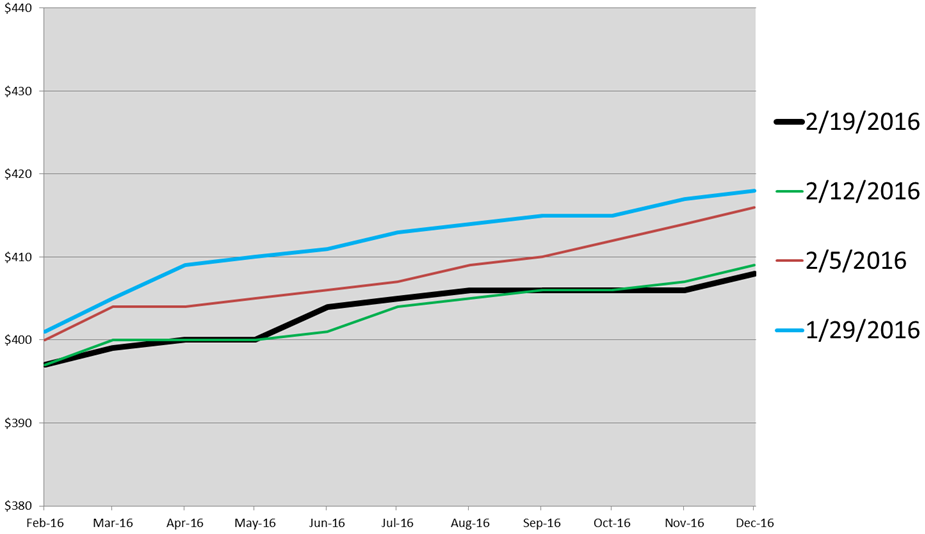
Before getting into the wonderful world of futures, let’s finish our coffee and briefly discuss the US domestic manufacturing and steel industry. US demand has been struggling for some time. The US steel mills have been battling global price devaluation (raw materials, finished products, energy), which has led to capacity rationalization and the launching of trade cases in HRC, CRC and HDG products. Imports have been declining for months, both as a result of the trade cases and weakening demand. The normal buzz of Q1 deals wasn’t heard in the fourth quarter of 2015. The OEM’s had adjusted their buying behavior to reflect short lead times and now, as evidence in the HRC CRC differential, the uptick in demand in 2016 (see January durable goods data) is causing a sharp tightening of availability in the market, especially in CRC and HDG products. As you can see below, the HRC futures hadn’t been reflecting this tightness; in fact the market had been under pressure for weeks.
CME Midwest HRC Futures Curve (2/19/16)
However, the tightness in CRC and HDG market is real. In the past few days, metals markets rallied globally along with oil kicked off by a massive increase in new yuan loans in China (the PBOC flooded the markets with liquidity in January) and last week we saw a noticeable uptick in TSI Turkish scrap prices.
TSI Daily Turkish Scrap
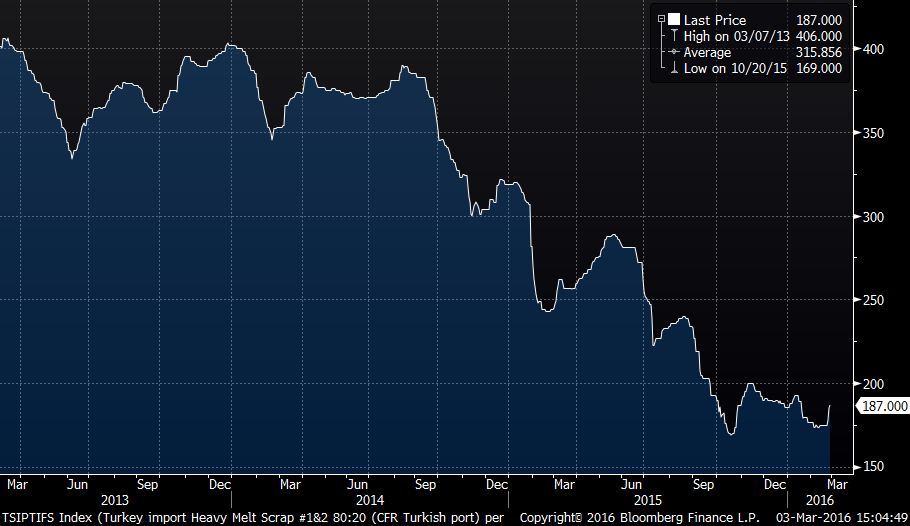
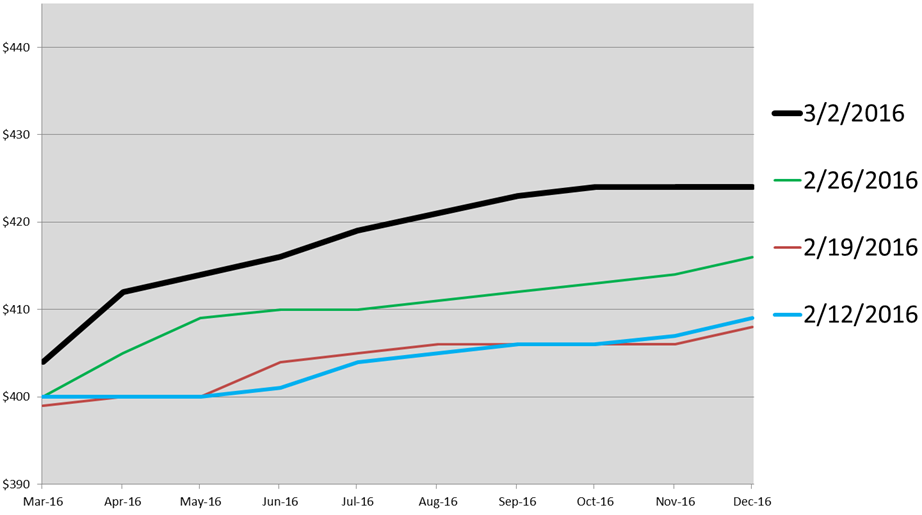
Last week, a buyer entered the HRC futures market looking to buy a strip of 300 st/m from May 2016 – March 2017 bidding $410/st to start (to be clear, the buyer wanted to buy 300 tons in May, June, July, Aug, Sept, Oct, Nov, Dec, Jan, Feb, March for a total of 3300 tons). This buyer kicked of the rally and was eventually filled at $417 (probably started too low). Then a flurry of activity on Monday and Tuesday of this week (which made the brokers very happy) was seen with Q2 trading 200 st/m at $410, 1200 st/m trading at $412, 500 st/m trading at $413 and 400 st/m trading at $414. Q3 traded 1000 st/m at $420/st and 900 st/m at $421. The preliminary ruling for the CRC antidumping trade case was announced Tuesday night and then the first index print for March was reported Wednesday morning. There have been no trades since Tuesday as the market continues to digest the news of the trade case as well as further rallying in Turkish scrap, which as of last night was up to $197/t. As you can see below, the futures are finally participating in the global commodity rally.
CME Midwest HRC Futures Curve (3/2/16)
There is no doubt things have been improving in the manufacturing industry in 2016 (see February ISM report) and what looks like a strong bid across metals and energy (perhaps in anticipation of stimulus to follow the China’s National People’s Congress meeting next week). The question remains is if the rally in steel pricing has legs or if this is just an acute restocking by OEMs caught short. The Feb. ISM still printed sub 50 and many buyers have been burned in the past year. However, this skeptical sentiment sets us up nicely for an extended rally as early doubters eventually have to come around and capitulate; climbing the wall of worry as they say.
Below is the rolling front month CME HRC futures curve (that means we take the settlement prices for Jan futures in Jan, February futures in Feb, etc. and roll them into one chart).
CME HRC Futures (Rolling Front Month)
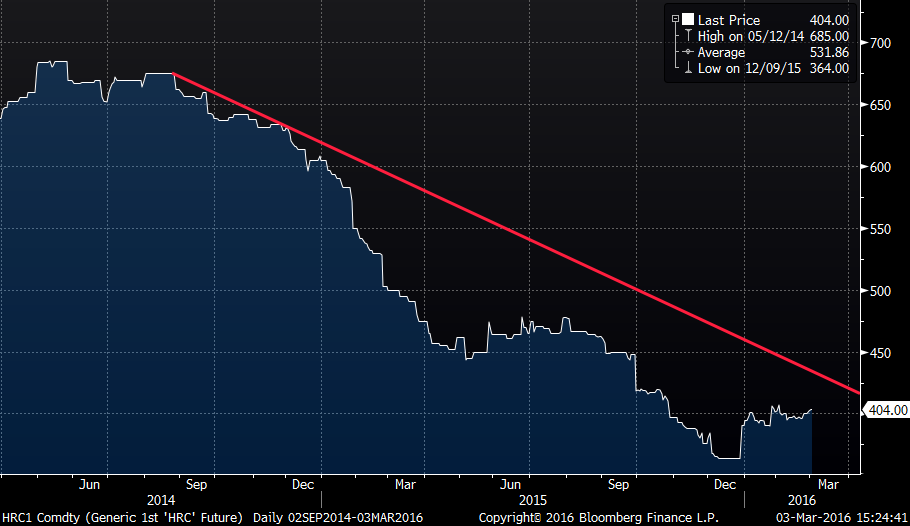
The red line is called a trendline and those who like to look at charts want to see the price cross above the trendline for confirmation that a rally has begun.
We’ll be back again next week to see if the rally in the futures continues while also diving into the potential that the HRC futures curve shifts into backwardation from contango. Don’t know what that is? Tune in next week to find out!
Back to you John…


