Prices

November 16, 2017
Q1 CME Midwest HRC Futures Trade $640; Approaching $650 Level
Written by David Feldstein
The following article on the hot rolled coil (HRC) futures markets was written by David Feldstein. As the Flack Global Metals Director of Risk Management, Dave is an active participant in the hot rolled futures market, and we believe he provides insightful commentary and trading ideas to our readers. Besides writing futures articles for Steel Market Update, Dave produces articles that our readers may find interesting under the heading “The Feldstein” on the Flack Global Metals website, www.FlackGlobalMetals.com. Note that Steel Market Update does not take any positions on HRC or scrap trading and any recommendations made by David Feldstein are his opinions and not those of SMU. We recommend that anyone interested in trading HRC or scrap futures enlist the help of a licensed broker or bank.
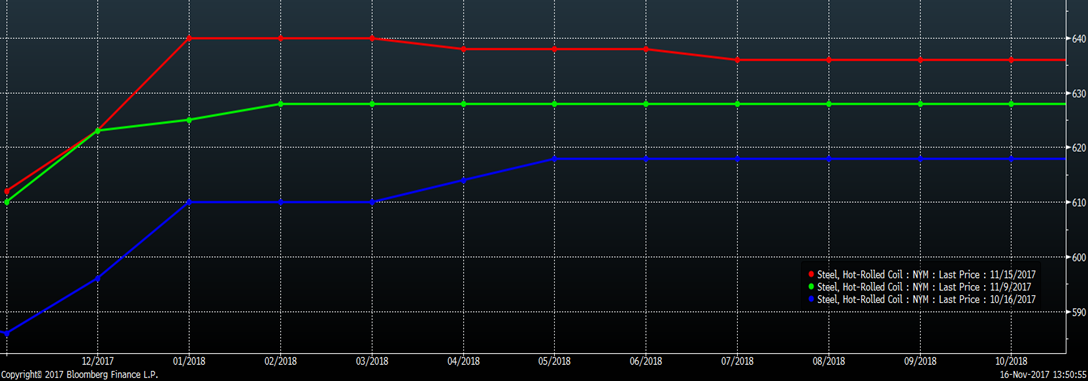
Activity in the ferrous futures markets has been relatively subdued over the past few weeks. The next three charts show the futures curves with each month indicated on the x-axis and each month’s settlement price on the y-axis.
In the CME HRC futures market, Q1 2018 traded $640/st again today as prices have moved higher following this week’s domestic mill price increase announcements. As you can see, HRC futures have steadily moved up over the past weeks with the curve remaining flat out through 2018.
CME Midwest HRC Futures Curve
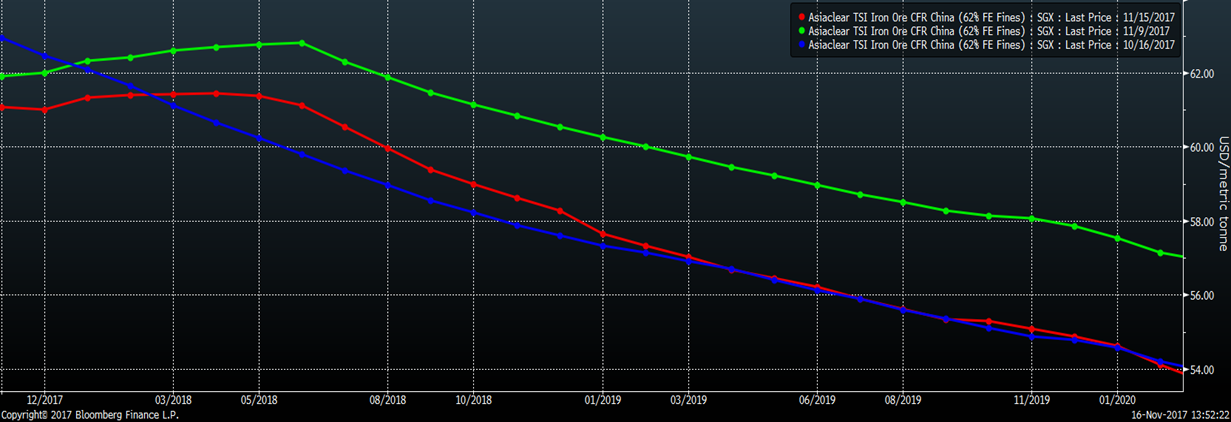
Iron ore futures have dropped $1 over the past week with December settling the day at $61.95/t. The front end of the curve has flattened after shifting into contango earlier this month. Iron ore futures have been stuck in a tight range all week.
SGX Iron Ore Futures Curve
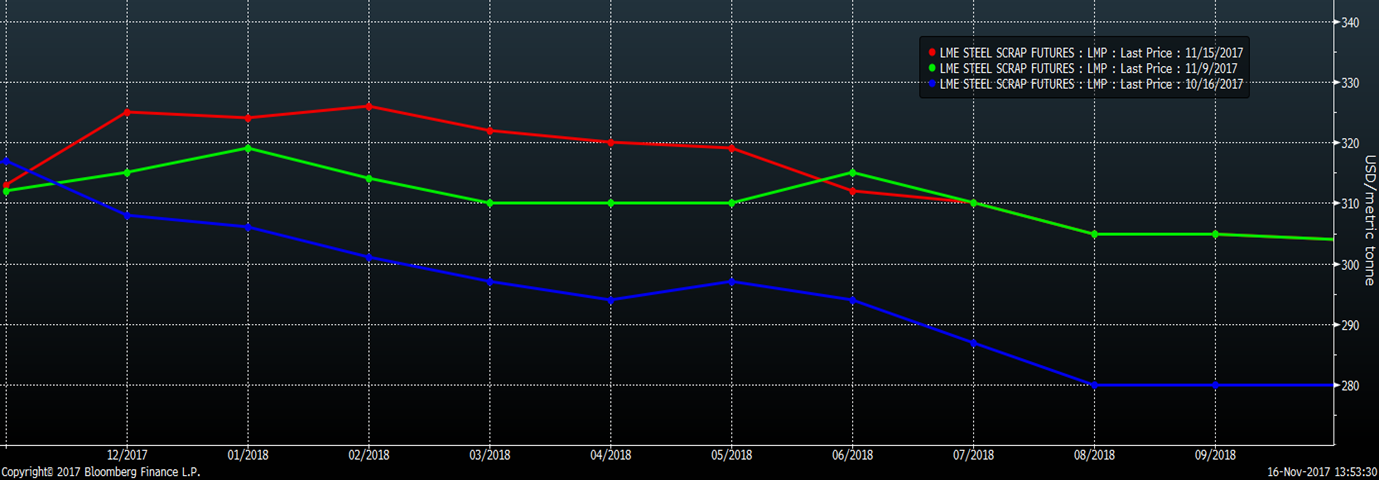
LME Turkish scrap futures have rallied as much as $25 over the past month with December trading up to $331/t today.
LME Turkish Scrap Futures Curve

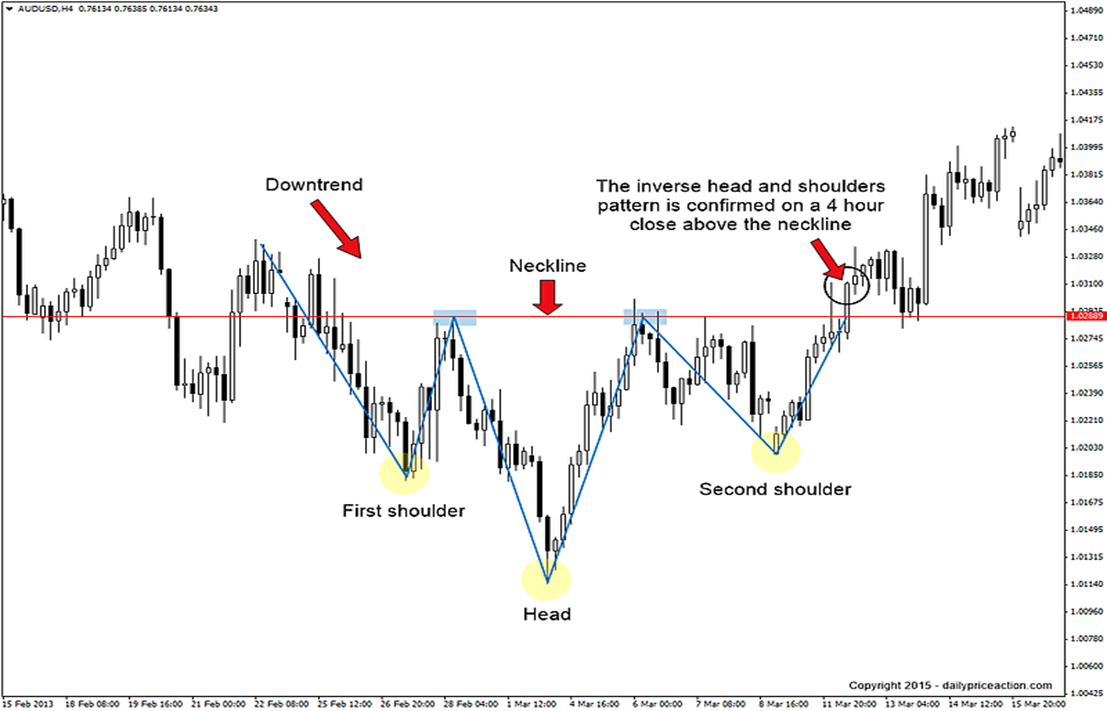
In the last couple articles, we’ve been monitoring the development of an “inverse head and shoulders” pattern in the chart of the rolling 2nd month HRC futures. An “inverse head and shoulders” pattern is a bullish breakout pattern. If it develops and then the price breaks through the neck line, it could indicate a big rally to follow.
Here is an example:
For more info about the pattern:
http://www.investopedia.com/terms/i/inverseheadandshoulders.asp
If the HRC price breaks above the $650 “neckline,” this chart pattern indicates a significant rally to follow. This charts the rolling 2nd month HRC futures price. The 2nd month “rolling” futures is combining each of the 2nd month futures contracts through time. For instance, during the month of November, it is the December future.
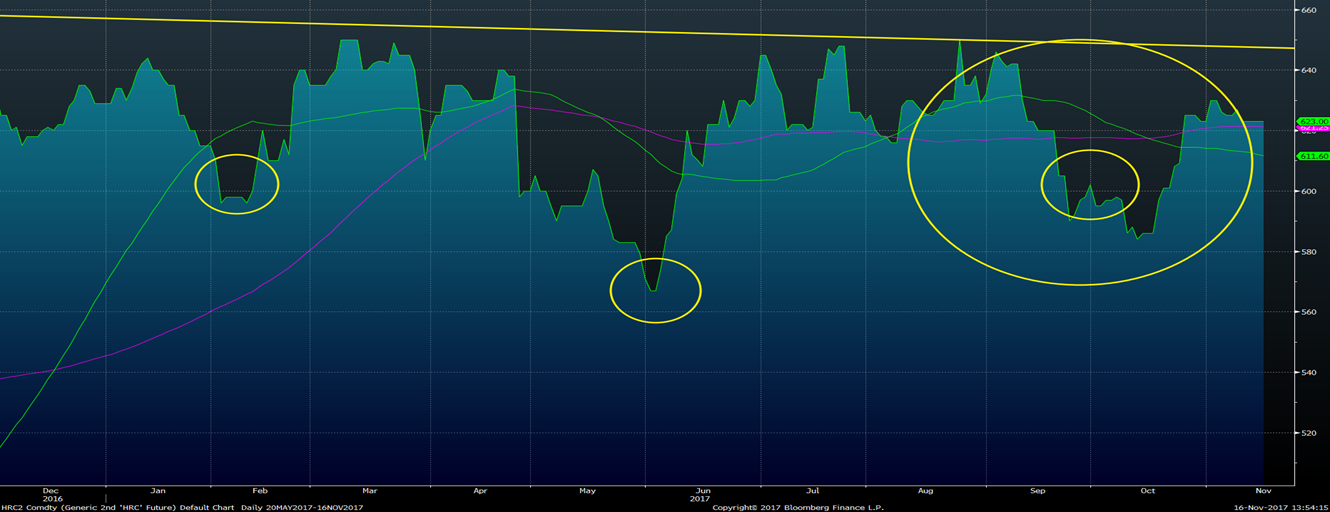
And as of Dec. 1, the rolling 2nd month will become the January 2018 contract. So, while the December HRC future is trading $630, the January contract is at $640. Keep your eye on both the December and January contracts as they approach the $650 level.
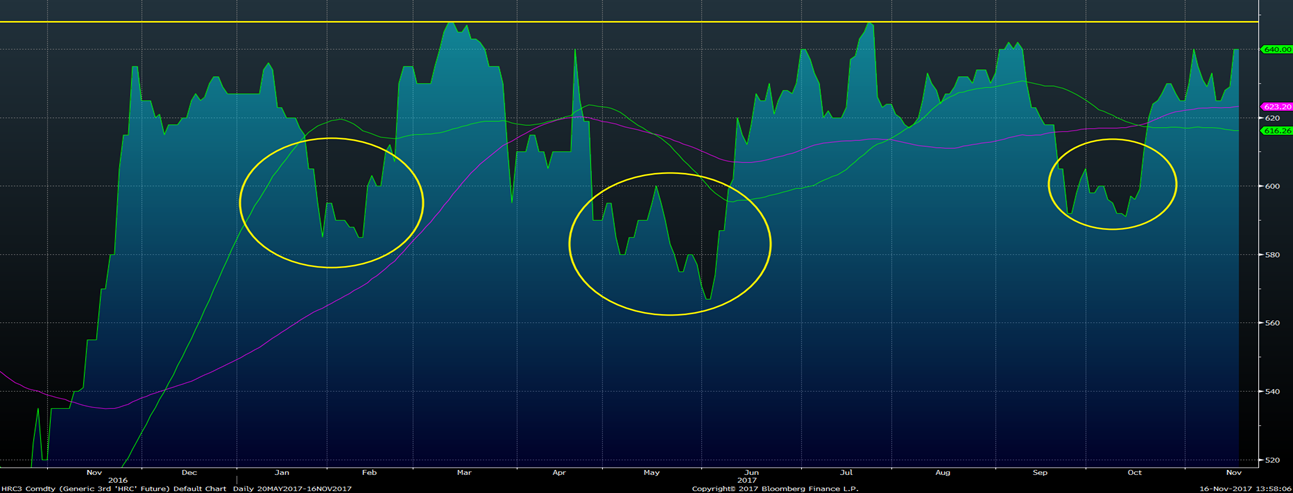
The chart below is the rolling 3rd month CME Midwest HRC future, which is currently the January contract. Notice a very similar inverse head and shoulder in this chart, as well.
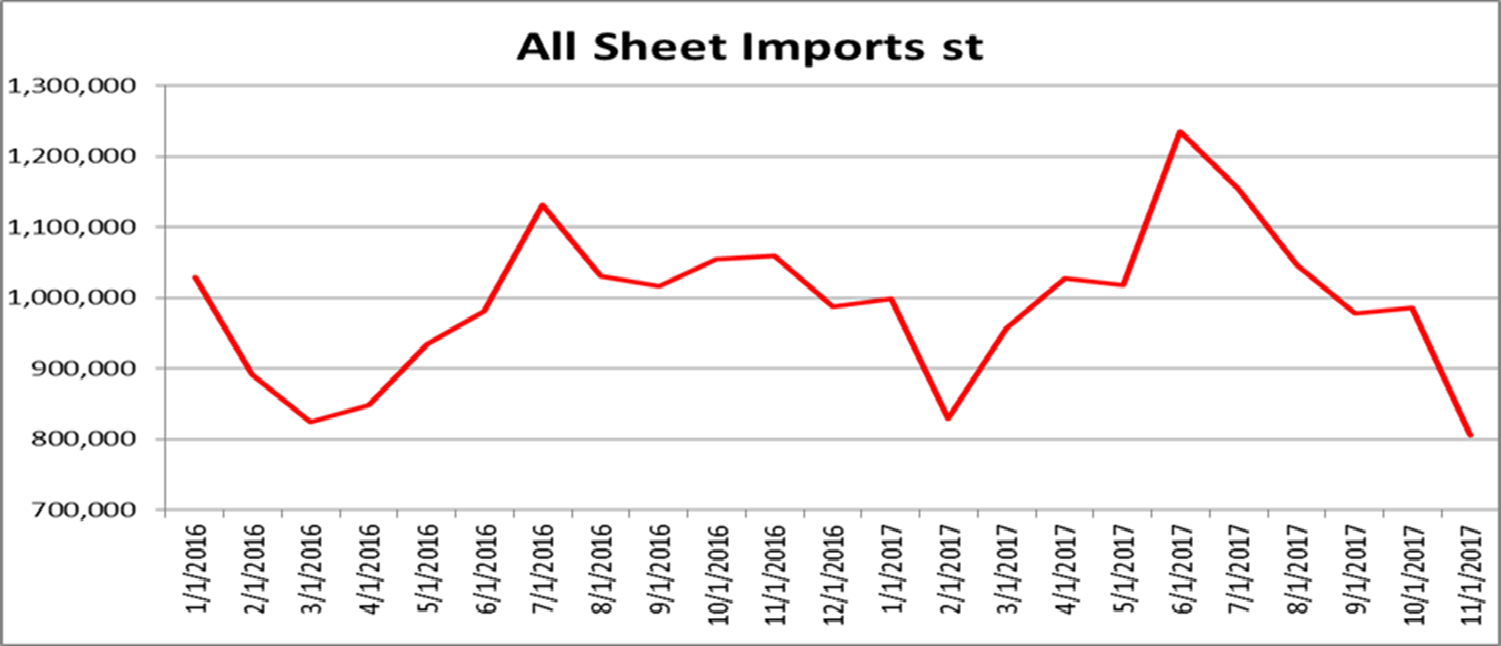
The November flat rolled import license forecast has plummeted. FGM’s current forecast points to an 18 percent MoM drop in flat rolled imports. The effect of the 232 investigation and then compressing global differentials curtailing import orders looks to finally be showing up in the data. We expect these relatively lower import levels to continue in the months ahead as the issues above started in June and the unattractive HRC differentials continue to play out today.
The opportunity might present itself in HRC futures at any time, so pay close attention to President Trump’s tweets, keep your local broker on speed dial and remember Ferrous Bueller’s philosophy…
“Life moves pretty fast. If you don’t stop and take a look around once in a while, you could miss it.”