

Prices

March 28, 2019
HRC Futures: Curve Flatter
Written by Gaurav Chhibbar
Gaurav Chhibbar is a partner at Metal Edge Partners, a firm engaged in Risk Management and Strategic Advisory. In this role, he and his firm design and execute risk management strategies for clients along with providing process and analytical support. In Gaurav’s previous role, he was a trader at Cargill spending time in Metal and Freight markets in Singapore before moving to the U.S. You can learn more about Metal Edge a www.metaledgepartners.com. Gaurav can be reached at gaurav@metaledgepartners.com for queries/comments/questions.
The HRC forward curve came under significant pressure as the market saw a downward print in the benchmark HRC index on Wednesday. Concern over future pricing of HRC and sliding spot levels meant sellers were looking for those bids even if it meant shaving off the price levels considerably. Day-over-day the Q2 price levels came down by $9, while Q3 dropped by $12. Q4 price levels came down by $5, however a surprising positive change in December meant a relatively modest drop in Q4 versus the rest of the curve.
The shape of the curve reflects the near-term bullish price trend having been discarded by some.
Green- HRC Forward curve 3/22 ; Orange- HRC Forward Curve (Today)
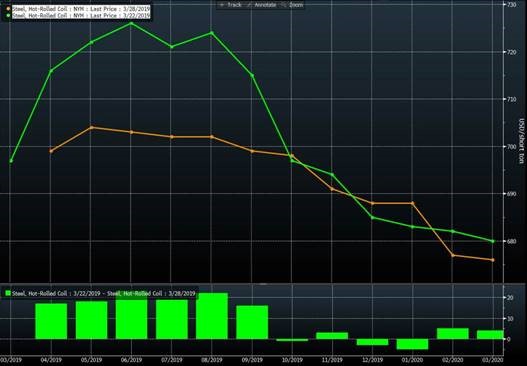
This has made the HRC curve flatter than it has been in a long time. For a backwardated curve to flatten, it would imply one of the following two explanations:
- The market sees spot weakness not persisting into outer months or
- The market bids up the outer months to be flat with the nearby levels.
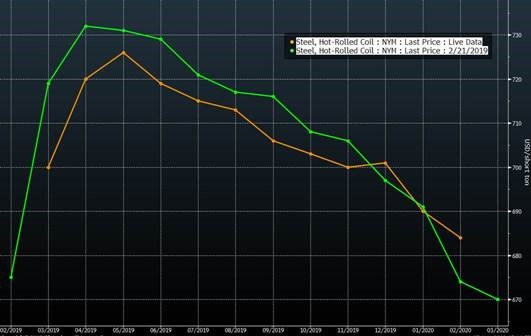
Clearly the curve has flattened due to the nearby weakness and not strength in the deferred months. I share the forward curve snapshot from the article I had written in the SMU on March 7 (snapshot of curves from that article is below). The theme of that article was to ponder on the question of whether we were flattening, and I mentioned the shape of the curve then was more suggestive of a cautious market. That caution, clearly, has given way to conviction as near months have found more sellers. Many are pointing towards weak HRC transaction levels in the physical market. For now it seems that potential gains from low inventories and pentup demand due to weather have been written off.
(Forward curve snapshot from the March 7 article)
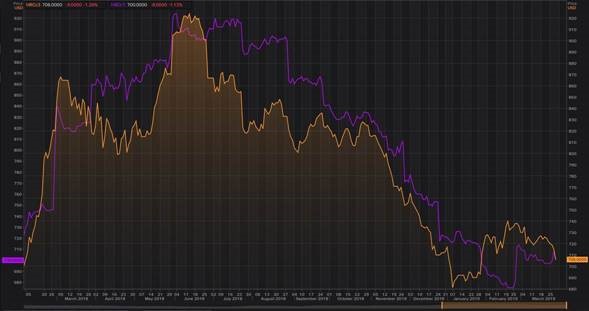
The chart below highlights the relative move of the spot month versus the third month. The span of time where the spot month (purple line) is below the third month (orange line) underscores the market expectation for higher prices in the future. As is evident, the expectation for higher future prices was the strongest around the time of the last price increase. Sellers in the futures market would argue that increased domestic production has more than compensated for decreased import. However, it would behoove those keeping a check on the futures market to always analyze the complete picture of supply and demand rather than just looking at the volatility of the futures market to call an end of a price trend.
Another interesting development this week was the CME (Chicago Mercantile Exchange) launching another futures contract benchmarked to the Platts’ daily index. This new contract now provides players inclined to look for a daily published index to express their view on HRC. As market liquidity in HRC has grown, so has the interest from end-users, market makers, and traders to use the HRC futures. This new contract will have to attract liquidity over time for it to serve as a good tool for managing HRC price risk.
Disclaimer: The information in this write-up does not constitute “investment service,” “investment advice” or “financial product advice” as defined by laws and/or regulations in any jurisdiction. Neither does it constitute nor should it be considered as any form of financial opinion or recommendation. The views expressed in the above article by Metal Edge Partners are subject to change based on market and other conditions. The information given above must be independently verified and Metal Edge Partners does not assume responsibility for the accuracy of the information.


