Product

April 23, 2020
Hot Rolled Futures: CME HRC and Busheling Futures Remain Optimistic of V-Shaped Recovery
Written by David Feldstein
SMU Contributor David Feldstein is president of Rock Trading Advisors (davidfeldstein@rocktradingadvisors.com). In addition to market analysis, RTA provides price risk management not only for ferrous products, but also base metals, energy and interest rates. RTA also trains sales staff and creates the infrastructure necessary for firms to offer their customers fixed pricing on physical sales.
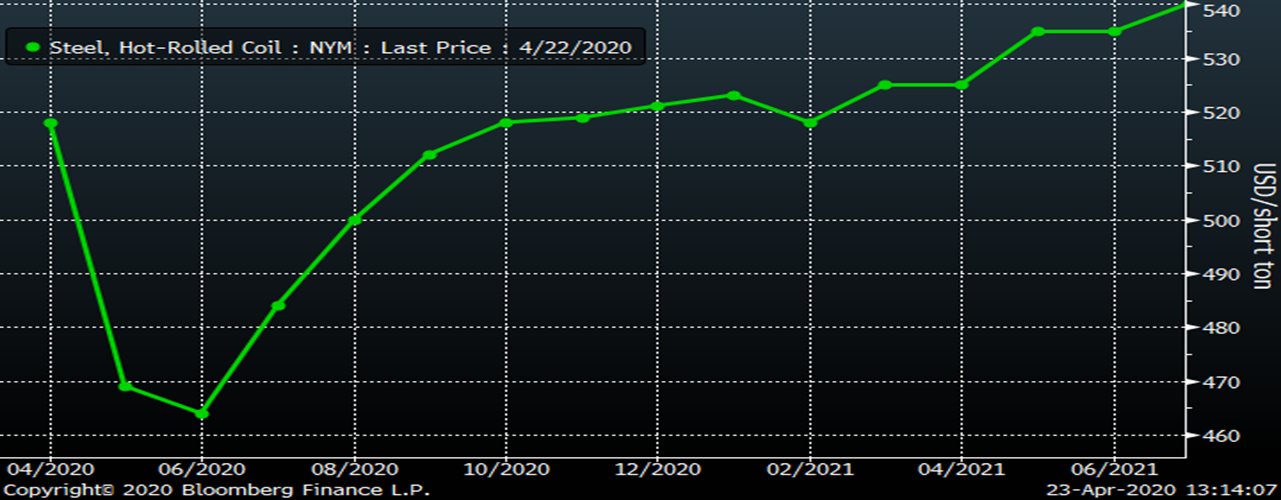
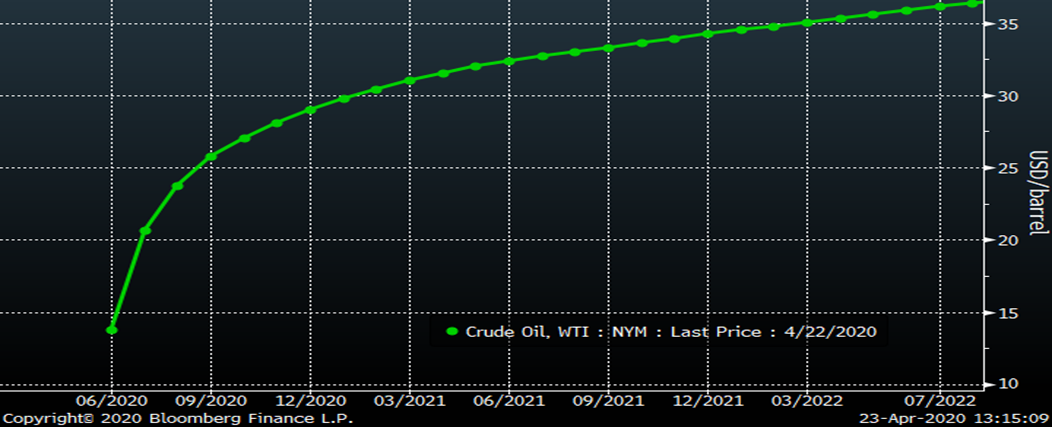
Current market expectations extrapolated from the CME Midwest HRC futures curve indicate a sharp V-shaped recovery. May and June futures have been trading around $470 this week. The curve currently has hot rolled bottoming in June and then rebounding back to $500 in August and back towards $540 in the months that follow. Central to these expectations is a sharp snapback in demand, one that gets ahead of the unprecedented, abrupt and aggressive supply cuts taken by numerous mills to idle capacity resulting in a tight market. A long-term cumulative decrease in imports and rationalization of service center flat rolled inventory leaves the industry in a relatively healthy position to weather this 100-year storm. Therefore, the key to all of this lies in the timing and strength in demand once the economy returns.
CME Hot Rolled Coil Futures Curve $/st
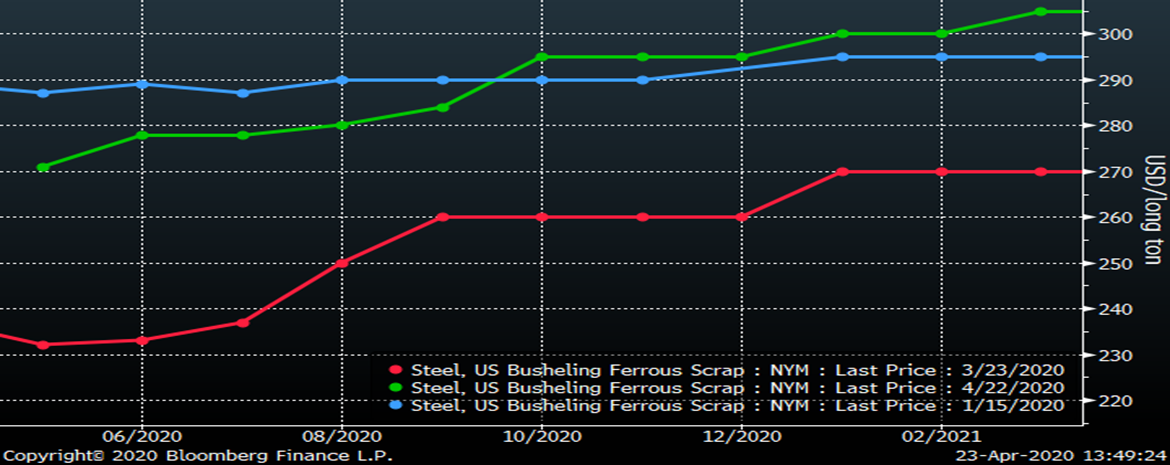
This generally optimistic expectation for the months ahead can also be extrapolated from the busheling curve. After May busheling fell to as low as $220 in late March, the curve has rebounded sharply with an almost unrelenting strength back to levels seen in early January.
CME Busheling Futures Curve
Busheling’s strength has been even more curious considering the decimation of oil prices. The May CME WTI crude oil future settled Monday at -$37/bbl due to a dislocation in that market by individual long futures unauthorized by the exchange to take delivery being liquidated into a physical market that had run out of storage capacity.
CME WTI Crude Oil Futures Curve $/bbl
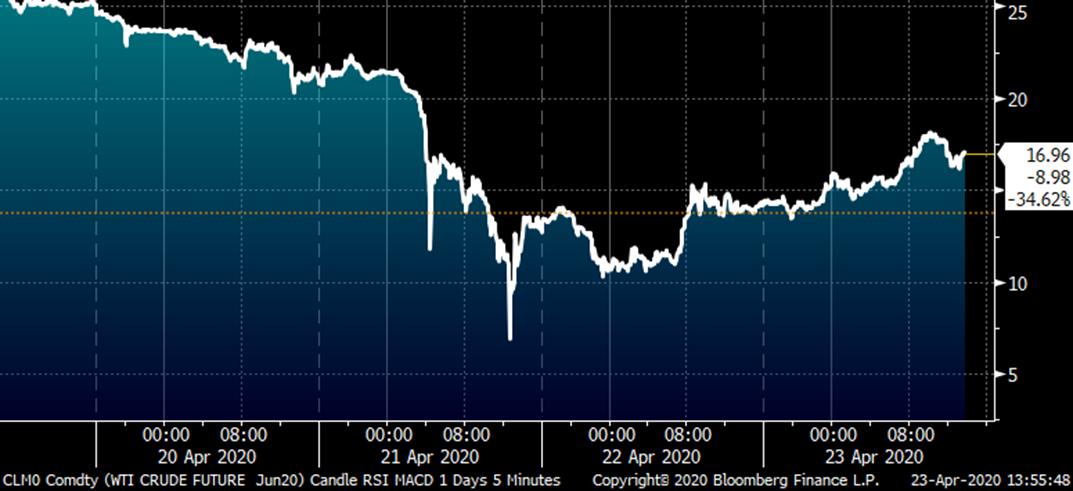
Then on Tuesday, the CME June future, which doesn’t settle until May 19, traded to as low as $6.50/bbl as concerns over an oil storage shortage overwhelmed the futures market. While the market has rebounded, the June future settled today just below $17/bbl while the futures curve doesn’t return above $30 until January 2021.
June CME WTI Crude Oil Future $/bbl
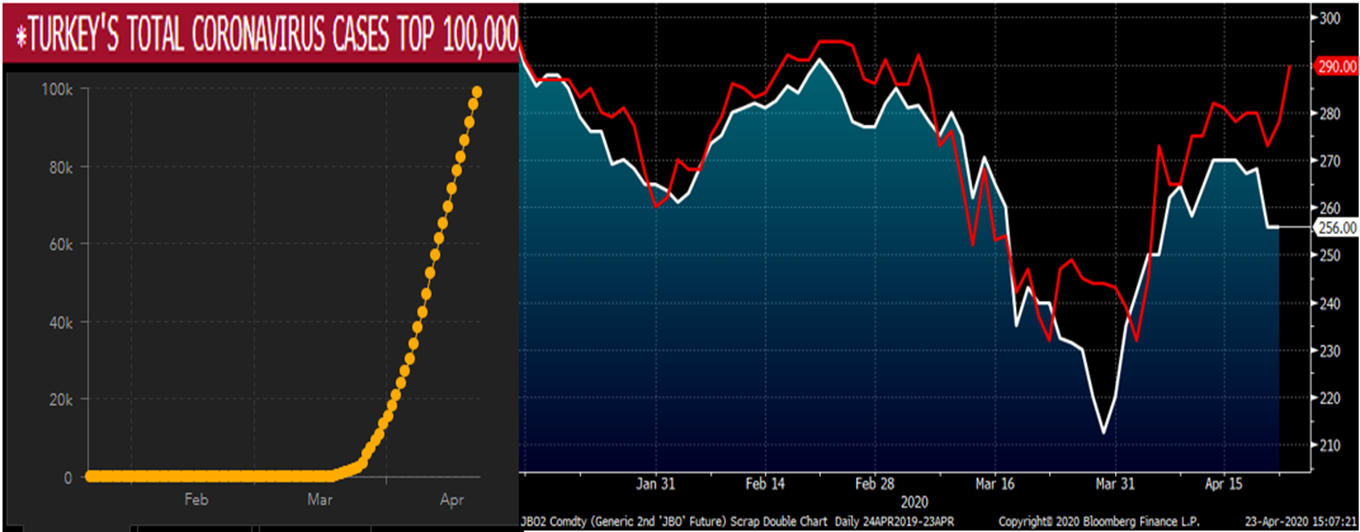
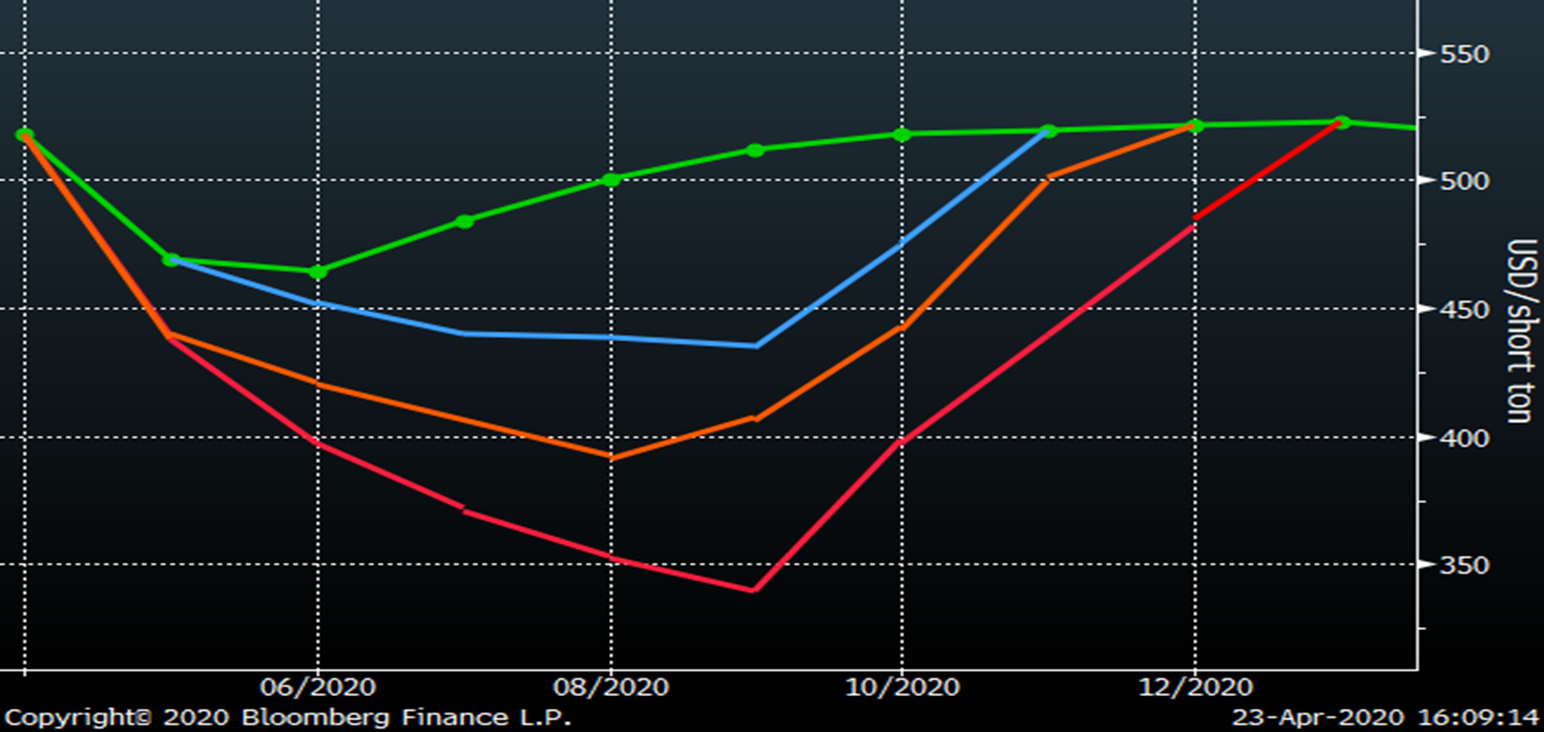
While the shortage created by the lack of manufacturing production is central to the bull case for busheling, there are also significant bearish concerns in addition to those caused by the pandemic-induced economic shutdown. First, the work being done by the U.S. Army Corps of Engineers on the Illinois River starting in July will prevent barges from bringing scrap out of the Midwest starting in June. This could lead to Midwest busheling tons held captive in the Midwest creating an abundance, not shortage, of scrap. Further, Turkey has seen its number of COVID-19 cases explode in recent weeks, breaking above 100k today while the country has yet to institute a stay-at-home order. The graph on the right shows LME Turkish scrap trading lower and diverging from CME busheling scrap in recent days.
Rolling 2nd Month CME Busheling Future (red) & LME Turkish Scrap Future (white)
Source: John Hopkins University COVID-19 Dashboard, Bloomberg
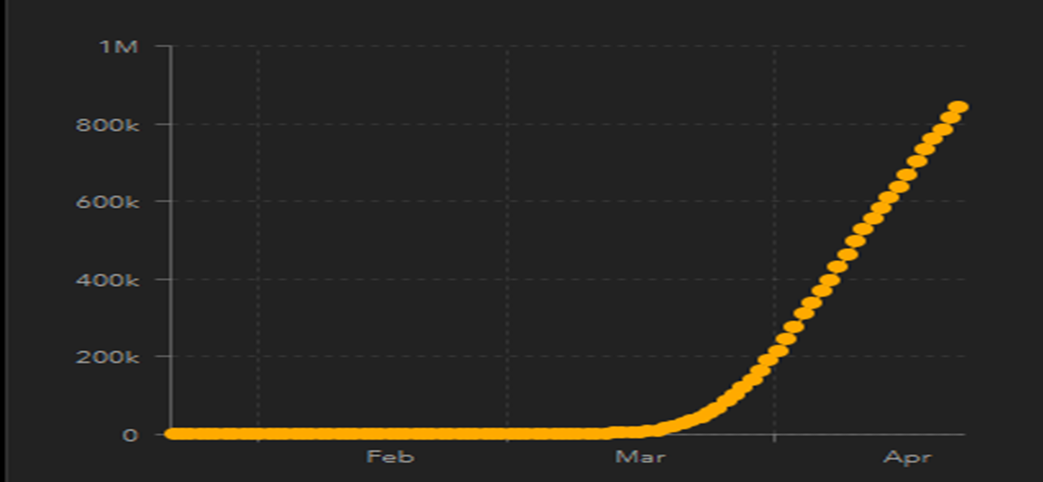
The U.S. is now at least six weeks into this catastrophic pandemic. During this period, I have had to adapt my research by finding new tools. Initially it was tracking COVID cases by country, and now it has been to granularly look at new cases state by state across the country. This map from the John Hopkins University COVID-19 Dashboard shows that 856k cases are everywhere.
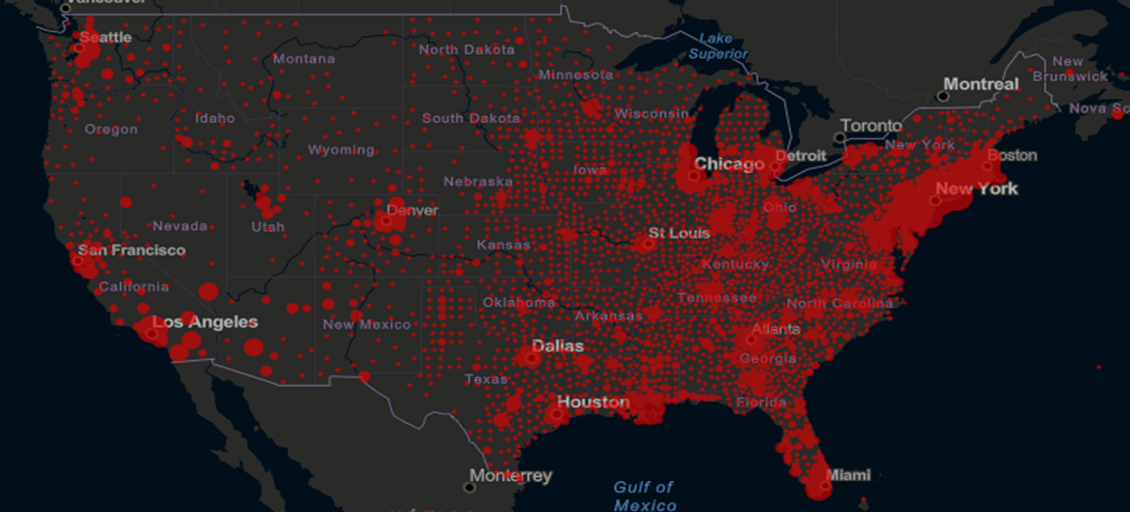
Source: John Hopkins University COVID-19 Dashboard
While the scourge in New York looks to have overcome the worst of outcomes, the spread of COVID across the country, as shown by the curve below, is showing no stopping in the exponential growth of infections. The COVID pandemic continues to be out of control in our country.
Source: John Hopkins University COVID-19 Dashboard
Stepping back into the HRC and busheling futures curve, the key to whether the current position of the curve is too pessimistic or too optimistic, and therefore if there are opportunities to buy or sell the curve, all hinges on the recovery. When does the recovery start? How quickly will the supply chain recover once it does and what will demand look like?
I write a regular report for my customers and in last week’s report I compiled a list of headlines of European governments extending their stay-at-home orders, predicting that the same was in the works in the United States.
Barring a miraculous development, whatever that is, but most likely an efficient and incredibly scalable testing program, we are faced with two paths. The first is continued extensions and delays with respect to quarantine, nonessential workers returning to work and other measures that fit in the scheme of “re-opening” the economy until we get to a point where the number of infected has drastically diminished and reliable mechanisms to contain new infections are in place. The second is where the economy “re-opens” without a reliable way to control the virus and a second wave of coronavirus hits that forces everyone back into quarantine and the economy to shut down again.
My contention is that expectations for the “re-opening” of the economy, which for some might mislead them into thinking we are going to go back to the way we were in January and the economy is going to go back to what it was, are wildly optimistic. As this realization sets in, financial markets are going to adjust to this reality. We are likely to see a revaluation lower in asset prices. In other words, a second wave of selling and dislocated markets like those seen in February and March is a very real possibility.
Chinese general, military strategist, writer and philosopher Sun Tzu said, “In general, the strategy for employing the military is this: if your strength is ten times theirs, surround them; if five, then attack, if double, then divide your forces, if outmatched, then avoid him.” Clearly, we are outmatched against this enemy at the moment. However, just as in World War II, our industrial might is hard at work building the necessary stockpiles to combat the enemy. However, more time is needed to get to that point, leaving isolation, i.e. avoid the enemy, as the only reliable action.
This chart shows the number of new diagnosed cases of COVID-19 per day for the seven-day period from April 15-April 21 with the seven-day total in the leftmost column for the U.S. as a whole and then the top 15 states with the most new cases. During that time, the U.S. saw 197k new cases of COVID. The states highlighted in gray are Midwest states where steel mills are located. Note Georgia is 11th on the list.
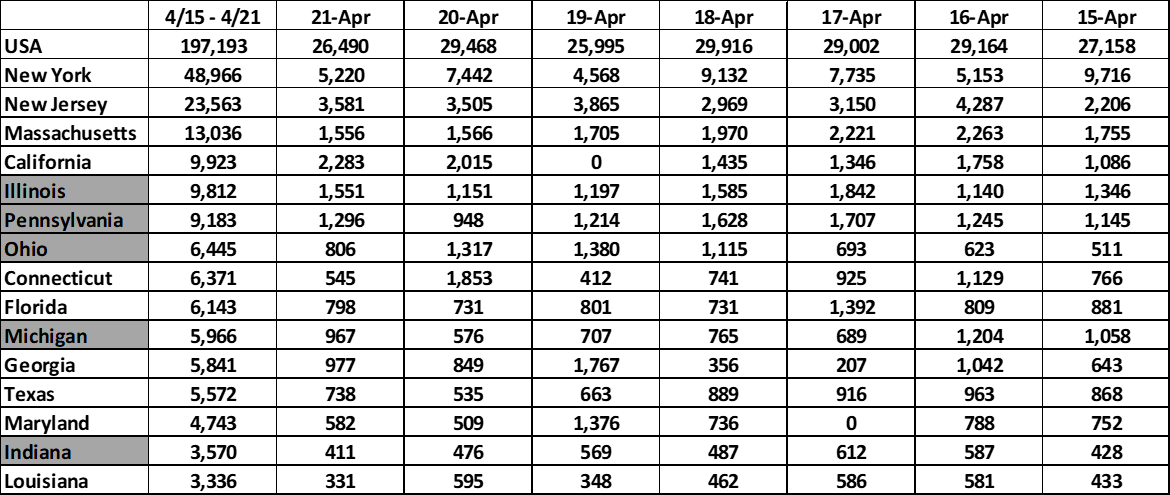
Source: Centers for Disease Control and Prevention
Cautious, conservative, careful. This is going to be the primary path taken by business and community leaders, because when you weigh the economic risks of short-term losses versus a second wave of infection, there is no comparison. While writing this article, Illinois Governor Pritzker was announcing a 30-day extension of the stay-at-home order. Expect more of this until the number of new cases comes down drastically and the availability of testing and PPE for workplace safety is suitable.
Once the economy re-opens, likely after Memorial Day at best, the economic toll will be significant. The longer the economic shutdown persists, the more revenue is lost, the more interest and rent payments will be missed, the harder it is going to be. But remember, we are being held hostage by the coronavirus and have only one way to defeat it, isolation, until reinforcements (testing, cure, vaccine) arrive.
2020 capital expenditure budgets have been slashed. Tens of millions of Americans have lost their jobs, millions more are being furloughed and many that kept their jobs have seen their salaries cut by 20 percent. The months ahead will be challenging to say the least and steel demand is likely to be sluggish with balance sheets in shambles.
Months from now when we look back at today’s curve, what will the result look like?
“Everyone has been wrong about everything about this entire duration.” – New York Gov. Andrew Cuomo
Expect it will look very different than what it is today. That could mean a much lower bottom than currently being priced and an extended U-shaped trough. I have drawn a couple different potential outcomes. It has been helpful for me to suspend my beliefs about reasonable values based on the recent past (oil at $7.20/bbl or the 10-year Treasury rate at 0.35%). Start thinking about these potential outcomes of a slow return and deep recession as the world adapts to a new reality. Anything can happen in these times. Hope for the best, plan for the worst. Most of all stay healthy.
CME Hot Rolled Coil Futures Curve $/st
Disclaimer: The content of this article is for informational purposes only. The views in this article do not represent financial services or advice. Any opinion expressed by Mr. Feldstein should not be treated as a specific inducement to make a particular investment or follow a particular strategy, but only as an expression of his opinion. Views and forecasts expressed are as of date indicated, are subject to change without notice, may not come to be and do not represent a recommendation or offer of any particular security, strategy or investment. Strategies mentioned may not be suitable for you. You must make an independent decision regarding investments or strategies mentioned in this article. It is recommended you consider your own particular circumstances and seek the advice from a financial professional before taking action in financial markets.