

Prices

December 3, 2020
HRC Futures: Insatiable Rally…July HRC Trades at $1,665
Written by David Feldstein
Editor’s note: SMU Contributor David Feldstein is president of Rock Trading Advisors. David has over 20 years of trading experience in financial markets and has been active in the ferrous futures space for over eight years. You can learn more at www.thefeldstein.com or add him on twitter @TheFeldstein and on Instragram at #thefeldstein.
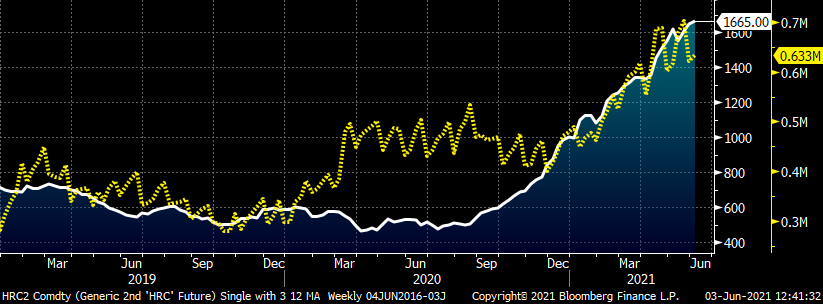
This charts shows the rolling 2nd month CME Midwest HRC future (white) and the total aggregated open interest in short tons (yellow) for all CME Midwest HRC futures contract months. If open interest is unfamiliar to you, it provides how many outstanding futures contracts there are at the end of each day. If a contract has zero open interest and there is a trade for 200 tons between buyer A and seller B, then there will now be 200 tons of open interest posted at the end of the day. If the next day, seller B buys back 200 tons from seller G, there is still 200 tons of open interest. If the following Monday, buyer A sells 100 tons back to seller G, then both will have realized a gain or a loss on the 100 tons traded and open interest decreases to 100 tons.
Both the futures and open interest have been moving sharply higher since the start of 2021. Increasing open interest accompanying a rally is considered to be a technical indicator of a strong bull market. The basis for why this is a bullish technical indicator is that open interest increasing along with higher prices tells us buyers are opening new positions and are willing to pay higher prices to do so. If the higher prices were primarily due to short sellers getting squeezed and covering losses, open interest would decline. Open interest reached a new all-time high just above 700k tons last month and is currently at 633k tons. Years ago, concerns over the hot rolled market’s liquidity kept many would-be participants on the sidelines. It appears between the increased liquidity and whiplash volatility that started in 2018, more folks are entering the market than ever before.
Rolling 2nd Month CME Hot Rolled Coil Future $/st & Aggregated Open Interest
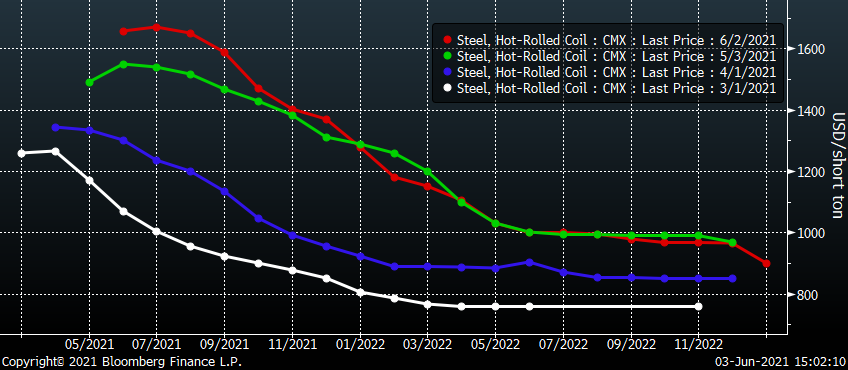
This graph shows the Midwest HRC futures curve settlement as of the first day of the months of March through May and then last night’s settlement in red. HR futures are backwardated or downward sloping. Generally speaking, one reason a futures curve is in backwardation is because of a shortage of the underlying physical product. To review, the hot rolled futures curve is telling us the physical hot rolled market is in a strong bull market and appears to be due to a shortage. So, there you go…how helpful has this article been so far!
CME Hot Rolled Coil Futures Curve $/st
Unfortunately, the futures curve doesn’t tell us when this shortage will end. Nor does it provide any advice on how to manage through the months ahead. Have you ever been skiing and ended up on a black diamond trail that was way too steep for your skill level, but had no other way to get down than going really slow or falling really hard? If so, then you are familiar with that terrible feeling that washes over you in a moment like that. That is what this moment is like, except in this case we’re skiing down Mt. Everest.
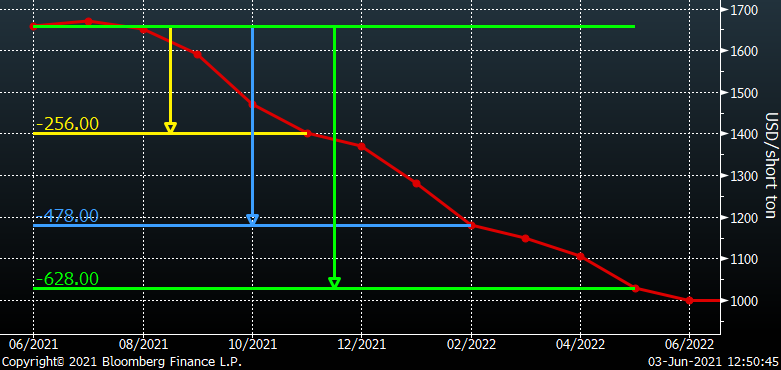
The spread between June and November or Q4 is $256. The spread between June and February 2022 or Q1 ’22 is $478. Each point on the curve is merely where two market participants most recently found a price where they were willing to trade. While the curve doesn’t provide information for when the shortage ends or when the price falls or how it falls, it does show us how insanely intense the situation is.
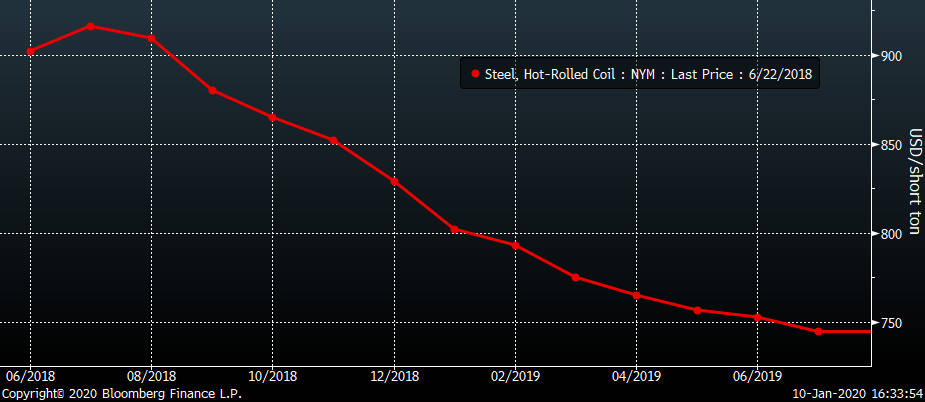
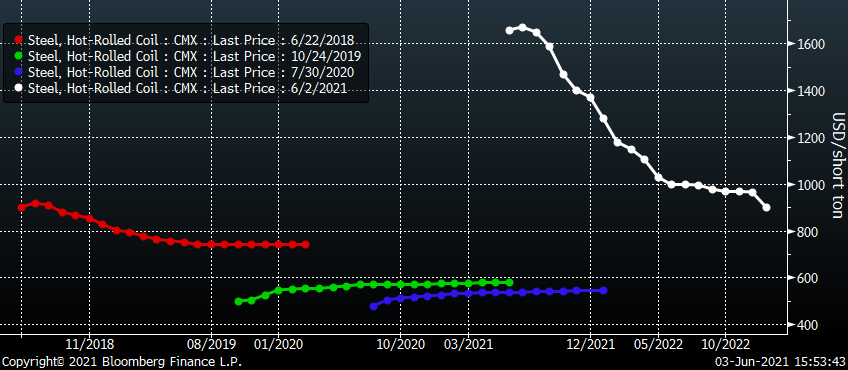
Here is another way to put it in perspective, and pay particular attention to the slope and high/low points of these curves. This was the HRC curve on June 22, 2018, at the peak of the Section 232 market.
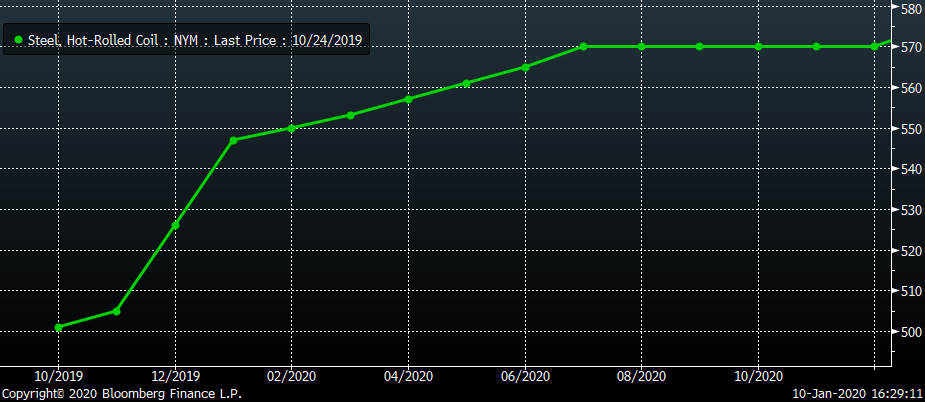
Here is the curve on Oct. 24, 2019, when the post 2018-2019 bear market was bottoming.
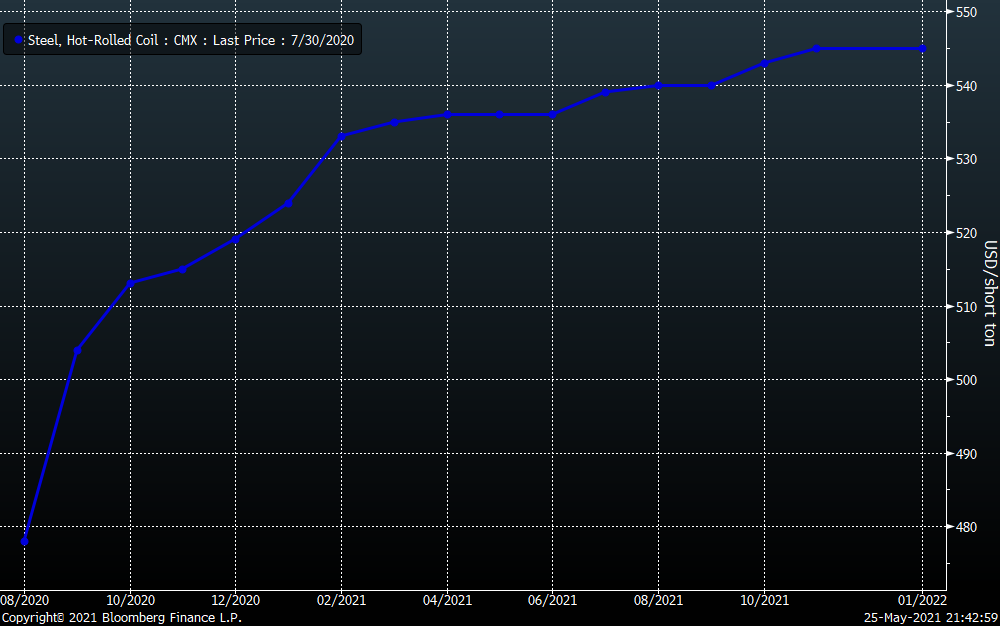
Here is the curve from July 30, 2020, a few weeks before the current rally began.
Here are those three curves plus last night’s curve in white. The current curve is a monster. It makes those other three curves look flat. Mt. Everest, folks. Anybody else having a hard time breathing up here?
For long hedgers (steel mills, service centers) looking to transfer downside price risk, this curve provides two types of choices: really bad or even worse. Long hedgers can sell the near months, a strategy that has left a wake of death and destruction like something out of a Mad Max movie. The other choice is to sell the later months at a steep discount (see above) to spot locking in a massive loss.
However, for short hedgers (OEMs) it provides an opportunity to lock in forward purchases well below spot. And that is what we have seen happening, and why these later months have rallied, flattening the curve at times over the past couple months. With the front months now in the mid $1,600s, I wonder if we will see buyers flock to these discounted months further down the curve both because of their value and because there aren’t many contract tons left to buy, which will again flatten the curve. The primary buy-side interest has been coming from OEMs, while the primary selling interest has been those looking to hedge imported tons.
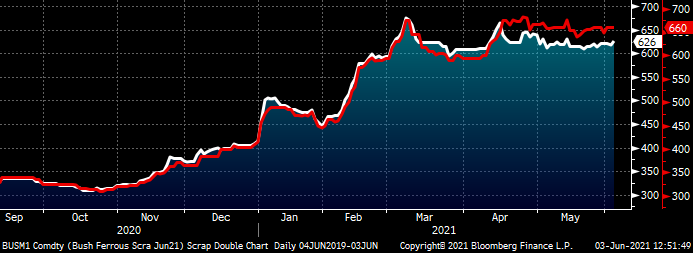
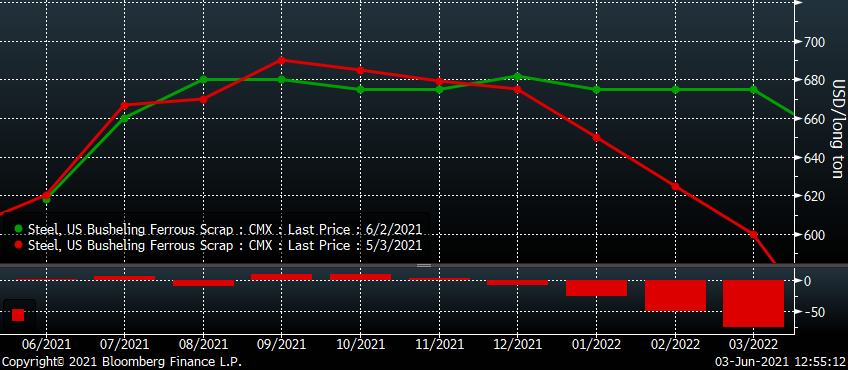
Despite the relentless rally in hot rolled, busheling futures have been mostly flat since April. The May future actually settled down slightly at $564.07. With a week to go, June busheling scrap is rumored to be up $50 at $615. The July CME busheling future trading today at $660 indicates further price appreciation in scrap.
Rolling Front (red) & 2nd (white) Month CME Busheling Future $/lt
The busheling curve increases to $680 in August and then remains at those elevated prices through year-end. After that, the curve falls back toward $600. It will be interesting to see how the supply and demand play out considering the new EAF mills sparking in the coming months. Notice, busheling future’s curve is upward sloping or in contango indicating normal supply. However, the metal spread above $1,000 in June and July might provide some room for scrap to appreciate. Could you imagine $800 busheling? Keep an open mind in ’21.
CME Busheling Futures Curve $/lt
Disclaimer: The content of this article is for informational purposes only. The views in this article do not represent financial services or advice. Any opinion expressed by Feldstein should not be treated as a specific inducement to make a particular investment or follow a particular strategy, but only as an expression of his opinion. Views and forecasts expressed are as of date indicated, are subject to change without notice, may not come to be and do not represent a recommendation or offer of any particular security, strategy or investment. Strategies mentioned may not be suitable for you. You must make an independent decision regarding investments or strategies mentioned in this article. It is recommended you consider your own particular circumstances and seek the advice from a financial professional before taking action in financial markets.


